
Menstrual Cup Market Size and Share
Market Overview
| Study Period | 2020 - 2031 |
|---|---|
| Market Size (2026) | USD 0.98 Billion |
| Market Size (2031) | USD 1.27 Billion |
| Growth Rate (2026 - 2031) | 5.38 % |
| Fastest Growing Market | Asia-Pacific |
| Largest Market | North America |
| Market Concentration | Low |
Major Players *Disclaimer: Major Players sorted in no particular order Image © Mordor Intelligence. Reuse requires attribution under CC BY 4.0. | |
Menstrual Cup Market Analysis by Mordor Intelligence
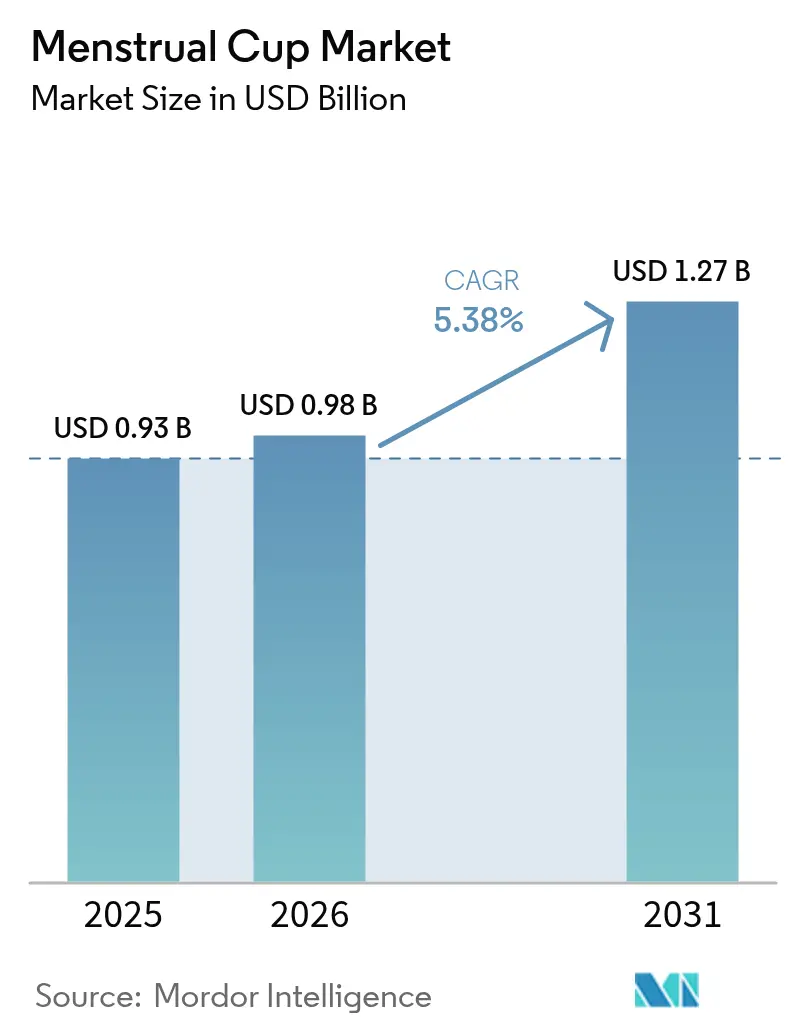
The menstrual cup market size is expected to grow from USD 0.93 billion in 2025 to USD 0.98 billion in 2026 and is forecast to reach USD 1.27 billion by 2031 at 5.38% CAGR over 2026-2031.
Robust momentum comes from a sweeping consumer shift toward reusability, cost savings, and reduced waste. Across regions, sustainability credentials outweigh convenience, supported by data showing a 90% carbon-footprint drop versus tampons. Governments further boost demand through period-poverty schemes, while e-commerce removes access hurdles and supplies detailed educational content. Intensifying material innovation, especially thermoplastic elastomer (TPE), widens product choice, and North America’s early adoption underpins steady baseline demand even as Asia-Pacific leads incremental growth. Collectively, these factors position the menstrual cups market for durable expansion through the decade.
Key Report Takeaways
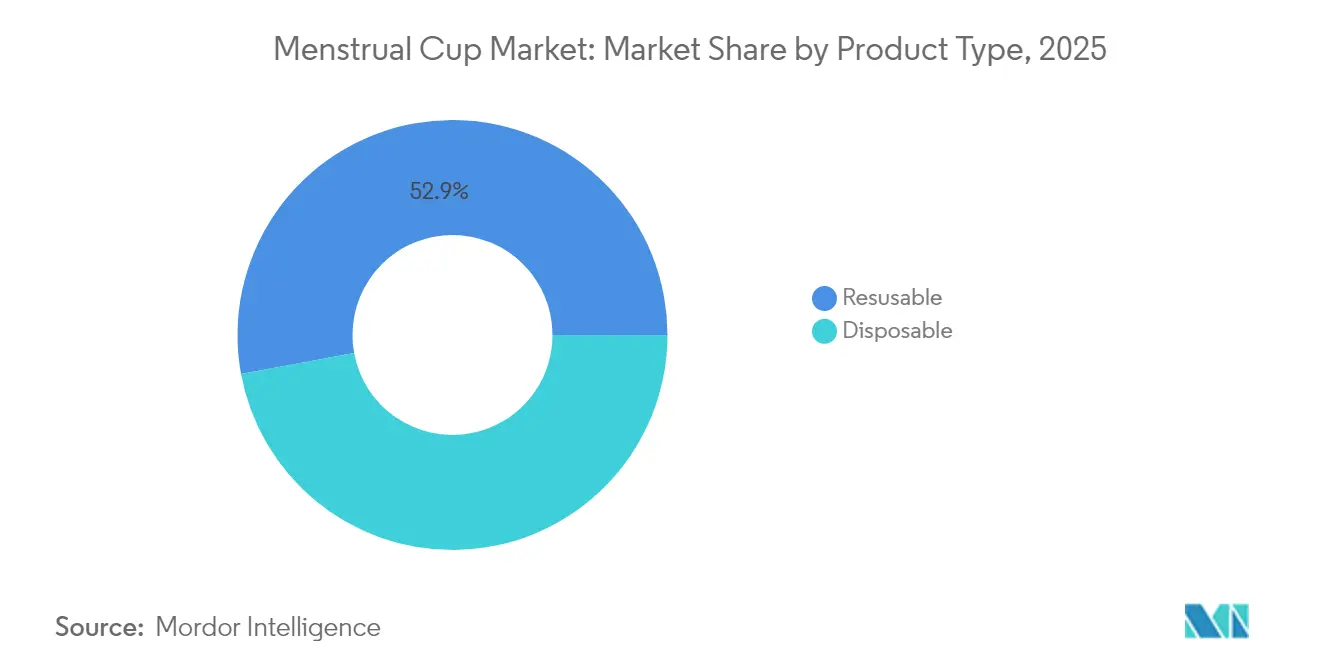
- By product type, reusable variants held 52.90% of menstrual cups market share in 2025, whereas disposable cups posted the quickest 6.83% CAGR to 2031.
- By material, medical-grade silicone led with 70.10% revenue share in 2025; TPE is forecast to expand at a 7.21% CAGR through 2031.
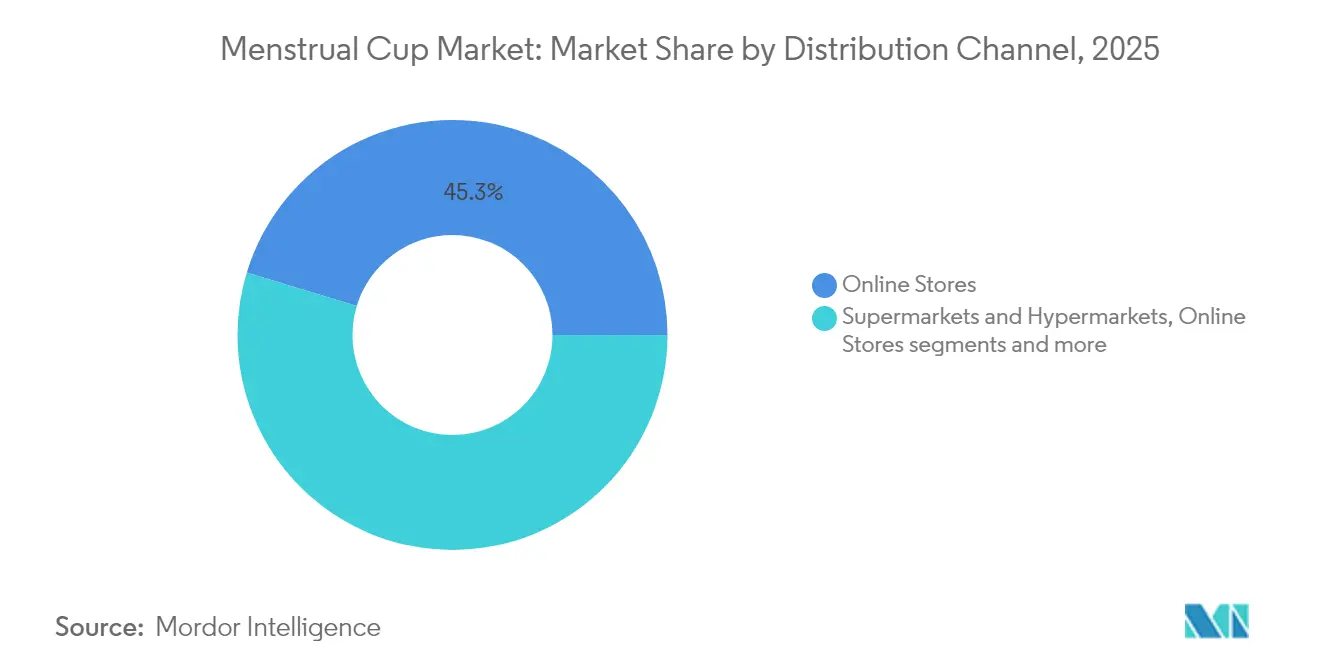
- By distribution channel, online stores accounted for 45.30% of the menstrual cups market size in 2025 and are advancing at an 8.05% CAGR.
- By geography, North America commanded 38.40% share in 2025, while Asia-Pacific is projected to grow at a 8.85% CAGR through 2031.
Note: Market size and forecast figures in this report are generated using Mordor Intelligence’s proprietary estimation framework, updated with the latest available data and insights as of 2026.
Market Trends and Insights
Drivers Impact Analysis of Menstrual Cup Market*
| Driver | (~) % Impact on CAGR Forecast | Geographic Relevance | Impact Timeline |
|---|---|---|---|
| Surge in sustainability-driven consumer behaviour | +1.2% | Global, strongest in North America & EU | Medium term (2-4 years) |
| Long-term cost advantage versus disposables | +0.9% | Global, particularly emerging markets | Long term (≥ 4 years) |
| Expanding e-commerce & DTC fulfilment models | +0.8% | Global, led by North America & APAC | Short term (≤ 2 years) |
| Government "period-poverty" schemes distributing free cups | +0.6% | EU, North America, select APAC markets | Medium term (2-4 years) |
| Medical-grade TPE enabling hypoallergenic, ultra-thin cups | +0.4% | Global, early adoption in developed markets | Long term (≥ 4 years) |
| Social-media influencer advocacy among Gen-Z | +0.3% | Global, strongest in North America & EU | Short term (≤ 2 years) |
| Source: Mordor Intelligence | |||
Surge in Sustainability-Driven Consumer Behaviour
Multiple life-cycle studies in France, India, and the United States confirm that one cup offsets its embodied emissions within a month of use, amplifying environmental value across a 10-year lifespan. Each unit removes roughly 2,500 tampons from landfill streams. Gen-Z and millennial cohorts actively reward brands with visible climate commitments, reshaping category messaging across the menstrual cups market. Waste-reduction statistics, such as Scotland’s annual disposal of 427.5 million single-use period items, sharpen consumer resolve[1]. The alignment of ecological values and personal health preference sustains demand and encourages repeat purchases.
Long-Term Cost Advantage Versus Disposables
One cup can replace close to 3,250 tampons over 10 years, offering compelling household savings that outweigh higher entry price. Cost messaging resonates in price-sensitive economies and is amplified when linked to accessibility initiatives, as shown in Japan, Indonesia, and France where cost information proved a stronger influence than health claims. Subsidy programs cut first-purchase barriers; for instance, Peterborough City Council sells Mooncups at GBP 5 (USD 6.25) compared with the regular GBP 20 (USD 25), driving trial rates. This financial edge becomes more pronounced as inflation lifts the ongoing price of disposables, reinforcing the menstrual cups market growth narrative.
Expanding E-Commerce & DTC Fulfilment Models
Online channels provide privacy and detailed tutorials that demystify sizing, insertion, and care routines, explaining why they now hold 44.90% channel share with an 8.26% CAGR. Direct-to-consumer storefronts foster community and offer subscription accessories such as sterilizers, which increase lifetime value. Forum Brands’ purchase of Lola validates investor appetite for digital-native period-care assets. For small entrants, e-commerce lowers geographic entry costs and accelerates brand visibility, expanding the menstrual cups market both horizontally and vertically.
Government “Period-Poverty” Schemes Distributing Free Cups
Public programs normalize cup use and reach demographics otherwise unable or unwilling to pay. Catalonia’s pharmacy initiative distributes reusable products to 2.5 million people, illustrating rapid scale potential. Wales earmarked GBP 3.25 million to supply 90-100% eco-friendly period products by 2027, embedding reusables in public discourse. Canada’s CAD 29.8 million Menstrual Equity Fund extends the model across 400 sites [2]. The resulting product trials generate peer advocacy, further enlarging the menstrual cups market.
Restraints Impact Analysis of Menstrual Cup Market*
| Restraint | (~) % Impact on CAGR Forecast | Geographic Relevance | Impact Timeline |
|---|---|---|---|
| Cultural stigma & low awareness in emerging economies | -1.1% | APAC emerging markets, MEA, parts of South America | Long term (≥ 4 years) |
| Steep learning curve for first-time users | -0.7% | Global, particularly first-time user segments | Medium term (2-4 years) |
| Lack of product standards → counterfeit/low-quality cups | -0.5% | Emerging markets, online marketplaces | Medium term (2-4 years) |
| Water-scarcity challenges for cleaning & sterilising cups | -0.3% | Sub-Saharan Africa, parts of APAC, arid regions | Long term (≥ 4 years) |
| Source: Mordor Intelligence | |||
Cultural Stigma & Low Awareness in Emerging Economies
Taboos surrounding menstruation hinder open discussion and product experimentation. A Nepalese study found worries about virginity loss to be a major barrier among schoolgirls NCBI. In South Korea, only 1.6% of women aged 18-45 have adopted cups despite rising health concerns with disposables OPHRP. Effective outreach therefore hinges on culturally sensitive education delivered by trusted community figures. Without this groundwork, the menstrual cups market penetration stalls and counterfeit products proliferate, undermining user confidence.
Steep Learning Curve for First-Time Users
Insertion challenges, leakage, and discomfort cause early abandonment: an Australian survey reported a 54% leakage rate on first use with 25% experiencing pain. Success improves after several cycles, yet many new users quit before reaching that milestone. Brands now bundle sizing quizzes, animated tutorials, and customer support to shorten the adjustment period. Technological advances such as Sunny’s FDA-cleared applicator cup signal further relief. Overcoming this hurdle is pivotal for sustained growth of the menstrual cups market.
*Our forecasts treat driver/restraint impacts as directional, not additive. The impact forecasts reflect baseline growth, mix effects, and variable interactions.
Menstrual Cup Market Segment Analysis
By Product Type:
Reusable Dominance Drives InnovationReusable models owned 52.90% of menstrual cups market share in 2025 while advancing at a 6.41% CAGR. Lower lifetime cost and strong eco-benefits position them as the default choice in most regions. Single-use cups satisfy niche travel and low-water contexts but conflict with the core sustainability narrative powering overall demand. Material research amplifies reusable value: Virginia Tech scientists demonstrated alginate-glycerol gels that solidify menstrual fluid, which could reduce leakage without undermining reusability Gizmodo. Should such features commercialize, reusable leadership will widen as form factors become easier to manage during heavy flow.
Market education highlights cleaning simplicity with compact sterilizers, and community testimonials reassure first-time users. Government agencies increasingly prefer reusable products for public procurement, cementing their primacy in the menstrual cups market. Yet manufacturers still monitor single-use formats for humanitarian aid or disaster scenarios where sterilization remains difficult. Balanced portfolios allow firms to hedge against regional water scarcity, keeping the menstrual cups industry resilient across diverse operating environments.

By Material:
Silicone Leadership Faces TPE InnovationMedical-grade silicone accounted for 70.10% of 2025 revenue, buoyed by decades of clinical acceptance and durable supply chains. The segment embeds the menstrual cups market size for premium users who trust its biocompatibility and 10-year life. However, TPE’s 7.21% CAGR illustrates appetite for softer, hypoallergenic options. KRAIBURG TPE’s THERMOLAST M extends usable life to 12 years and resolves heavy-metal concerns, providing new competitive ground KRAIBURG TPE.
Silicone will remain dominant because of extensive regulatory clearances, but firms gradually introduce blended portfolios that accommodate consumers sensitive to stiffness or latex cross-allergy. Ongoing R&D seeks to equal silicone’s resilience while boosting comfort, an approach that diversifies revenue without destabilizing existing production. Strategic sourcing from FDA-compliant suppliers preserves brand integrity as counterfeit risk rises in the menstrual cups market.
By Distribution Channel:
Digital Transformation AcceleratesOnline outlets generated 45.30% of the menstrual cups market size in 2025 and are growing at 8.05% CAGR as shoppers favor the discretion, product depth, and peer reviews offered by e-commerce. Digital storefronts optimize search visibility and funnel traffic to brand-hosted tutorial libraries, which lower the steep learning curve. DIVA International’s impact program leverages these channels to distribute 75,000 cups alongside social-impact storytelling
Pharmacies still con fer professional credibility, and supermarkets sustain impulse purchases, but both face lower growth trajectories. Specialty feminine-care shops curate high-end assortments and in-person fitting advice, cushioning their premium pricing. Direct-to-consumer models foster subscriptions for cleaning tablets or lubricant gels, unlocking repeat revenue and high-margin kits. The shift tilts bargaining power toward brands that master digital literacy and retention metrics, a defining feature of the evolving menstrual cups market.
Geography Analysis
North America Menstrual Cup Market
North America retained 38.40% revenue share in 2025 due to high awareness, favorable regulation, and mature e-commerce logistics. Canada’s CAD 29.8 million Menstrual Equity Fund raises adoption further by normalizing cups across public settings Government of Canada. Penetration is already high among younger cohorts, so future growth hinges on technological upgrades and value-added accessories rather than first-time conversions.
EMEA, South America and APAC Menstrual Cup Market
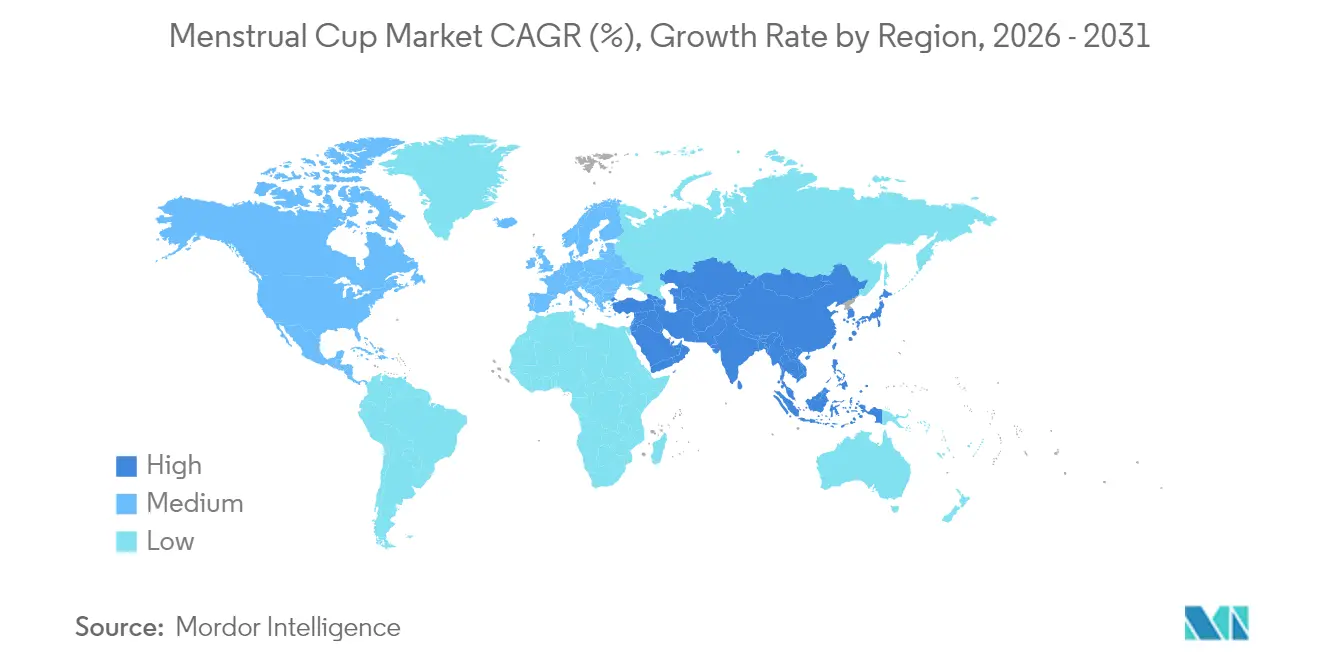
Asia-Pacific is the growth engine, demonstrating a 8.85% CAGR to 2031. Rising disposable incomes, improved menstrual-health literacy, and wide-scale public projects such as India’s Thinkal distribution of 1 million units underscore latent demand. South Korea’s low 1.6% usage rate indicates vast runway once social barriers are addressed. Companies tailor marketing to local norms and partner with NGOs for village-level workshops, steadily enlarging the menstrual cups market. Europe sustains growth via strict waste mandates and publicly funded product schemes. Catalonia’s pharmacy rollout to 2.5 million residents exemplifies swift mainstreaming. Wales’ target of 90-100% eco-friendly period products reinforces regional leadership. Meanwhile, South America and the Middle East & Africa hold untapped potential, but addressable demand is constrained by cultural stigma and water infrastructure limitations. Producers invest in localized translations, lower-price SKUs, and community demonstrations to lay groundwork for future menstrual cups market expansion.
Regulatory Landscape
In the United States, menstrual cups are regulated by the FDA as Class II medical devices under 21 CFR 884.5400 (Product Code HHE). While they are generally exempt from 510(k) premarket notification, manufacturers still must meet establishment registration and device listing obligations, and comply with applicable quality and labeling requirements. FDA activity has also moved toward more explicit benchmarks, with a draft guidance issued on November 17, 2025 covering performance testing and labeling recommendations for menstrual cups.
In the European Union, menstrual cups are commonly treated as general consumer products rather than medical devices when they do not claim a medical intended purpose, bringing them under the EU General Product Safety framework (Regulation (EU) 2023/988). In Australia, the Therapeutic Goods Administration requires products supplied in-country to meet the Therapeutic Goods (Standard for Menstrual Cups) (TGO 99) Order 2018, reinforcing a more formalized standard-setting environment than many other markets. Across geographies, conformity to ISO 10993 (biological evaluation) and ISO 13485 (quality management) is widely used as an anchor for safety substantiation and manufacturing control.
Value Chain Analysis
Upstream supply for menstrual cups centers on medical-grade polymers, led by platinum-cured liquid silicone rubber supply and, increasingly, thermoplastic elastomers (TPE) used for softer designs. Material suppliers with strong documentation and batch traceability matter because brand owners and private-label programs depend on verifiable inputs to support biocompatibility and contaminant controls aligned with expectations such as ISO 10993, alongside quality-system practices aligned with ISO 13485.
Midstream manufacturing is dominated by OEM/ODM molders that specialize in precision molding, curing/vulcanization, demolding, trimming, and post-processing steps such as annealing/tempering to reduce residual volatiles and stabilize product performance. Downstream, brands distribute through a mix of pharmacy/retail and rapidly scaling online and DTC channels, where education and sizing guidance are bundled with the product to reduce first-use failures. That shifts attention toward packaging, labeling, and digital content in the value chain, especially for cross-border marketplace sales where counterfeit and low-quality listings can dilute consumer trust and increase returns.
Competitive Landscape
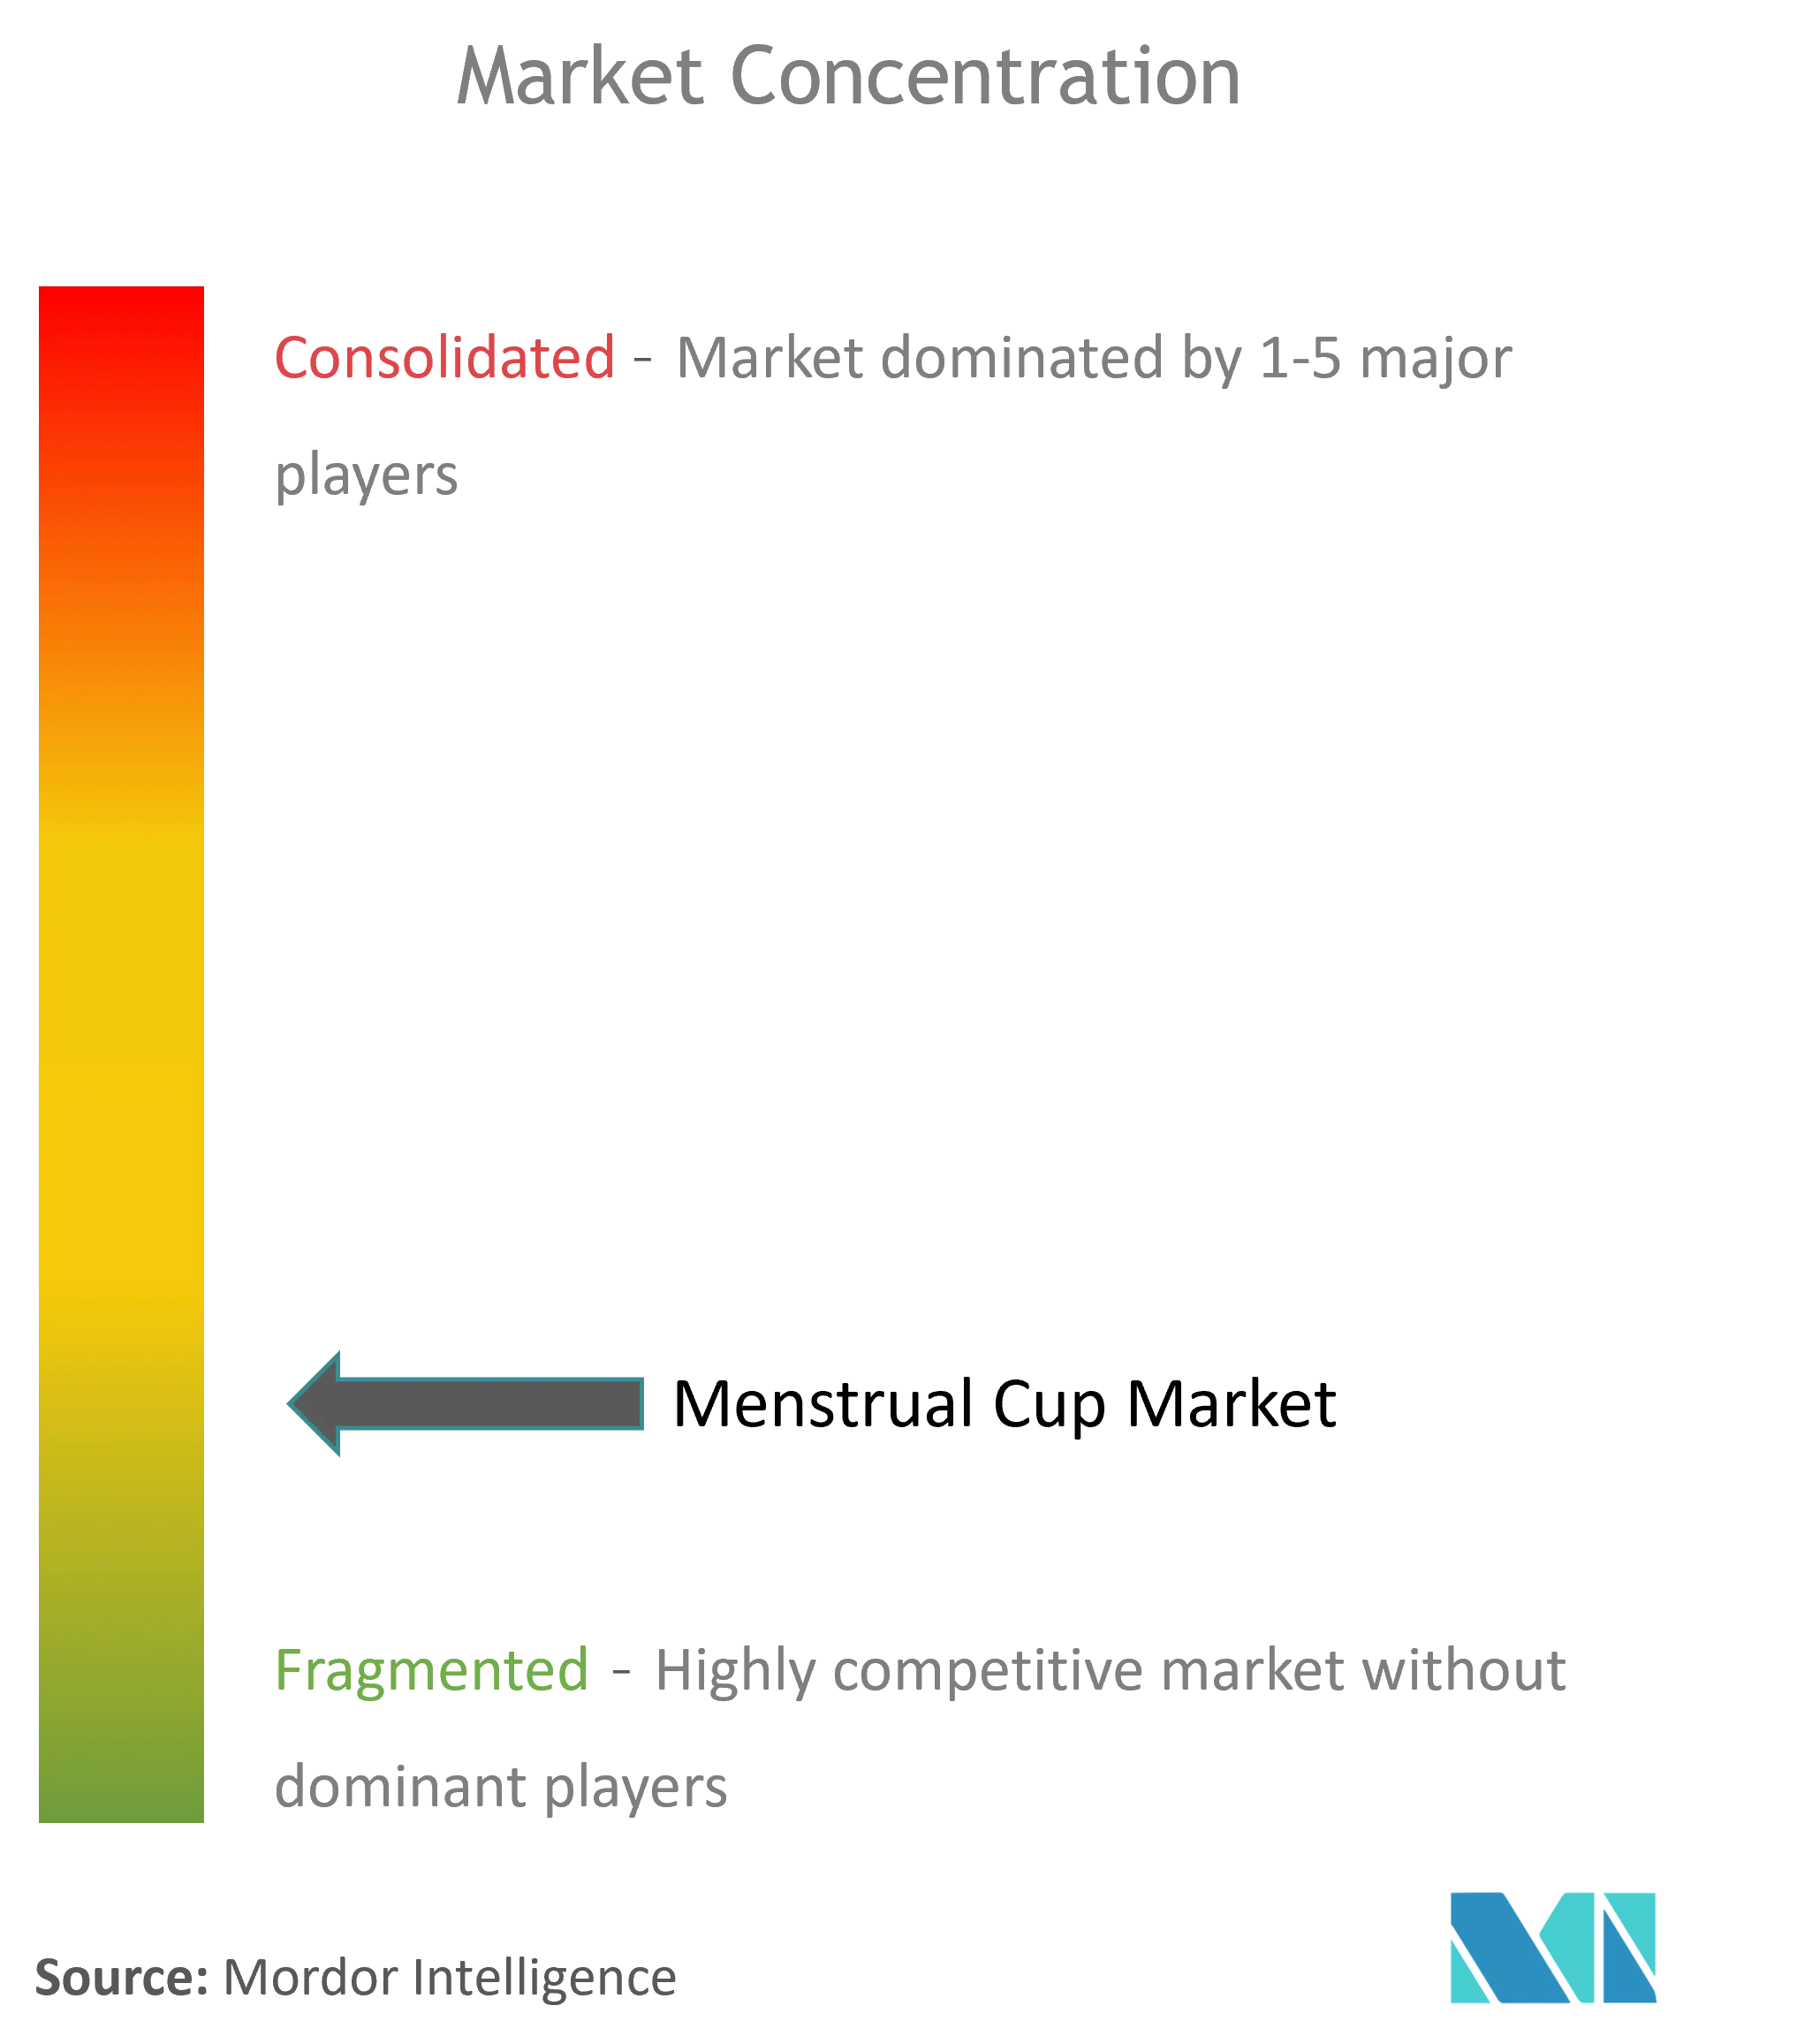
The menstrual cups market is moderately fragmented, with established leaders—DIVA, Mooncup, Lunette—holding brand equity built over nearly two decades. These incumbents emphasize certifications such as B Corp status and FDA 510(k) clearances to reassure safety-conscious consumers. Mid-sized challengers differentiate through material science: Sunny secured FDA clearance for an applicator-equipped design that mimics tampon familiarity.
R&D alliances with universities accelerate next-generation prototypes, including Virginia Tech’s blood-solidifying biomaterial that promises leak mitigation without disposables. Strategic acquisitions, such as Forum Brands buying Lola, signal growing interest from consumer-product aggregators. At the same time, Lune Group’s bankruptcy in 2024 highlights scale pressures for niche players whose unit economics cannot absorb rising digital advertising costs.
Leading firms double down on impact marketing, distributing free cups in under-served communities, which both advances social mission and seeds future demand. Material suppliers like KRAIBURG TPE position themselves as enablers of product diversification, partnering with manufacturers to prototype softer, hypoallergenic lines. Overall, competitive intensity centers on comfort innovations, influencer credibility, and omnichannel reach, shaping the forward trajectory of the menstrual cups market.
Menstrual Cup Industry Leaders
-
Diva International Inc.
-
Mooncup Ltd
-
Me Luna GmbH
-
Lena Cup LLC
-
The Flex Company
- *Disclaimer: Major Players sorted in no particular order
Menstrual Cup Market Companies Covered in this Report
- Diva International
- Lunette
- Mooncup Ltd.
- Saalt
- Intimina (Essity)
- The Keeper Inc.
- MeLuna GmbH
- Anigan Inc.
- Blossom Cup
- Lena Cup
- Pixie Cup
- Ruby Life Ltd. (Ruby Cup)
- FemmyCycle
- Sirona Hygiene
- AllMatters (OrganiCup)
- LadyCup
- Soft Cup (Instead)
- Merula Cup
- Mermaids Cup
- SheCup
Market Opportunities and Future Outlook
Institutional procurement and publicly backed menstrual health programs continue to open large-volume channels for menstrual cups, alongside sustainability-led purchasing criteria that favor reusables. A concrete example is HLL Lifecare in India, which in May 2026 upgraded menstrual cup manufacturing under the Thinkal project and raised total annual production capacity to 5 million units (including 3 million units per year from its Akkulam facility in Thiruvananthapuram), indicating greater readiness for state-led distribution and broader affordability-driven access.
Product-led opportunities focus on easing the learning curve and strengthening safety and quality signaling across markets and online storefronts. The FDA draft guidance issued in November 2025 on performance testing and labeling recommendations increases the emphasis on standardized substantiation and clearer labeling, creating space for brands that can document materials, contaminants, and performance consistently across geographies. With online stores already a large route to market, companies that pair compliant manufacturing with stronger user onboarding (fit tools, care routines, accessories such as sterilizers) and partnerships that connect menstrual products to broader women’s health services have a clearer pathway to expand adoption beyond early users while reducing churn tied to first-cycle leakage and discomfort.
Recent Industry Developments in Menstrual Cup Market
- May 2026: HLL Lifecare upgraded menstrual cup manufacturing under the Thinkal project and increased total annual production capacity to 5 million units, including 3 million units per year at its Akkulam facility in Thiruvananthapuram. The move supports higher-volume institutional supply and strengthens India-based manufacturing options for programmatic distribution and private-label sourcing.
- May 2025: Wales allocated GBP 3.25 million for free period products across schools and communities, with a stated aim of reaching 90-100% eco-friendly options by 2027. This type of funded procurement normalizes reusable products and creates sustained tender-driven demand alongside retail channels.
- December 2024: Bettii Pod raised GBP 400,000 to advance public-toilet washing solutions for menstrual cups. Improving access to cleaning infrastructure reduces a practical adoption barrier and supports broader use in workplaces, schools, and travel-heavy settings.
Menstrual Cup Market Report Scope and Research Methodology
Market Definition and Coverage
For this study, the menstrual cup market covers revenue generated from selling menstrual cups to end users through online and offline channels, captured at the product sales value level in USD across major regions.
Scope exclusions: We exclude related menstrual hygiene products like pads, tampons, period underwear, liners, and reusable applicators, and we also exclude clinical procedure revenues and general gynecology services.
Segments Covered in This Report
- By Product Type
- Reusable Menstrual Cups
- Disposable/Single-use Menstrual Cups
- By Material
- Medical-grade Silicone
- Natural Rubber (Latex)
- Thermoplastic Elastomer (TPE)
- By Distribution Channel
- Pharmacies & Retail Stores
- Supermarkets & Hypermarkets
- Online Stores (Company DTC, Marketplaces)
- Specialty Feminine-Care Stores
- By Geography
- North America
- United States
- Canada
- Mexico
- Europe
- Germany
- United Kingdom
- France
- Italy
- Spain
- Rest of Europe
- Asia-Pacific
- China
- India
- Japan
- South Korea
- Australia
- Rest of Asia-Pacific
- South America
- Brazil
- Argentina
- Rest of South America
- Middle East and Africa
- GCC
- South Africa
- Rest of Middle East and Africa
- North America
Data Sources, Market Sizing, and Validation
Desk Research
Desk research was used to set the guardrails of the model and keep definitions and usage patterns consistent across regions. We referenced public health and population inputs from sources such as the World Health Organization, the United Nations Population Division, and the World Bank, then used trade and customs statistics from sources such as UN Comtrade to understand cross-border movements of relevant product categories.
To add product and compliance context, we reviewed standards and safety references such as FDA public information and international standards bodies, along with peer-reviewed papers indexed in PubMed that discuss adoption, safety, and usage duration. These usage duration inputs were used to inform replacement cycles in the model. Channel and brand signals were checked through company filings, investor presentations, and reputed press coverage, and patent databases were used to track new material and design activity. For company financials and news tracking, we also used paid database subscriptions focused on financial intelligence and press monitoring. The sources listed above are illustrative, and we also referred to additional public and paid sources to collect data, validate assumptions, and clarify open questions.
Primary Interviews and Surveys
Primary work focused on validating the demand pool and the selling price logic, since public data rarely shows a clean split for menstrual cups inside broader feminine hygiene lines. We spoke with a balanced mix of product managers, distributors, retail channel teams, healthcare educators, and materials or manufacturing specialists across key regions so assumptions on adoption, replacement rate, and channel margins could be corrected where needed.
Distribution of primary research fieldwork respondents
| Company type | Respondent position | Region |
|---|---|---|
| Top tier: 29% | CXOs: 20% | APAC: 43% |
| Mid tier: 51% | Functional/Unit leaders: 38% | EMEA: 30% |
| Smaller Players: 20% | Managers: 42% | Americas: 27% |
Market-Sizing & Forecasting
Sizing was built using a top-down demand pool approach where female population by age group, menstruating share, and estimated adoption rates were combined to reconstruct annual users. We then translated users into units using replacement cycles and multi-cup ownership assumptions. Those volumes were priced using region-specific average selling prices built from channel checks and public price points, followed by adjustments for taxes, discounts, and the online versus offline mix.
To keep the totals realistic, we corroborated the output with selective bottom-up approximations, such as sampling supplier and brand revenues where they are disclosed, checking distribution throughput with intermediaries, and cross-checking implied per capita spending against broader feminine hygiene benchmarks. Key inputs tracked in the model include adoption trajectory by region, average use life and replacement frequency, online share growth, typical price bands by material type, and the impact of awareness campaigns and regulatory clarity on conversion from disposable products. For forecasting, scenario analysis was used to reflect how fast adoption can move under different awareness and affordability paths, and consensus ranges from expert calls were used to select the central case. Where company disclosures were incomplete, gaps were handled by applying region-appropriate price and volume proxies that were rechecked through follow-up interviews.
Data Validation & Update Cycle
After the first model run, outputs were checked against independent signals such as trade trends, observed retail price ranges, and implied penetration levels that primary respondents considered feasible. Any large variances by region were flagged, and assumptions were revisited in a second pass before the numbers were finalized, followed by internal peer review to confirm the arithmetic, units, and currency conversions.
The report is refreshed annually, and interim updates are made when a material event occurs, such as a major regulatory change, a sustained pricing shift, or a meaningful channel disruption. Before delivery, we do a final update sweep so clients receive the latest view based on the newest public data and market feedback.
Mordor Intelligence's Menstrual Cup Market Size Compared Against Other Published Estimates
Published numbers for menstrual cups can vary more than expected because the category is sometimes mixed into wider feminine hygiene totals, and because the assumed replacement cycle and adoption curve are not always stated clearly. Differences also come from how companies treat online discounting, currency timing, and whether reusable and disposable cups are combined under one value line.
Retail price tracking, channel mix checks, and adoption feedback from healthcare educators are the evidence points that keep Mordor Intelligence aligned to a defined user base, a transparent replacement cycle, and realized pricing rather than list prices.
Benchmark comparison
| Source | Market Size | Gaps in Research Methodology |
|---|---|---|
| Mordor Intelligence | USD 0.98 B (2026) | |
| Trade Journal A | USD 1.83 B (2025) | This figure appears to reflect a faster adoption step-up and a higher implied unit price. It also provides limited clarity on whether pricing uses list prices instead of realized prices after online promotions and bundles. |
| Industry Portal B | USD 0.39 B (2025) | This estimate is materially lower because it likely undercounts offline retail and emerging market channels. It may also apply a conservative replacement cycle that reduces unit throughput and total value. |
Across the three values, the spread is mainly explained by adoption speed, how replacement frequency is treated for reusable products, and how price realization is handled across channels. Our method stays traceable because each step can be reviewed through population-based users, unit conversion, and price checks that can be revalidated during the next update cycle.
Key Questions Answered in the Report
What is the current size of the menstrual cups market?
The market was valued at USD 0.98 billion in 2026 and is projected to reach USD 1.27 billion by 2031.
Which product type dominates sales?
Reusable cups captured 52.90% of global revenue in 2025.
Why are online channels growing so quickly?
They combine privacy, detailed education, and direct-to-consumer support, lifting online share to 45.30% in 2025 with an 8.05% CAGR outlook.
What regions show the strongest future growth?
Asia-Pacific leads with a forecast 8.85% CAGR thanks to rising income and government hygiene campaigns.