
Market Overview
| Study Period | 2020 - 2031 |
|---|---|
| Forecast Data Period | 2026 - 2031 |
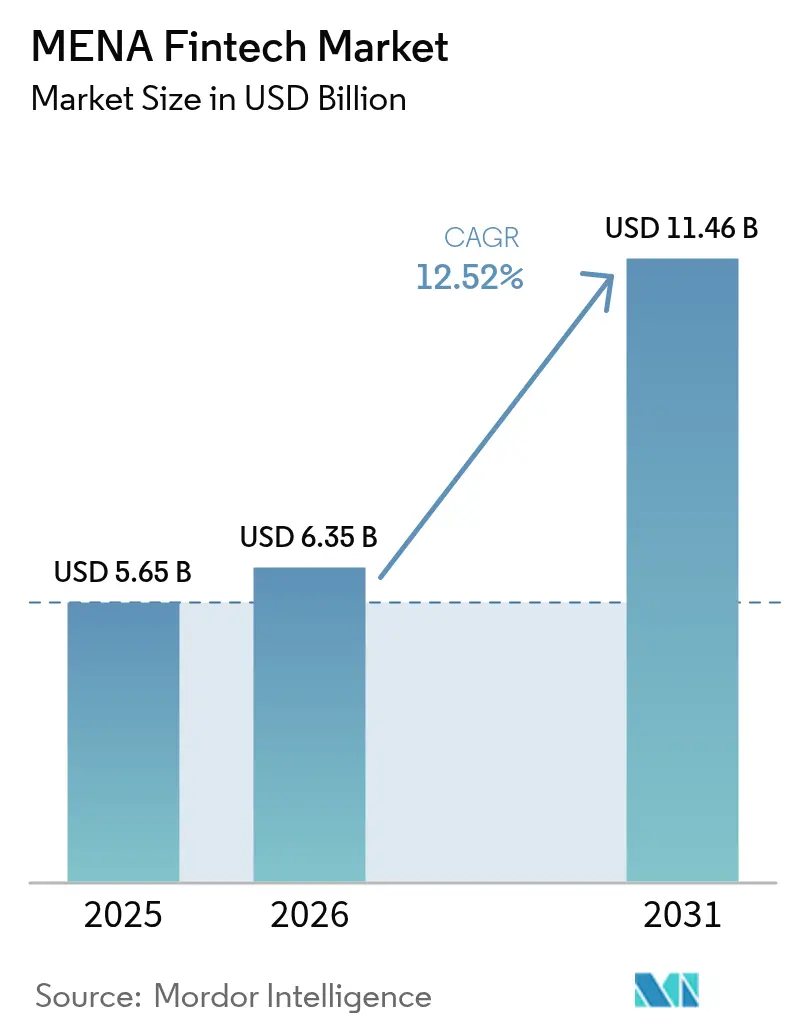
| Base Year Market Size (2025) | USD 5.65 Billion |
| Market Size (2026) | USD 6.35 Billion |
| Market Size (2031) | USD 11.46 Billion |
| Growth Rate (2026 - 2031) | 12.52 % |
| Market Concentration | Low |
Major Players *Disclaimer: Major Players sorted in no particular order Image © Mordor Intelligence. Reuse requires attribution under CC BY 4.0. | |
MENA Fintech Market Analysis by Mordor Intelligence
MENA fintech market size in 2026 is estimated at USD 6.35 billion, growing from 2025 value of USD 5.65 billion with 2031 projections showing USD 11.46 billion, growing at 12.52% CAGR over 2026-2031. A surge in cash-lite policy mandates, broad smartphone availability, and growing venture-capital inflows are expanding the addressable base for digital financial services. Central-bank digital-currency (CBDC) pilots in the GCC and Egypt are modernizing payment rails, while regulatory sandboxes in Saudi Arabia, the UAE, and Jordan shorten product launch cycles. At the same time, e-commerce, gig-economy, and remittance corridors are fuelling embedded-finance use cases. Industry participants respond through platform diversification and cross-border partnerships that create new revenue streams and consolidate fragmented positions.
Key Report Takeaways
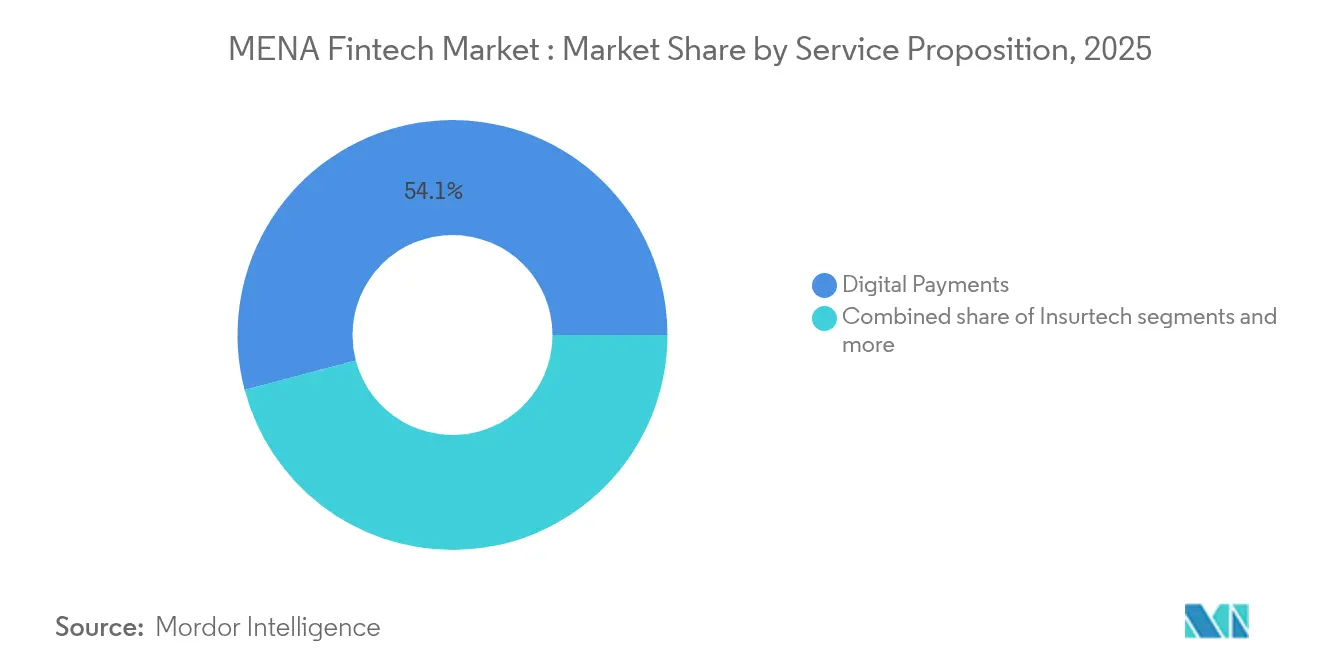
- By service proposition, digital payments captured 54.12% of the MENA fintech market share in 2025, while the MENA fintech market size for digital lending and financing is expected to grow fastest at a CAGR of 17.74% during 2026–2031.
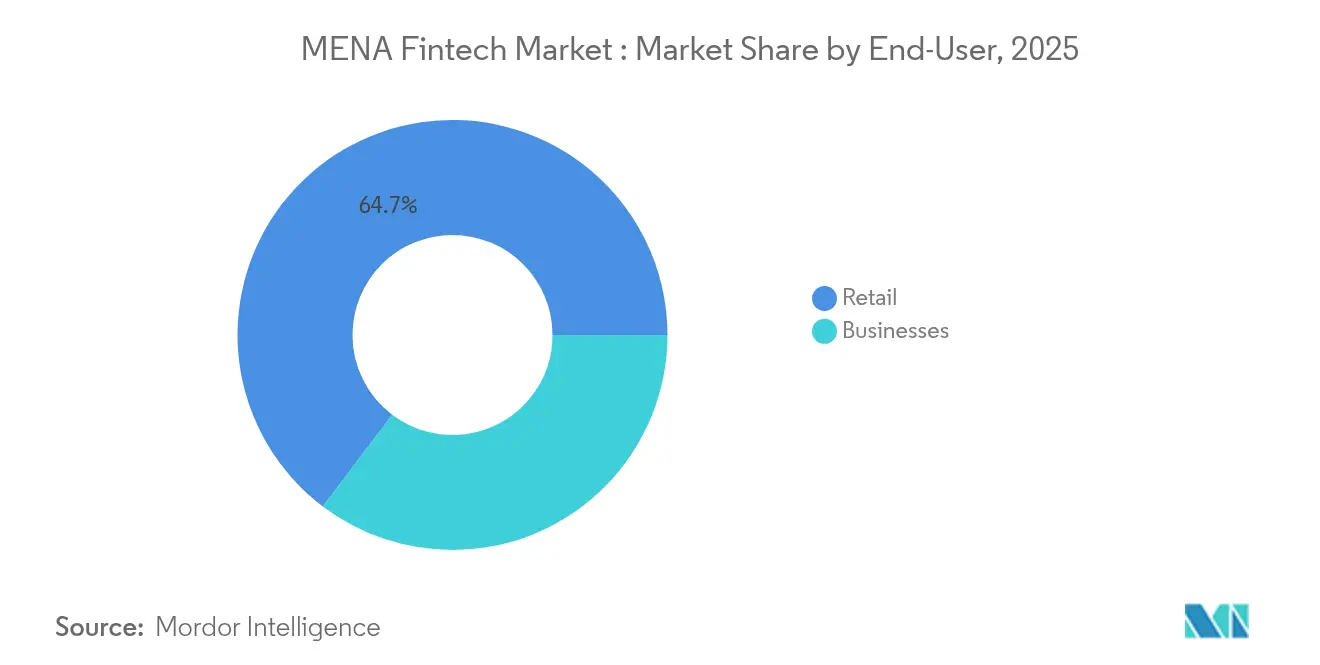
- By end-user, retail accounted for 64.70% of the MENA fintech market share in 2025, with the MENA fintech market size for businesses projected to rise at the highest CAGR of 14.18% through 2031.
- By user interface, mobile apps represented 79.62% of the MENA fintech market share in 2025, while the MENA fintech market size for POS/IoT devices is forecast to expand at a CAGR of 16.60% between 2026 and 2031.
- By geography, GCC countries held 62.75% of the MENA fintech market share in 2025, while the MENA fintech market size in North Africa is anticipated to grow at the fastest rate of 17.29% CAGR through 2031.
Note: Market size and forecast figures in this report are generated using Mordor Intelligence’s proprietary estimation framework, updated with the latest available data and insights as of 2026.
MENA Fintech Market Trends and Insights
Drivers Impact Analysis*
| Driver | (~) % Impact on CAGR Forecast | Geographic Relevance | Impact Timeline |
|---|---|---|---|
| Cash-lite & financial-inclusion mandates | +2.1% | GCC and North Africa core, Levant secondary | Medium term (2-4 years) |
| Mobile & internet penetration surge | +1.8% | Whole MENA, strongest in GCC | Short term (≤ 2 years) |
| VC funding & sandbox momentum | +1.5% | GCC primary, North Africa emerging | Medium term (2-4 years) |
| CBDC pilots enabling cross-border rails | +1.2% | GCC and Egypt primary, regional spill-over | Long term (≥ 4 years) |
| Embedded-finance demand from e-commerce & gig platforms | +0.9% | Urban centers across MENA, GCC leading | Short term (≤ 2 years) |
| Instant-payment rails unlocking alternative lending data | +0.8% | GCC and Egypt advanced, North Africa following | Medium term (2-4 years) |
| Source: Mordor Intelligence | |||


Government Cash-Lite & Financial-Inclusion Mandates Accelerate Fintech Demand
Saudi Arabia targets 70% cashless transactions by 2030, Egypt aims to bank 50% of adults by 2025, and the UAE streamlined licensing in 2024. These targets provide clear metrics for adoption and reduce go-to-market friction for private players[1]AlHuda CIBE, “The Outlook of Islamic Finance in 2025 Appears Promising,” alhudacibe.com. . Sandboxes in Jordan further cut regulatory risk, helping startups scale without prohibitive compliance spend. As governments digitize payroll and welfare transfers, consumer familiarity with e-wallets rises, lowering acquisition costs. The policy push also incentivizes retailers to deploy contactless acceptance, enlarging acceptance networks. Collectively, mandates create a virtuous circle that widens the MENA fintech market.
Mobile & Internet Penetration Surge Enables Mobile-First Financial Access
Smartphone penetration tops 80% in GCC states, turning mobiles into the default banking channel[2]MeaWallet, “The State of Tokenization in MENA,” meawallet.com. . The UAE already sees digital wallets covering 18% of POS spend, on track for 33% by 2027. Egypt and Morocco extend reach through telco-based agent models, bypassing branch infrastructure and shrinking operating costs. Gen Z users account for 23% of regional e-commerce spend via digital wallets, establishing lasting payment habits. Growing 4G/5G coverage in rural North Africa enables remote KYC onboarding, unlocking new customer pools. The mobile-first model thus propels rapid share gains across consumer cohorts.
VC Funding & Sandbox Momentum Fuel Startup Formation
Venture capital funding peaked at USD 4.2 billion in 2023 across Middle East fintech, creating capital availability that enables startup formation and scale-up activities across the region. Regulatory sandboxes in Saudi Arabia, UAE, and Jordan provide controlled environments for fintech innovation, with SAMA approving multiple neobanking licenses in 2024. The emergence of 4 regional fintech unicorns - Tabby, Tamara, MNT-Halan, and Papara - demonstrates investor confidence in MENA market potential and creates precedent for future funding rounds. Y Combinator's investment in 30+ MENA fintechs signals international investor interest and provides startups with Silicon Valley expertise and network access that accelerates product development cycles.
CBDC Pilots Enabling Cross-Border Rails Create Common API Infrastructure
Central bank digital currency initiatives across the UAE, Saudi Arabia, Qatar, and Egypt establish an interoperable payment infrastructure that reduces cross-border transaction costs and settlement times. Saudi Arabia joined the mBridge project in 2024, which establishes a multi-CBDC platform for international settlements that bypasses traditional correspondent banking networks and reduces transaction costs by up to 80%. UAE's successful completion of first CBDC payments in 2024 demonstrates technical feasibility and regulatory readiness for broader implementation, creating precedent for regional adoption. These CBDC rails enable fintech providers to offer instant cross-border remittances and trade finance solutions without maintaining correspondent banking relationships, reducing operational complexity and capital requirements.
Restraints Impact Analysis*
| Restraint | (~) % Impact on CAGR Forecast | Geographic Relevance | Impact Timeline |
|---|---|---|---|
| Regulatory fragmentation across jurisdictions | -1.9% | Pan-MENA, peak impact on cross-border players | Medium term (2-4 years) |
| Cash-centric habits inflating CAC in N. Africa | -1.4% | North Africa primary, rural GCC secondary | Long term (≥ 4 years) |
| Scarcity of Arabic AI/ML risk-scoring datasets | -1.1% | Arabic-speaking markets, North Africa core | Medium term (2-4 years) |
| Legacy core-bank IT bottlenecks | -0.7% | Established banking markets, GCC and Egypt | Short term (≤ 2 years) |
| Source: Mordor Intelligence | |||
Regulatory Fragmentation Across Jurisdictions Increases Compliance Burden
Nineteen different licensing regimes require fintechs to form market-specific entities, adding 15-25% to overheads versus unified frameworks. Disparate capital and data-localization rules hinder passporting and delay regional scaling. Larger incumbents absorb the cost but startups face resource strain, limiting innovation diversity. Lack of mutual recognition also hampers cross-border open-API linkage, creating integration dead-zones. Investors price the risk into valuations, nudging consolidation as a workaround for multi-country reach.
Cash-Centric Habits Inflate Customer-Acquisition Costs in North Africa
Cash still dominates more than 80% of Egyptian retail spending, forcing digital players to fund education campaigns and cash-in/out agent grids[3]Arabian Business, “Cross-Border Remittances – Latest News,” arabianbusiness.com. . Marketing outlays inflate CAC by up to 60% against GCC benchmarks. Hybrid models that accept cash erode gross margins, extending breakeven timelines. In rural Morocco, low digital literacy slows wallet activation despite growing 4G coverage. Fintechs must also invest in fraud guarantees to offset trust deficits, further compressing unit economics.
*Our forecasts treat driver/restraint impacts as directional, not additive. The impact forecasts reflect baseline growth, mix effects, and variable interactions.
Segment Analysis
By Service Proposition: Digital Payments Dominate While Lending Scales Fast
Digital payments controlled 54.12% of MENA fintech market share in 2025, underpinned by near-ubiquitous smartphone wallets and aggressive merchant-acquiring incentives. The sub-segment added new rails such as QR and tokenized wallet checkout, further cementing stickiness. Digital lending, though smaller, is growing at an 17.74% CAGR on the strength of real-time alternative-data scoring. Fawry’s EGP 1 billion disbursement surge in 2025 illustrates payments-to-credit adjacency.
Robo-advisory and insurtech expand via API-first distribution, while neobanks like STC Bank convert wallet bases into full-service accounts. Regulatory sandboxes allow parametric and usage-based policies, fostering experimentation. Cross-sell synergies emerge as payments brands add credit, investment, and insurance tabs within the same app, stretching user lifetime value. The diversification push points to escalating platform convergence across the MENA fintech market.


By End-User: Retail Remains Core but Business Uptake Accelerates
Retail users held 64.70% of segment spend in 2025, anchored by mass-market wallets and BNPL checkout adoption. Yet business demand is climbing at 14.18% CAGR as SMEs adopt embedded-finance modules for invoicing, payroll, and supply-chain finance. Gig-economy platforms integrate instant pay and micro-loans, smoothing irregular earnings cycles. Merchant dashboards import real-time POS data into credit-scoring engines, shortening loan approval to minutes. Enterprises favor fintech rails for cross-border vendor payouts, leveraging CBDC corridors in the GCC. As a result, the MENA fintech market sees a steady re-balance toward B2B monetization.
By User Interface: Mobile Leads, POS & IoT Ascend
Mobile apps captured 79.62% of interface traffic in 2025, reflecting user preference for on-demand micro-transactions. Tokenization upgrades cut fraud rates and raise wallet-checkout share to a projected 34% of e-commerce spend by 2027. Meanwhile, smart-POS and IoT terminals grow at 16.60% CAGR as merchants deploy contactless tap-to-phone and soft-POS solutions. Fawry’s dual CPoC/MPoC accreditation in 2024 positions it to scale software-only acceptance. Vehicle-based toll and parking payments illustrate IoT expansion, hinting at ambient commerce experiences.
Browser portals keep niche traction for wealth-management dashboards where larger screens aid analysis. Voice and biometric interfaces remain experimental but benefit from regional language-model improvements. The interface mix thus broadens reach while deepening data capture within the MENA fintech market.
Geography Analysis
The GCC represented 62.75% of transactional value in 2025 on the back of high GDP per capita and cohesive regulatory backing. Saudi Arabia green-lit multiple neobanks in 2024, boosting competition and spurring wider digital adoption. Dubai’s DIFC supports tokenized bond pilots, drawing global innovators seeking a proving ground. Bahrain and Qatar extend complementary sandboxes, promoting cross-GCC passportability. CBDC proof-of-concepts across these states align settlement standards, simplifying regional scaling for fintech issuers.
North Africa, clocking a 17.29% CAGR to 2031, benefits from Egypt’s 104 million population and expansive unbanked base. Thirteen Egyptian fintechs made Forbes ME’s Fintech 50, signalling ecosystem maturity. Morocco’s Casablanca Finance City anchored new regulations that fast-track e-money licensing, while Tunisia leverages telco agents to reach rural users. Network International’s partnership with Money Fellows shows GCC-North Africa infrastructure synergy.
The Levant segment is smaller but strategically positioned. Jordan’s sandbox routes present a clear regulatory runway, while Lebanon’s diaspora remittances sustain sizable FX flows despite domestic turmoil. Fintechs link GCC salary corridors to Levantian wallets, cutting fees versus legacy transfer options. Cross-regional platforms thus treat the Levant as a hub to stitch together north-south remittance and trade lanes within the broader MENA fintech market.
Regulatory Landscape
Fintech regulation in MENA continues to shift from sandbox-led experimentation toward broader licensing and supervision, with rules still varying across jurisdictions. In Saudi Arabia, the Saudi Central Bank (SAMA) operates an always-open Regulatory Sandbox, and on 26 March 2026 it commenced official licensing of open banking providers. This moves open-banking activity into a formal supervisory regime with higher requirements for resilience, governance, and consumer protection.
In the UAE, Federal Decree-Law No. (6) of 2025 took effect on 16 September 2025, broadening the regulatory scope to cover open finance and virtual-asset payment services. This was complemented by the CBUAE Open Finance Regulation (C 03/2025), issued on 10 July 2025, and entities affected by the 2025 Decree-Law received a transition window until 16 September 2026 to align with the updated licensing requirements. In Egypt, the Financial Regulatory Authority (FRA) issued Decree No 43 on 24 February 2026, suspending new applications for consumer finance company licenses under the FinTech Law for one year, which points to tighter scrutiny in non-bank financial services.
Value Chain Analysis
The MENA fintech value chain typically begins with funding, product design, and licensing, then moves into core infrastructure and distribution. Regulators and rulebooks (including SAMA payment and payment services implementing regulations and the CBUAE rulebook) set requirements for onboarding, AML/CFT, and operational controls, while banks and non-bank financial institutions provide settlement accounts, balance-sheet capacity for lending, and regulated access to payment systems. Card schemes and domestic rails, switching and processing providers (including Network International), and fraud, identity, and risk vendors make up the transaction layer relied on by fintech apps, BNPL providers, and merchant platforms for authorization, clearing, dispute handling, and data exchange.
Distribution and servicing are carried out through mobile apps, merchant acquirers, POS/softPOS networks, e-commerce platforms, and agent networks, particularly in cash-heavy North Africa. Interoperability and compliance remain recurring bottlenecks, since cross-border scaling often requires integration with multiple domestic rails and localized licensing. Processors and bank partners can reduce time-to-market by acting as integrators, and the value chain increasingly rewards players that combine acceptance (merchant acquiring and POS), data connectivity (open-banking style integrations), and regulated product breadth (payments, lending, and insurance) in a single platform that can be embedded into retail and SME workflows.
Competitive Landscape
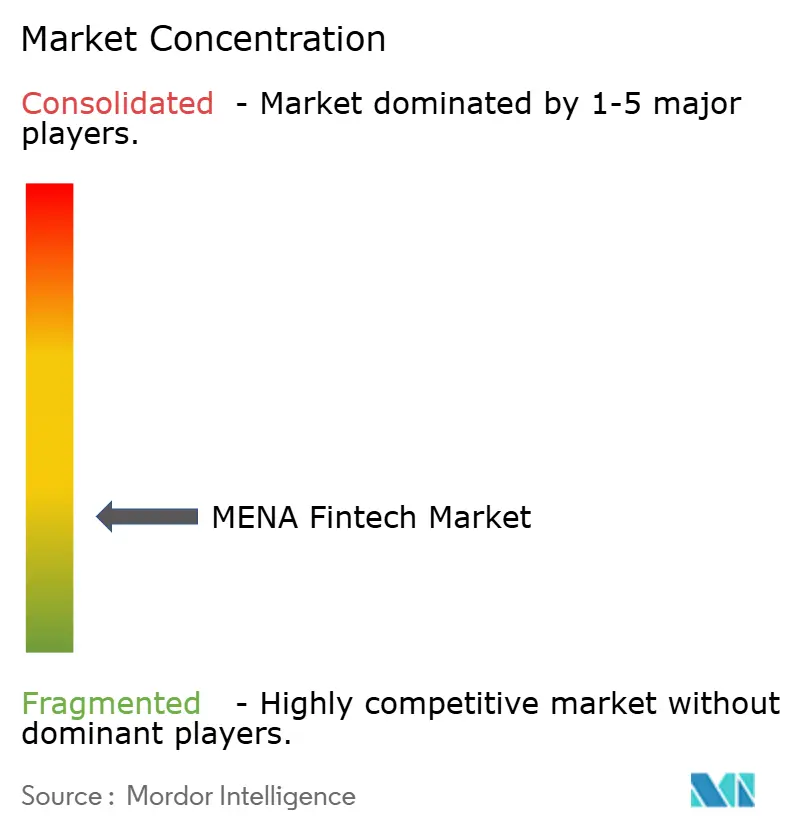
The MENA fintech market is characterized by fragmented competition, with the top five players holding a significant share in 2024. This fragmentation signals strong consolidation potential, as seen in recent M&A activities like MNT-Halan’s acquisition of Turkish lender Tam Finans and Disruptak’s purchase of CIB’s stake in Khazna. Unlike mature fintech markets, market concentration in MENA remains low due to diverse regulatory frameworks and the rise of country-specific champions. These local players leverage in-depth market knowledge and strong regulatory ties to fend off international competition. Successful regional firms such as Fawry exemplify a strategic shift toward platform expansion and cross-border scaling, branching out from payments into BNPL, microfinance, and B2B services to diversify revenue and boost customer lifetime value.
White-space opportunities are emerging in areas such as Islamic fintech, particularly products aligned with ESG mandates that are gaining traction in the region. There is also untapped potential in streamlining cross-border remittance corridors between the GCC and North Africa, along with embedded finance solutions tailored for underserved SMEs. These SMEs often lack access to traditional banking, making fintech innovation crucial for financial inclusion. Technology adoption trends include AI-driven credit scoring, blockchain-enabled cross-border payments, and open banking APIs that support third-party integrations and foster ecosystem growth. The partnership between TAMAM, ZainTECH, FICO, and Lean Technologies exemplifies how strategic collaborations can merge telecom, data analytics, and open banking to build competitive full-service fintech platforms.
Emerging fintech disruptors are utilizing mobile-first platforms and alternative data sources to reach the unbanked and underbanked populations. These new entrants are reshaping access to financial services, especially in underserved markets with high mobile penetration but low traditional banking infrastructure. In response, established players are pursuing acquisition and partnership strategies to accelerate their digital transformation and retain market relevance. The emphasis is increasingly on ecosystem-building through strategic alliances and product diversification rather than isolated service offerings.
MENA Fintech Industry Leaders
Fawry
PayTabs
Checkout.com
Tabby
STC Pay
- *Disclaimer: Major Players sorted in no particular order

Market Opportunities and Future Outlook
Cross-border payments and remittance modernization is a key whitespace, supported by infrastructure build-out and regulator-backed programs in the GCC and Egypt. Initiatives and platforms referenced in the report, including multi-CBDC experimentation (with Saudi Arabia joining mBridge in 2024) and open-finance frameworks (CBUAE Open Finance Regulation C 03/2025 and SAMA moving open banking into licensing in March 2026), are pushing the market toward standardized APIs and higher-throughput settlement options. That direction supports more competitive GCC-North Africa corridors for wallets, SME payouts, and merchant settlements.
A second opportunity sits in the acceptance and real-time settlement layer, where new schemes and bank-led rails expand the basis for fintech orchestration. In July 2026, the UAE launched nationwide issuance of the Jaywan national payment card scheme, and in July 2026, Emirates NBD enabled real-time cross-border US dollar payments via the Partior blockchain network. These moves open commercial scope for processors, acquirers, and fintech platforms to offer multi-rail routing, tokenization, and compliance automation services to merchants and marketplaces, particularly as the market shifts from consumer-only applications toward embedded finance across e-commerce, healthcare retail, and SME operations.
Recent Industry Developments
- July 2026: Stc pay partnered with Payment International Enterprise (PIE) in Bahrain to enable QR payments across PIE point-of-sale devices. The tie-up expands acceptance coverage using an existing hardware footprint and supports broader merchant penetration for wallet-based payments in the Kingdom.
- June 2026: Tabby received a consumer finance license and an SME finance license from the Saudi Central Bank (SAMA). The approvals broaden Tabby’s regulated product scope beyond BNPL, enabling longer-tenor consumer plans and formal SME financing offerings under supervisory requirements.
- April 2026: PayTabs acquired UAE-based contactless payment technology provider TAPn’GO. The deal adds smartphone-based acceptance, contactless tipping, and paperless receipt capabilities to PayTabs’ merchant stack, strengthening its end-to-end acquiring and checkout experience across the region.


Research Methodology Framework and Report Scope
Market Definition and Coverage
We define the MENA fintech market as the value of technology-led financial services delivered through digital channels in the Middle East and North Africa, captured across core consumer and business use cases such as payments, transfers, lending, investing, and insurance marketplace activity.
Scope exclusions: We exclude traditional banking IT outsourcing, general e-commerce sales that are not a financial service, and crypto asset price speculation that is not tied to a fintech service revenue stream.
Segmentation Overview
- By Service Proposition
- Digital Payments
- Digital Lending & Financing
- Digital Investments
- Insurtech
- Neobanking
- By End-User
- Retail
- Businesses
- By User Interface
- Mobile Applications
- Web / Browser
- POS / IoT Devices
- By Geography
- GCC
- Saudi Arabia
- United Arab Emirates
- Qatar
- Bahrain
- Kuwait
- Oman
- North Africa
- Egypt
- Morocco
- Algeria
- Tunisia
- Levant
- Jordan
- Lebanon
- GCC
Data Sources, Market Sizing, and Validation
Desk Research
Desk work starts by setting a clean fact base on financial access, payment habits, and regulated provider activity across MENA, because those signals shape what fintech can realistically monetize. We rely on public sources such as World Bank Global Findex and IMF country data, central bank and regulator publications (including licensing and sandbox notes), and BIS materials on payments and CBDC developments.
To translate the story into numbers, we also track country level digital payments and card scheme indicators where available, telecom and internet adoption series from sources such as the ITU, and macro series like GDP and population from official statistics portals. Company annual reports, investor presentations, reputable press coverage, and a paid subscription for company financials and news help us cross-check revenue direction, business model shifts, and the timing of major launches. The desk sources listed here are illustrative only, and many other public references are also used to collect, validate, and clarify data during the study.
Primary Interviews and Surveys
We use interviews and surveys with CXOs, functional and unit leaders, and managers working on fintech products, payments, lending, investment, insurance, and digital banking in the Middle East and North Africa. Their responses help resolve country-level gaps in the desk evidence and test assumptions about adoption, pricing, transaction monetization, and revenue before the final analysis is prepared.
Distribution of primary research fieldwork respondents
| Company type | Respondent position |
|---|---|
| Top tier: 30% | CXOs: 15% |
| Mid tier: 45% | Functional/Unit leaders: 30% |
| Smaller Players: 25% | Managers: 55% |
Market-Sizing & Forecasting
Sizing starts with a top-down build where we reconstruct the addressable demand pool by country using financial inclusion and digital usage signals, and then apply fintech penetration and monetization logic by service line. The model is anchored on a few repeatable inputs, including digital transaction activity, banked and smartphone-enabled population, regulatory enablement milestones (licensing and sandbox progress), cross-border remittance relevance, and the mix shift between payments, lending, investing, and insurance marketplace models.
Those totals are then corroborated using selective bottom-up approximations, such as sampled provider revenue ranges from public financials, channel checks on pricing and fee structures, and volume times average take rate checks where interview feedback supports it. Where company disclosure is limited, gaps are handled through country peer benchmarking and product maturity mapping, and then adjusted after interviews confirm what is realistic in each market cluster.
For forecasting, we use scenario analysis supported by simple trend fits on the core drivers, and the scenarios are tied to observable levers such as adoption curves, pricing normalization, and regulatory rollout timelines. Assumptions are kept transparent so the model can be rerun quickly when new licensing decisions, payment rails upgrades, or macro shocks change near-term momentum.
Data Validation & Update Cycle
Outputs are checked against independent signals, including country level fintech formation activity, regulatory announcements, and whether modeled growth lines up with observed shifts in digital payments and credit access. If an outlier appears, we re-check the driver inputs, revisit the peer benchmarks, and then re-contact selected experts when a variance cannot be explained by published data.
Before sign-off, the model and assumptions go through multi-step analyst reviews, with sanity checks on currency treatment, growth rates, and service mix evolution. The report is refreshed annually, and interim updates are triggered when material events occur, such as major regulatory changes, new nationwide payment infrastructure, or a step-change in cross-border corridor behavior. A final pre-delivery review pass is completed so clients receive the most current view available at the time of release.
Mordor Intelligence's Mena Fintech Market Sizing Compared With Other Published Estimates
Published market sizes for MENA fintech often spread out because firms choose different ways to define fintech value and they also do not always align on geography, year, and what is being monetized. We reflect this by stating the year clearly and keeping the counting logic tied to services that generate fintech economics, rather than broad digital finance activity.
The biggest gap driver is whether payment value is counted as full transaction value or only the revenue-linked portion, and in Mordor Intelligence sizing we treat large payment flows as a demand indicator, but count market value as fintech service value tied to fee and commission economics. A second driver is geography, since some sources expand to MENAP or exclude parts of North Africa, which changes the base even before growth assumptions are applied.
Benchmark comparison
| Source | Market Size | Gaps in Research Methodology |
|---|---|---|
| Mordor Intelligence | USD 5.65 B (2025) | |
| Global Consultancy A | USD 4.50 B (2025) | Uses a narrower MENAP-style revenue lens that emphasizes a subset of fintech revenue pools and applies conservative monetization assumptions for early-stage products. |
| Regional Consultancy B | USD 5.27 B (2022) | Anchors sizing to an older base year and blends funding-led ecosystem metrics with market value, which can understate later-year revenue scaling and mix shifts. |
The table shows that most differences trace back to what is counted as value (revenue-like fintech economics versus flow-like transaction totals), and whether the geography and year are aligned. When scope and counting rules are kept consistent, the remaining spread is usually explained by take rate progression, adoption timing, and how quickly new service lines like digital lending and online insurance scale.


Key Questions Answered in the Report
What is the current value of the MENA fintech market?
The market stands at USD 6.35 billion in 2026 and is projected to reach USD 11.46 billion by 2031.
Which service segment leads spending?
Digital payments contribute 54.12% of 2025 revenue, reflecting widespread wallet and merchant acceptance.
Where is growth fastest geographically?
North Africa posts the highest projected CAGR of 17.29% through 2031 due to large unbanked populations.
What factors accelerate adoption?
Government cash-lite mandates, surging smartphone penetration, and record VC funding rounds are the core drivers.
Which restraint has the biggest drag on growth?
Regulatory fragmentation across 19 jurisdictions lifts compliance costs and slows cross-border scaling.
Page last updated on:


 Your data is secure and never sold or shared.


