Market Overview
| Study Period | 2019 - 2030 |
|---|---|
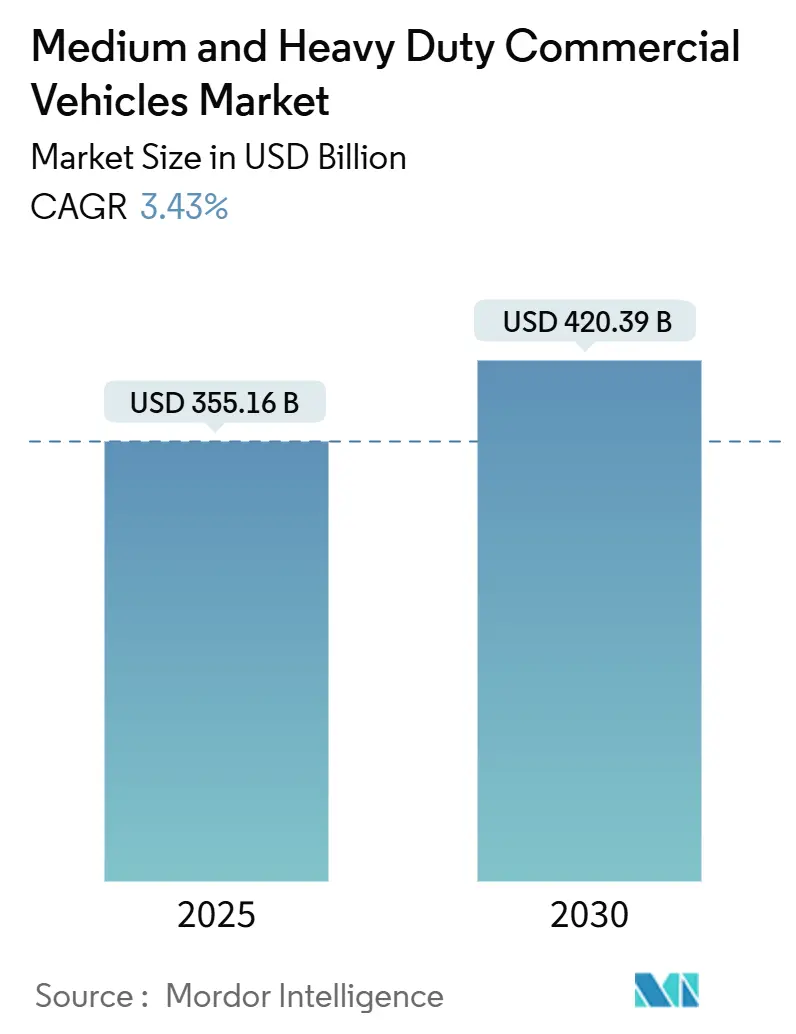
| Market Size (2025) | USD 355.16 Billion |
| Market Size (2030) | USD 420.39 Billion |
| Growth Rate (2025 - 2030) | 3.43% CAGR |
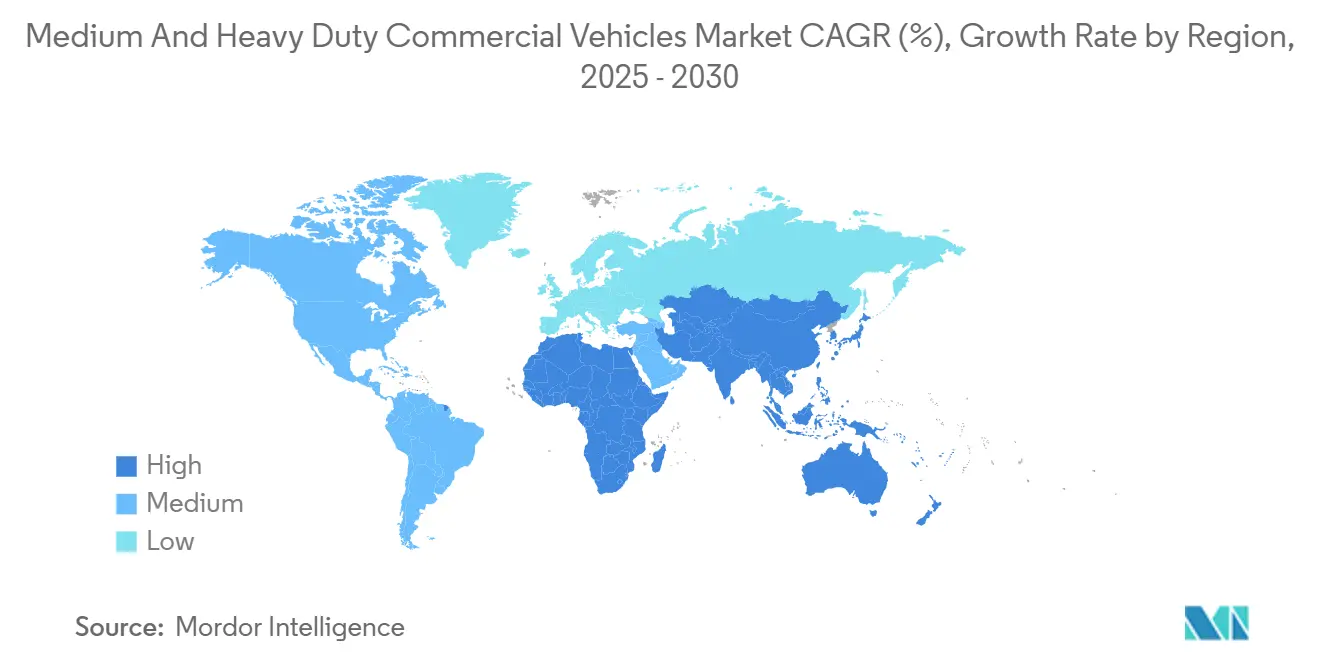
| Fastest Growing Market | Middle East and Africa |
| Largest Market | Asia Pacific |
| Market Concentration | Medium |
Major Players *Disclaimer: Major Players sorted in no particular order Image © Mordor Intelligence. Reuse requires attribution under CC BY 4.0. | |
Medium And Heavy Duty Commercial Vehicles Market Analysis by Mordor Intelligence
The Medium And Heavy Duty Commercial Vehicles Market size is estimated at USD 355.16 billion in 2025, and is expected to reach USD 420.39 billion by 2030, at a CAGR of 3.43% during the forecast period (2025-2030). Fleet owners are absorbing higher upfront prices for battery-electric and fuel-cell trucks to secure lower lifetime operating costs, spurred by Euro-VII and U.S. EPA Phase 3 rules that render legacy diesel platforms uneconomical by the decade’s end. Chinese battery costs, U.S. infrastructure incentives, and Gulf infrastructure programs are reshaping procurement strategies as operators balance emission compliance with payload needs. Manufacturers have accelerated in-house battery production and software-defined vehicle programs to retain margin control while offering telematics-linked service contracts that reduce downtime and insurance premiums. Competitive dynamics now hinge on the speed of powertrain electrification, vertical integration, and access to megawatt-level charging infrastructure across long-haul corridors.
Key Report Takeaways
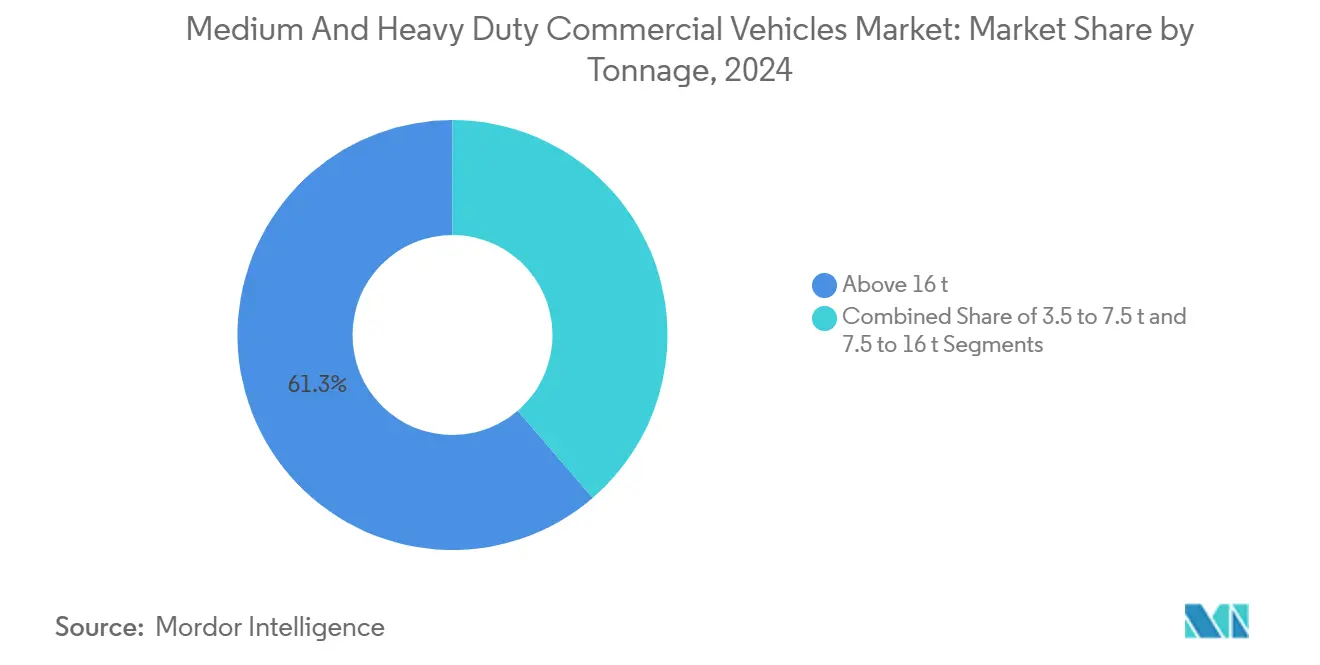
- By tonnage, vehicles above 16 tonnes led with 61.27% of the medium and heavy-duty commercial vehicles market share in 2025, while the 3.5 to 7.5 tonne class is forecast to expand at a 3.45% CAGR through 2030.
- By propulsion, internal-combustion engines accounted for 87.71% of volume in 2025; battery-electric trucks recorded the fastest 3.55% CAGR to 2030.
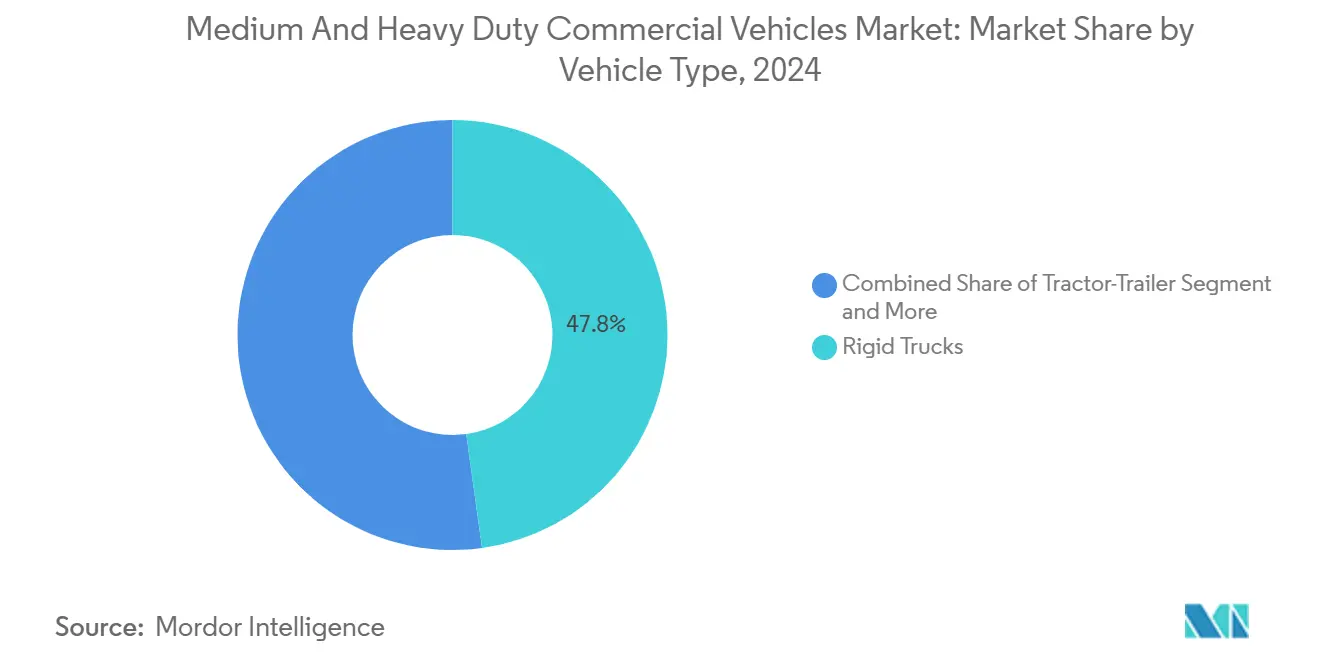
- By vehicle type, rigid trucks held a 47.75% share of the medium and heavy-duty commercial vehicles market size in 2025, and tractor-trailers are advancing at a 3.58% CAGR through 2030.
- By end-user, logistics and transportation commanded 45.17% of revenue in 2025; the segment continues at a 3.48% CAGR on the back of e-commerce demand.
- By geography, Asia-Pacific generated 43.16% of global revenue in 2025, while the Middle East and Africa are the fastest-growing regions at 3.51% CAGR to 2030.
Note: Market size and forecast figures in this report are generated using Mordor Intelligence’s proprietary estimation framework, updated with the latest available data and insights as of January 2026.
Global Medium And Heavy Duty Commercial Vehicles Market Trends and Insights
Drivers Impact Analysis
| Driver | (~) % Impact on CAGR Forecast | Geographic Relevance | Impact Timeline |
|---|---|---|---|
| Fleet Renewal Driven by Euro-VII & EPA 2027 Emission Rules | +0.6% | North America and Europe, with spillover to export markets | Medium term (2-4 years) |
| Infrastructure Stimulus | +0.5% | Asia-Pacific (India, Southeast Asia), Middle East, Latin America | Long term (≥ 4 years) |
| E-Commerce Logistics Expansion | +0.4% | Global, concentrated in urban corridors of North America, Europe, China | Short term (≤ 2 years) |
| Mining Sector's Push for Battery-Electric Haul Trucks | +0.3% | Middle East and Africa, Latin America (Chile, Peru), Australia | Medium term (2-4 years) |
| Telematics-Enabled Usage-Based Insurance Lowers TCO | +0.3% | North America and Europe, early adoption in Asia-Pacific | Short term (≤ 2 years) |
| Secondary-Use Battery Leasing Models | +0.2% | Europe, pilot programs in North America and China | Long term (≥ 4 years) |
| Source: Mordor Intelligence | |||
Fleet Renewal Driven by Euro-VII & EPA 2027 Emission Rules
In the near future, stricter Euro-VII limits will significantly reduce nitrogen-oxide thresholds. These limits will also introduce real-world urban stop-and-go testing and, for the first time, impose caps on brake and tire particle emissions. Meanwhile, the U.S. EPA's Phase 3 greenhouse-gas rule aims for a substantial reduction in intensity over the next decade. However, achieving this target is impossible through mere incremental improvements in diesel. In California, along with several other states, there is a mandate for a significant portion of Class 7-8 sales to be zero-emission within the next decade. This move jeopardizes the resale value of new diesel tractors [1]“Cars and Vans Outlook,” European Commission, climate.ec.europa.eu. In response, manufacturers are channeling R&D into battery-electric and fuel-cell platforms. They're also bolstering regenerative braking and battery-health diagnostics to adhere to durability standards. Fleets that purchase compliant trucks ahead of the deadline stand to gain from enhanced resale values and better financing terms linked to ESG metrics [2]“Greenhouse Gas Emissions Standards for Heavy-Duty Vehicles – Phase 3,” US EPA, www.epa.gov.
Infrastructure Stimulus in Emerging Economies
India's National Infrastructure Pipeline is set to invest a substantial amount by mid-decade, primarily focusing on upgrading roads and ports. This initiative has significantly boosted the demand for rigid trucks across various freight corridors. Meanwhile, both Indonesia and Vietnam have allocated significant resources for highway projects. These investments are driving a surge in the purchases of concrete mixers and dump trucks, fueling a construction boom in both nations. In the Middle East, Saudi Arabia is channeling considerable funding into its Vision 2030, specifically targeting the development of NEOM logistics corridors. Simultaneously, the United Arab Emirates is ambitiously scaling Khalifa Port's capacity to handle a much larger volume of containers in the coming years, ensuring a steady intake of tractor-trailers.
E-Commerce Logistics Expansion
In 2025, parcel volumes in the Asia-Pacific region experienced significant growth year on year, prompting a shift in fleet-renewal cycles from the traditional longer timelines to a more accelerated schedule. Amazon's substantial order of electric delivery vehicles, coupled with UPS's deployment of a large fleet of electric vans, underscores a pronounced shift towards medium-weight platforms, adept at maneuvering through low-emission zones. Currently, numerous cities across Europe impose restrictions on diesel trucks, mandating compliance with stringent emission standards. Moreover, many of these cities are planning a complete ban on internal combustion engines (ICE) in the near future, positioning battery-electric delivery vans as the primary choice for urban logistics. The demands of same-day delivery are pushing fleets to either select vehicles that can complete multiple urban cycles on a single charge or to implement opportunity charging at micro-hubs. Additionally, telematics-driven route optimization is curbing empty kilometers, bolstering the case for electrification by enhancing daily utilization rates.
Mining Sector Push for Battery-Electric Haul Trucks
By the mid-term, Anglo American aims to significantly reduce diesel use at its Mogalakwena site through a hydrogen retrofit on its Komatsu 930E, marking a substantial step in heavy-haul decarbonization. In trials conducted in Chile and Australia, Caterpillar's 793 XE demonstrated notable cost efficiency, aided by regenerative braking during downhill hauls. BHP's fleet policy, which prohibits the introduction of new diesel trucks in the long term, underscores a steadfast commitment to zero-emission equipment in its copper and iron-ore operations. While the initial capital investment is considerably higher, the tightening margins from escalating carbon prices and ESG-linked lending bolster the argument for early adoption. Additionally, emerging battery swap systems promise a rapid turnaround time, ensuring minimal disruption during high-duty production cycles.
Restraints Impact Analysis
| Restraint | (~) % Impact on CAGR Forecast | Geographic Relevance | Impact Timeline |
|---|---|---|---|
| High Upfront Cost of Zero-Emission Trucks | -0.4% | Global, acute in emerging markets with limited subsidies | Short term (≤ 2 years) |
| Supply-Chain Bottlenecks | -0.4% | Global, concentrated in North America and Europe | Medium term (2-4 years) |
| Depot-Level Grid-Capacity Limitations | -0.3% | Urban centers in North America, Europe, Asia-Pacific | Medium term (2-4 years) |
| Skilled-Technician Shortage | -0.2% | North America, Europe, emerging in Asia-Pacific | Long term (≥ 4 years) |
| Source: Mordor Intelligence | |||
High Upfront Cost of Zero-Emission Trucks
In 2025, battery-electric Class 8 tractors remain significantly more expensive than their diesel counterparts. Additionally, fuel-cell variants come with an even higher cost. While incentives like the U.S. Inflation Reduction Act's credit and Germany's KsNI subsidy help reduce the price disparity, they do not fully bridge the gap. For smaller fleets without access to affordable capital, the extended payback periods pose a challenge, particularly in long-haul segments. Although leasing models and battery-as-a-service options provide some relief, their feasibility depends on residual-value forecasts, which are still unproven in secondary markets. Operators face a difficult decision, balancing the higher upfront investment against the increasing restrictions in emission zones, which threaten the resale value of diesel assets.
Supply-Chain Bottlenecks for Power Electronics & Batteries
In 2025, wafer fabs grappled with automotive demand, leading to significantly long lead times for silicon-carbide inverter modules. With a few cell makers dominating a majority of the global output, a concentrated risk emerged as OEMs simultaneously ramped up truck programs. Amidst Indonesian export curbs, nickel prices experienced substantial fluctuations, injecting volatility into battery cost projections. Daimler's large-scale cell plant in Europe won't commence operations for several years, creating near-term supply gaps. In response, OEMs are hedging by dual-sourcing and redesigning packs for LFP chemistry, capitalizing on its energy density advantages.
Segment Analysis
By Tonnage: Urbanization Favors Lighter Classes
Vehicles above 16 tonnes captured 61.27% of the medium and heavy-duty commercial vehicles market share in 2025, reflecting their dominance in intercity freight and mining haulage. The 3.5–7.5 tonne band is growing at a 3.45% CAGR to 2030, fueled by e-commerce operators that prioritize maneuverability in dense city cores and can profit from single-charge delivery cycles.
Rigid emission standards apply uniformly across weights above 3.5 tonnes, nullifying any compliance advantage of mid-duty categories and nudging fleets toward battery-electric or fuel-cell upgrades in every bracket. Hyundai’s XCIENT fuel-cell tractor exceeded 10 million km in Swiss and California service by 2025, proving viability for long-haul payloads where battery weight remains a hurdle. The medium and heavy-duty commercial vehicles market now sees OEMs co-designing charging hubs and route planning software specific to tonnage class, aligning investment decisions with urban zoning policies.
Note: Segment shares of all individual segments available upon report purchase
Get Detailed Market Forecasts at the Most Granular Levels
Download PDF
By Propulsion Type: Diesel Dominance Erodes as BEV Scales
Internal-combustion engines commanded 87.71% of 2025 volume, yet battery-electric trucks expand at a 3.55% CAGR to 2030, the fastest rate in the segment. Combined output of Daimler eCascadia, Volvo VNR Electric, and BYD 8TT exceeds half a lakh annually by 2026, marking the largest coordinated capacity build-out in the medium and heavy-duty commercial vehicles market context.
Plug-in hybrids occupy a transition niche but remain under 3% share due to complexity and marginal fuel savings over optimized diesel models. Fuel-cell trucks secure footholds in regions with hydrogen corridors, but large-scale uptake hinges on sub-USD 4/kg green hydrogen pricing. Alternative fuels such as LNG and CNG act as interim solutions across agriculture and forestry where charging infrastructure is sparse. China’s dual-credit system accelerates BEV penetration, with domestic OEMs launching 15 new models across 2024-2025.
By Vehicle Type: Tractor-Trailers Gain as Range Anxiety Eases
Rigid trucks maintained 47.75% of 2025 shipments, yet tractor-trailers achieved a leading 3.58% CAGR through 2030 because emerging fuel-cell and plug-in hybrid systems now deliver 500–700 km range without megawatt charging stops. Nikola Tre and Hyundai XCIENT deployments validate hydrogen’s role for intercity freight and position tractor-trailers to overtake rigid truck growth within the medium and heavy-duty commercial vehicles market.
Tipper and dump-truck electrification advances quickest in underground mining, where zero tailpipe emissions cut ventilation costs that can exceed USD 50 per hour. Specialized vocational trucks lag due to body-integration complexity, though ISO 15118 vehicle-to-grid standards create revenue opportunities through ancillary grid services. OEMs collaborate with body builders to pre-engineer electric power-take-off solutions, trimming integration lead times.
Note: Segment shares of all individual segments available upon report purchase
Get Detailed Market Forecasts at the Most Granular Levels
Download PDF
By End-User Industry: Logistics Leads, Mining Electrifies
Logistics and transportation accounted for 45.17% of 2025 demand and sustained a 3.48% CAGR, driven by parcel growth and low-emission-zone mandates. UPS, DHL, and Amazon collectively committed to more than lakh zero-emission vans and trucks by 2030, locking in a baseline volume for light and medium classes within the medium- and heavy-duty commercial vehicles market.
Mining operators pilot battery-electric haul trucks at copper and iron-ore sites in Chile, Australia, and South Africa, while agriculture and forestry fleets rely on CNG and biodiesel until grid access improves. Public utilities are adopting battery-electric refuse trucks under the European Clean Vehicles Directive, which stipulates a minimum zero-emission procurement target by 2030. These collective moves shift supplier roadmaps toward modular powertrains adaptable to diverse duty cycles.
Geography Analysis
Asia-Pacific delivered 43.16% of global revenue in 2025, driven by China's policies encouraging new-energy-vehicle production and India's large-scale infrastructure initiatives. Chinese commercial NEV sales saw significant growth as major manufacturers introduced multiple electric truck models to comply with regulatory requirements. While India's logistics-driven economic growth sustained truck demand, the adoption of electric vehicles remained minimal due to inadequate charging infrastructure and financing challenges for smaller operators. Meanwhile, Japan and South Korea's substantial subsidies for fuel-cell trucks supported the rollout of advanced models, boosting the region's electrification efforts.supported by diversification projects in the Gulf region and electrification initiatives in mining. Saudi Arabia's large-scale investments and the UAE's port expansions are driving demand for heavy-duty vehicles. In South Africa, mining operations are retrofitting haul trucks with hydrogen powertrains to reduce operational costs. Turkey is emerging as a strategic export hub for medium-duty trucks to Europe, leveraging its cost advantages and logistical strengths. In Latin America, the truck fleet is expanding due to agricultural exports, although economic challenges, such as currency fluctuations, are hindering investments in electrification.
North America and Europe collectively accounted for a significant share of the 2025 revenue, with their growth shaped by regulatory frameworks mandating early electrification. In the United States, policies targeting a substantial portion of truck sales drove the transition, while in Europe, stricter emissions standards limited the viability of diesel platforms. Key European markets registered notable adoption of battery-electric trucks, particularly in medium-duty models serving municipal and parcel delivery routes.
The Middle East and Africa lead growth at 3.51% CAGR through 2030, buoyed by Gulf diversification projects and mining electrification pilots. Saudi Arabia’s USD 500 billion NEOM investment and UAE port expansion underpin tractor-trailer demand, while South African mines retrofit haul trucks with hydrogen powertrains to cut diesel expense. Turkey emerges as an export base for medium-duty trucks into Europe, exploiting lower labor costs and favorable logistics. Latin America’s truck fleet expands with agricultural exports from Brazil and Argentina, though currency volatility tempers electrification investment.
Get Analysis on Important Geographic Markets
Download PDF
Competitive Landscape
In the mid-2020s, the medium and heavy-duty commercial vehicles market saw a moderate concentration, with the leading manufacturers holding a significant share of the global volume. Chinese firms, capitalizing on integrated battery supply chains, are strategically undercutting established players in regions sensitive to pricing. In a move to navigate EU tariffs, BYD inaugurated a plant in Hungary during this period, while Sinotruk is making waves in Africa and Latin America by offering diesel-electric hybrids at a notable discount compared to Western competitors.
In response to these challenges, traditional industry leaders are turning to vertical integration. Daimler has pledged a substantial investment in European battery production, while PACCAR is collaborating with Cummins to co-develop fuel-cell stacks, ensuring they aren't overly reliant on suppliers. Moreover, with the advent of telematics and software-defined architectures, companies are now generating recurring revenues through predictive maintenance and usage-based insurance, helping to counterbalance the declining margins on hardware.
Emerging opportunities lie in areas like battery-as-a-service and megawatt charging stations, where early entrants can secure exclusive contracts with fleets. Disruptors like Nikola are eyeing the long-haul hydrogen market, and Rivian is carving a niche with last-mile battery-electric vans. Both are on a quest for scale but are grappling with profitability hurdles. Meanwhile, patent activity in solid-state batteries and wireless charging indicates that the next competitive frontier will be rapid recharge technology capable of supporting substantial driving ranges—a potential game-changer for existing powertrain strategies.
Medium And Heavy Duty Commercial Vehicles Industry Leaders
PACCAR Inc
Daimler AG
Volvo Group
Tata Motors Limited
Traton SE
- *Disclaimer: Major Players sorted in no particular order

Need More Details on Market Players and Competitors?
Download PDF
Recent Industry Developments
- March 2025: Tata Motors has commenced trials of hydrogen-powered trucks, showcasing its commitment to sustainable and innovative solutions for long-haul transportation. This initiative highlights the company's focus on reducing carbon emissions and exploring alternative energy sources to address the growing demand for environmentally friendly transportation options.
- February 2025: Euler Motors and Tata Power Renewables partnered to provide fast-charging infrastructure for commercial vehicles in India.
Research Methodology Framework and Report Scope
Market Definitions and Key Coverage
Our study defines the medium and heavy-duty commercial vehicles (M&HCV) market as all newly built trucks, tractor-trailers, tippers, dumpers, rigid carriers, and road-worthy buses with gross vehicle weight above 3.5 tons, measured in value (USD) and units across tonnage, propulsion, body type, end use, and geography. According to Mordor Intelligence, Asia-Pacific currently leads revenue share, while Africa is the fastest-growing region.
Scope Exclusion: Light commercial vans under 3.5 tons and off-highway equipment such as agricultural tractors and mining haul trucks lie outside our coverage.
Segmentation Overview
- By Tonnage
- 3.5 to 7.5 t
- 7.5 to 16 t
- Above 16 t
- By Propulsion Type
- Internal-Combustion Engine (Diesel & Gasoline)
- Battery Electric
- Plug-in Hybrid Electric
- Fuel-cell Electric
- Alternative Fuels (CNG, LNG, Bio-fuel, LPG)
- By Vehicle Type
- Rigid Truck
- Tractor-Trailer
- Tipper / Dump Truck
- Specialized & Vocational Trucks
- By End-user Industry
- Logistics & Transportation
- Construction & Mining
- Agriculture & Forestry
- Utilities & Municipal Services
- By Geography
- North America
- United States
- Canada
- Rest of North America
- South America
- Brazil
- Argentina
- Rest of South America
- Europe
- Germany
- United Kingdom
- France
- Italy
- Spain
- Rest of Europe
- Asia Pacific
- China
- India
- Japan
- South Korea
- Rest of Asia Pacific
- Middle East and Africa
- United Arab Emirates
- Saudi Arabia
- South Africa
- Turkey
- Rest of Middle East and Africa
- North America
Detailed Research Methodology and Data Validation
Primary Research
Mordor analysts spoke with fleet managers, leasing executives, dealer principals, and tier-one drivetrain suppliers across Asia, the Americas, Europe, and the Middle East and Africa. Interviews fine-tuned average selling prices, replacement cycles, regulatory readiness, and battery-electric uptake, allowing us to adjust preliminary desk findings with ground-level insights.
Desk Research
We mapped production, registration, and trade flows using open sources such as OICA country dashboards, UN Comtrade HS 87 codes, Eurostat road freight statistics, ACEA new-registration files, and International Energy Agency fuel price trackers. Annual reports, 10-Ks, and investor decks of twenty leading OEMs confirmed pricing and model-mix shifts, which were enriched with transport ministry data sets, tender disclosures, and Questel patent views on zero-emission drivetrains. Subscription repositories including Marklines, D&B Hoovers, and Dow Jones Factiva supplied consolidated financials, news, and plant-capacity changes. This list is illustrative, and many other public and paid channels supported data discovery, validation, and clarification.
Market-Sizing & Forecasting
We begin with national production and registration totals, multiply them by segment-specific average selling prices, and create a base-year value. We then cross-check the outcome through sampled dealer ASP × volume roll ups. Key variables like GDP growth, ton-kilometer freight demand, public infrastructure outlay, diesel and electricity retail prices, battery pack cost curves, and emission-standard timelines feed a multivariate regression model with an ARIMA overlay that captures cyclical freight swings. Gaps where data are partial are bridged through three-year moving averages adjusted by import-export balances.
Data Validation & Update Cycle
Outputs pass a two-level analyst review; deviations exceeding three percentage points versus historical series trigger root-cause checks. Models refresh annually, with mid-cycle revisions when material policy or macro shocks occur. Before release, an analyst reruns the workbook so clients receive the latest calibrated view.
Why Mordor's Medium and Heavy-Duty Commercial Vehicles Size & Share Analysis Baseline Commands Reliability
Published estimates vary because firms select different segment boundaries, price benchmarks, and update cadences, and we acknowledge these disparities.
Key gap drivers include whether buses are counted, when light trucks slip into totals, how list-to-net price discounts are handled, and the frequency of dataset refresh. This is where Mordor Intelligence differentiates, applying a consistent scope and annual refresh that mirror on-ground reality.
Benchmark comparison
| Market Size | Anonymized source | Primary gap driver |
|---|---|---|
| USD 357.81 B | Mordor Intelligence | None |
| USD 451.56 B | Global Consultancy A | Includes light vans and uses list prices without discount normalization |
| USD 363.36 B | Industry Journal B | Excludes buses and relies on historical growth extrapolation without primary validation |
The comparison shows our figure sits between broad, all-inclusive totals and narrower truck-only counts, and the balanced midpoint reflects clearly defined scope, regularly refreshed inputs, and multi-source validation that decision-makers can trust.
Need A Different Region or Segment?
Customize Now
Key Questions Answered in the Report
What is the projected value of the medium and heavy-duty commercial vehicles market in 2030?
The sector is forecast to reach USD 420.39 billion by 2030.
Which vehicle class is growing fastest within the global truck landscape?
The 3.5–7.5 tonne bracket leads growth at a 3.45% CAGR to 2030, driven by urban e-commerce demand.
How large is Asia-Pacific’s contribution to global medium and heavy-duty truck revenue?
Asia-Pacific generated 43.16% of worldwide revenue in 2025, the largest regional share.
Which propulsion technology records the highest growth rate?
Battery-electric trucks post the fastest 3.55% CAGR, supported by regulatory mandates and falling battery costs.
What regulatory milestones accelerate fleet renewal in North America and Europe?
Euro-VII standards, effective in 2027, and the U.S. EPA Phase 3 rules for model year 2027 onward compel OEMs to electrify drivetrains.
How are fleet operators mitigating the high upfront costs of zero-emission trucks?
Leasing models such as battery-as-a-service lower initial outlay by 30% and shift residual-value risk to lessors.


