
Medical Thermometer Market Size and Share
Market Overview
| Study Period | 2020 - 2031 |
|---|---|
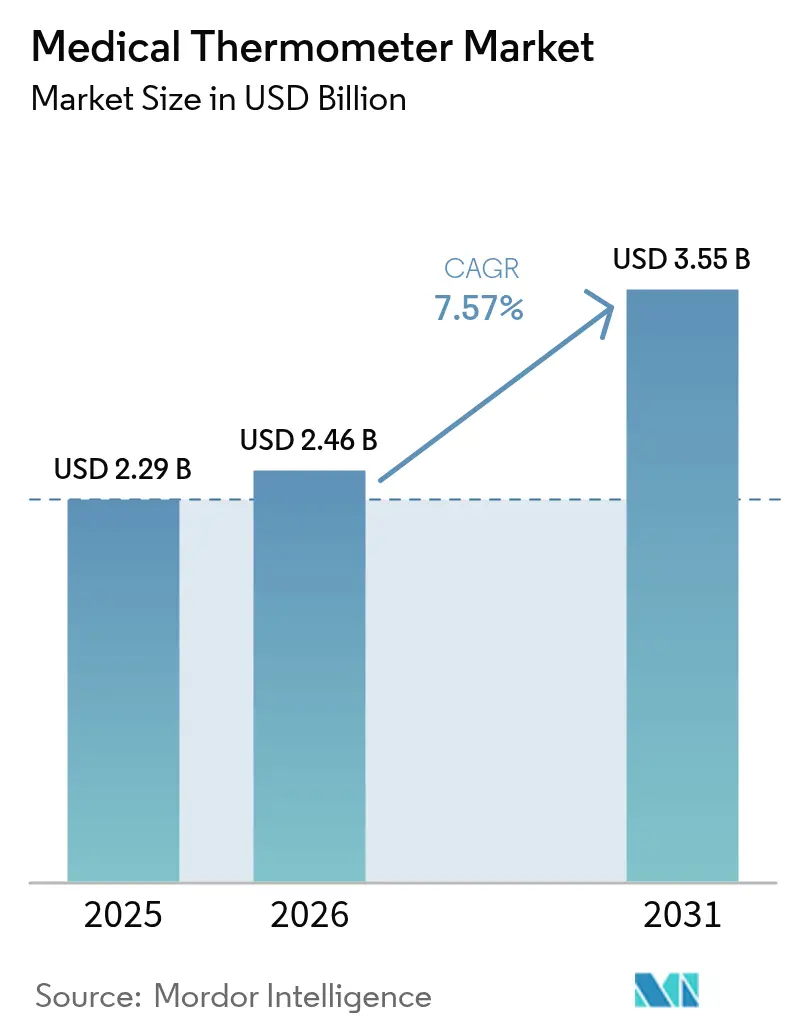
| Market Size (2026) | USD 2.46 Billion |
| Market Size (2031) | USD 3.55 Billion |
| Growth Rate (2026 - 2031) | 7.57 % |
| Fastest Growing Market | Asia Pacific |
| Largest Market | North America |
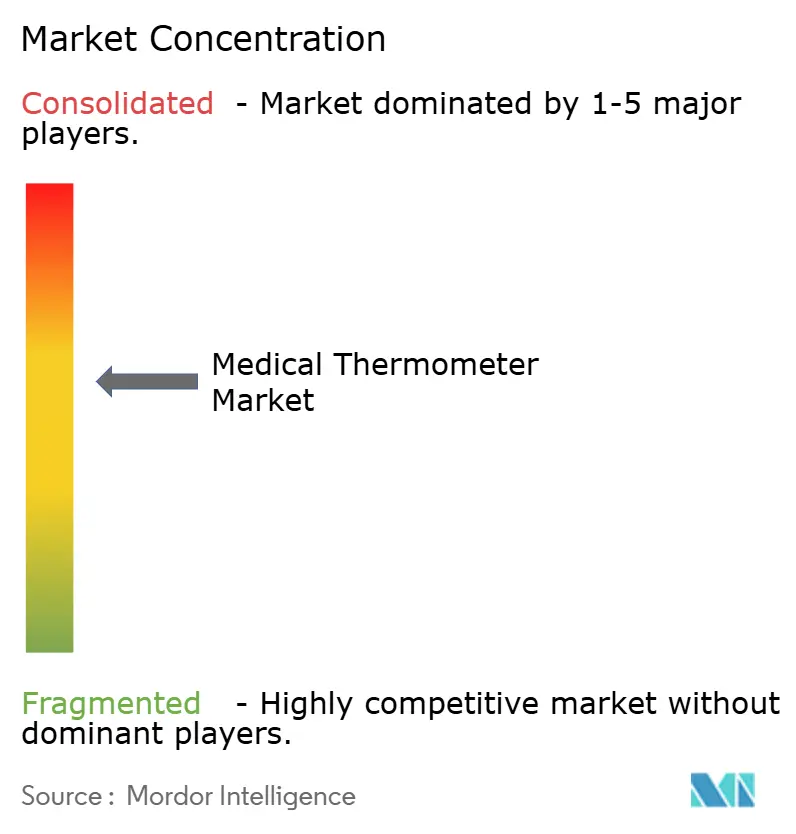
| Market Concentration | Medium |
Major Players *Disclaimer: Major Players sorted in no particular order Image © Mordor Intelligence. Reuse requires attribution under CC BY 4.0. | |
Medical Thermometer Market Analysis by Mordor Intelligence
The medical thermometer market size is expected to grow from USD 2.29 billion in 2025 to USD 2.46 billion in 2026 and is forecast to reach USD 3.55 billion by 2031 at 7.57% CAGR over 2026-2031. Sustained demand comes from healthcare digitization, regulatory moves that remove mercury devices, and growing use of AI-enabled temperature monitoring. The FDA’s June 2025 decision to exempt Class II clinical electronic thermometers from 510(k) review lowers compliance costs and encourages rapid innovation[1], while the European Union’s mercury ban continues to accelerate product substitution. Hospitals and home-care providers expand connected-care programs that bundle temperature sensors with other vital-sign modules, and semiconductor supply challenges are pushing manufacturers toward vertical integration strategies to safeguard production.
Key Report Takeaways
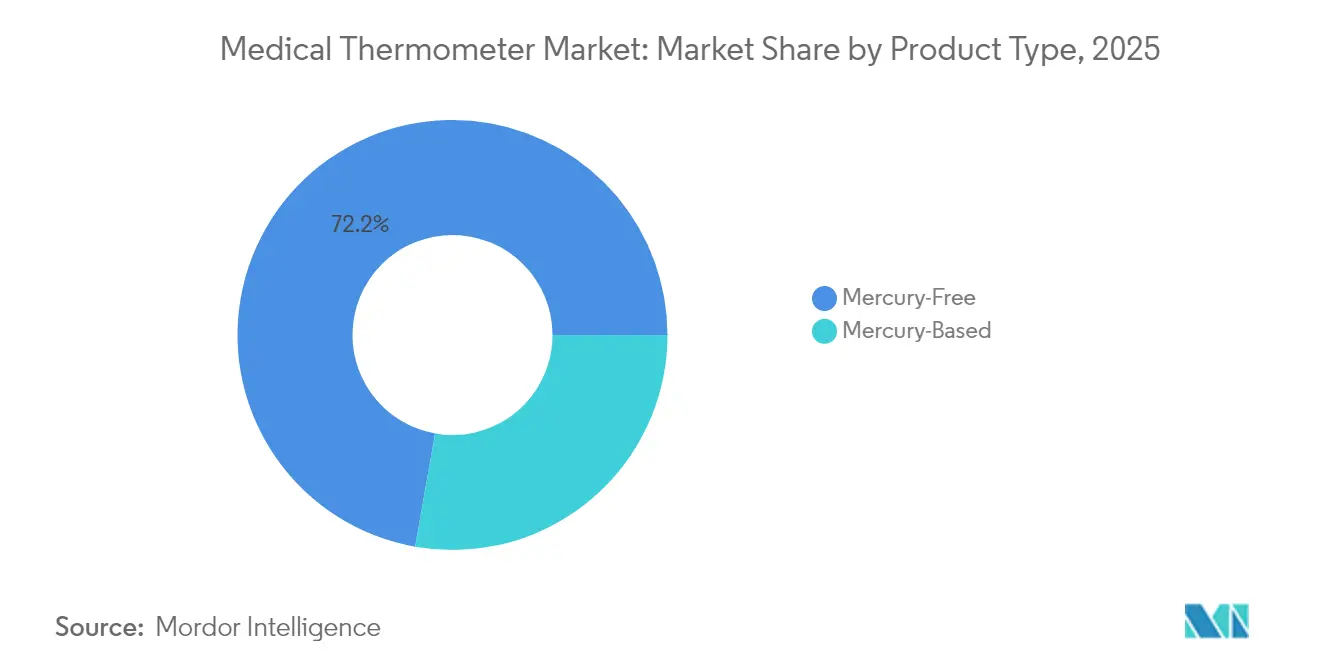
- By product type, mercury-free devices led with 72.22% of medical thermometer market share in 2025 and are advancing at an 8.29% CAGR to 2031.
- By measurement point, oral/axillary captured 62.90% revenue in 2025, whereas forehead thermometers record the highest 8.06% CAGR through 2031.
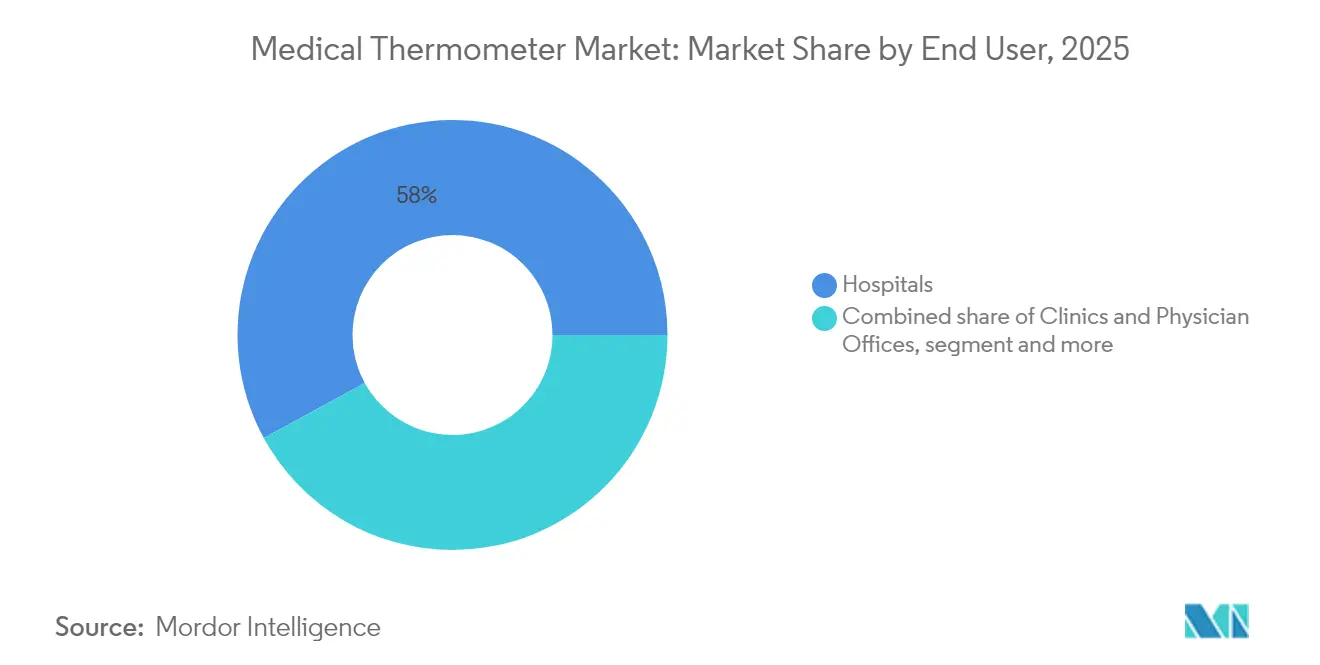
- By end user, hospitals held 57.95% of the medical thermometer market size in 2025; home-care settings post the fastest 8.74% CAGR to 2031.
- By patient age group, adult users commanded 68.10% share in 2025, but pediatric demand is rising at an 7.98% CAGR through 2031.
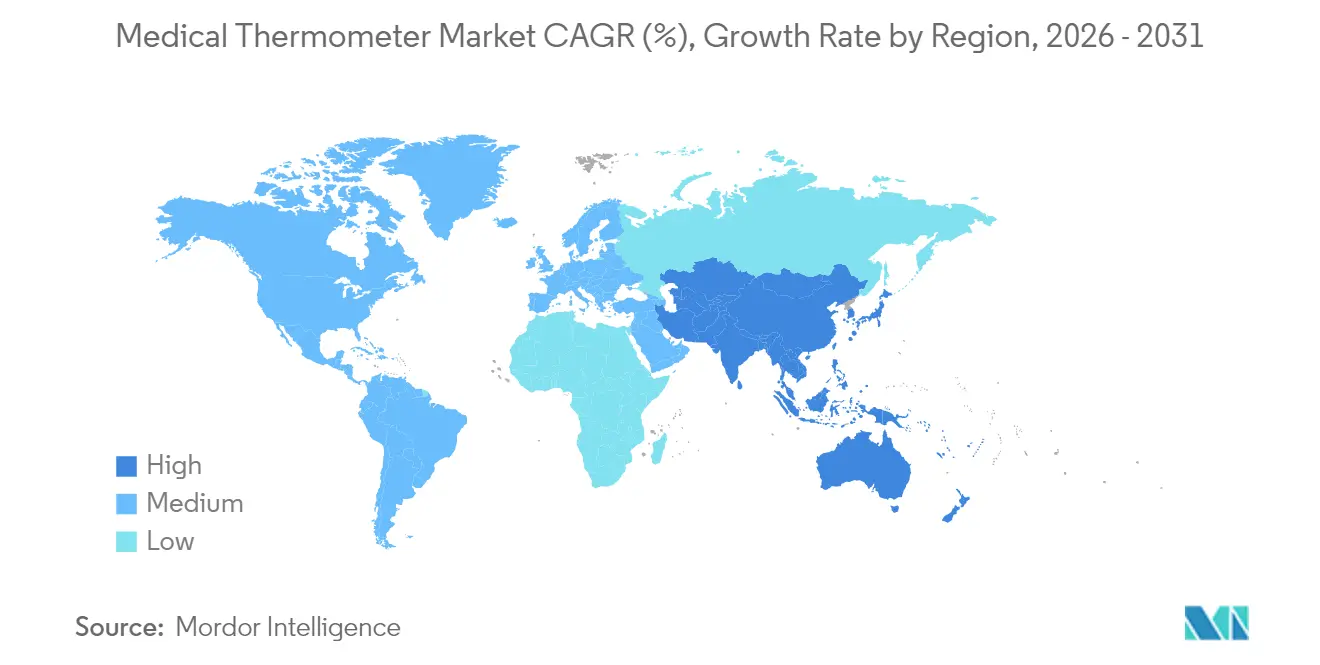
- By region, North America contributed 36.60% of 2025 revenue, while Asia-Pacific is expanding at 9.11% CAGR to 2031.
Note: Market size and forecast figures in this report are generated using Mordor Intelligence’s proprietary estimation framework, updated with the latest available data and insights as of 2026.
Market Trends and Insights
Drivers Impact Analysis of Medical Thermometer Market*
| Driver | (~) % Impact on CAGR Forecast | Geographic Relevance | Impact Timeline |
|---|---|---|---|
| Explosion of home-use digital & smart thermometry post-COVID | +1.8% | Global, highest in North America & Europe | Medium term (2-4 years) |
| Hospital infection-control protocols favouring contact-less devices | +1.2% | Global, led by developed markets | Short term (≤ 2 years) |
| Growing pediatric & geriatric populations needing frequent monitoring | +0.9% | APAC core, spill-over to MEA & LatAm | Long term (≥ 4 years) |
| Integrated vital-sign platforms bundling temperature sensors | +0.7% | North America & EU, expanding to APAC | Medium term (2-4 years) |
| AI-powered fever-prediction algorithms in wearables | +0.6% | Early adoption in North America & EU | Long term (≥ 4 years) |
| Climate-change-induced disease surveillance programs | +0.4% | Tropical & subtropical regions | Long term (≥ 4 years) |
| Source: Mordor Intelligence | |||
Explosion of home-use digital & smart thermometry post-COVID
Remote-care reimbursement now spans Medicare, and 81% of clinicians integrate temperature tracking into RPM protocols, lifting consumer demand for connected devices that feed data directly into telehealth dashboards. Smart-thermometer fleets exceeding 3 million units provide anonymized datasets used to forecast regional fever spikes, illustrating how the medical thermometer market increasingly overlaps with public-health analytics. Household adoption remains highest in North America, yet Asia-Pacific growth accelerates as mobile-health ecosystems mature and price points fall to mass-market levels. Data-driven platforms encourage repeat sales because firmware and algorithm upgrades extend device lifecycles. Device makers now bundle temperature probes with pulse-ox and blood-pressure modules, creating multi-parameter kits that anchor patient engagement.
Hospital infection-control protocols favoring contact-less devices
Clinical workflows prioritize non-contact thermometry to cut disinfection-time and cross-infection risks. National guidelines in Canada and Australia highlight infrared or single-use solutions in triage and aged-care settings.[2] Procurement teams embed non-contact requirements in tenders, pushing vendors to refine sensor accuracy through emissivity-compensation algorithms. Although peer-reviewed studies still flag sub-0.8 correlation with core temperature, suppliers counter by integrating dual-sensor arrays and calibration certificates for each batch. Growth is further supported by thermal-screening gates deployed in airports and large venues that were repurposed for routine hospital entry points.
Growing pediatric & geriatric populations needing frequent monitoring
Asia-Pacific adds over 30 million people aged 65+ each year, while birth cohorts remain substantial, creating parallel demand for painless and precise thermometry. Wrist-based sensors validated in Swiss clinical trials demonstrate continuous monitoring without disturbing infants or elderly patients. In pediatric wards, non-contact infrared units reduce anxiety and enable rapid throughput during infection outbreaks. Continuous-data streams integrate into early-warning-score algorithms that spot subtle deviations before fever manifests, improving outcomes for vulnerable groups.
Integrated vital-sign platforms bundling temperature sensors
Hospitals shift budgets from standalone thermometers to platform plays where temperature is one data layer. Omron’s 2024 health-data strategy targets JPY 100 billion in sales from cloud services that pool temperature, blood pressure and activity metrics. API-first designs allow EHR vendors to pull readings in real time, eliminating manual charting. This convergence strengthens switching costs and helps incumbents defend margins against low-cost imports. Investors view these platforms as recurring-revenue models rather than pure hardware sales, raising the medical thermometer market’s profile among digital-health portfolios.
Restraints Impact Analysis of Medical Thermometer Market*
| Restraint | (~) % Impact on CAGR Forecast | Geographic Relevance | Impact Timeline |
|---|---|---|---|
| Regulatory moves to ban mercury thermometers in emerging markets | -0.6% | APAC, MEA & LatAm | Medium term (2-4 years) |
| Accuracy & calibration variability across low-cost imports | -0.8% | Global, strongest in emerging markets | Short term (≤ 2 years) |
| Rising cybersecurity concerns around connected thermometers | -0.5% | North America & EU | Medium term (2-4 years) |
| Sensor-grade semiconductor shortages disrupting supply | -0.7% | Global, acute in APAC hubs | Short term (≤ 2 years) |
| Source: Mordor Intelligence | |||
Accuracy & calibration variability across low-cost imports
Intra-class correlation coefficients below 0.8 for many budget infrared units undermine clinician trust and can delay febrile-illness diagnosis. Larger providers now demand NIST-traceable calibration reports, increasing compliance costs for suppliers without in-house metrology labs. The FDA’s forthcoming Quality Management System Regulation, aligned with ISO 13485:2016, may exclude non-certified importers, reshaping the competitive field.
Rising cybersecurity concerns around connected thermometers
Pen-tests revealed credential-exposure flaws in several Wi-Fi thermometers, exposing hospitals to ransomware or falsified temperature data. New IEEE standards 2621 and 2933-2024 require encrypted firmware updates and authenticated command channels, adding development overhead. IT departments often isolate medical IoT on dedicated VLANs, complicating rollout in resource-constrained clinics.
*Our forecasts treat driver/restraint impacts as directional, not additive. The impact forecasts reflect baseline growth, mix effects, and variable interactions.
Medical Thermometer Market Segment Analysis
By Product Type:
Mercury-Free Devices Cement Regulatory LeadershipMercury-free thermometers represented USD 1.65 billion of the 2025 medical thermometer market size and continue to expand at 8.29% CAGR, buoyed by sweeping prohibitions on mercury under EU Regulation 2017/852. Digital stick thermometers dominate volume sales because caregivers value their sub-20-second readouts and absence of hazardous materials. Infrared guns and advanced ear probes reinforce infection-control strategies in crowded triage zones. Smart mercury-free units that sync with mobile apps are the fastest-growing niche, aided by cloud dashboards that convert raw temperature into longitudinal health trends.
Since transportation rules classify mercury devices as hazardous goods, distributors increasingly purge legacy stock in favor of mercury-free portfolios. Early movers such as Microlife leveraged R&D scale to certify products under the EU Medical Device Regulation, gaining a price premium over generic brands. Semiconductor shortages challenge smaller players lacking long-term supplier contracts, yet vertically integrated giants secure priority allocations, protecting output during demand spikes. As environmental-health frameworks tighten in Latin America and parts of Africa, the medical thermometer market faces virtually irreversible migration toward mercury-free solutions.

By Measurement Point:
Forehead Devices Capture Non-Contact MomentumOral/axillary modalities delivered USD 1.44 billion revenue in 2025, or 62.90% of the medical thermometer market, reflecting routine ward protocols and reimbursement familiarity. However, forehead scanners notch an 8.06% CAGR because they minimize surface-contact and accelerate triage. Recent sensor-fusion algorithms adjust for emissivity and ambient drift, pulling root-mean-square error below 0.2 °C in controlled studies, narrowing the gap with oral probes.
Regulators in Australia and Canada now list non-contact screening as preferred practice in aged-care infection-control manuals. Clinical buyers appreciate the ability to read dozens of patients per minute without probe covers, cutting consumable expense. Meanwhile, tympanic devices retain relevance in pediatrics thanks to minimal discomfort and stable ear-canal core-temperature correlation. Innovations such as thermochromic masks that change color above 37.5 °C illustrate how forehead-centric solutions extend beyond handheld form factors. Manufacturers that reconcile speed, hygiene and accuracy are best placed to win tenders in the evolving medical thermometer market.
By End User:
Home-Care Uptake Surges with Remote Patient MonitoringHospitals still generated 57.95% of 2025 revenue, yet home-care purchases rise 8.74% annually as RPM reimbursements widen across the United States and parts of Europe. Medicare now pays for at-home temperature surveillance within chronic-disease bundles, incentivizing providers to deploy kits that include cloud-linked thermometers. Start-ups exploit this shift by bundling software subscriptions with each unit, creating annuity streams beyond hardware margins.
Consumer channels increasingly favor app-enabled models that store multi-user profiles, aiding parents managing sick children and caregivers supporting seniors. Clinics and physician offices sit between hospital and home segments, seeking rugged devices that balance price with Professional-Grade ISO 80601-2-56 accuracy. As value-based care contracts penalize readmissions, providers integrate thermometer data with blood pressure, glucose and ECG feeds to trigger early interventions, elevating the medical thermometer market’s strategic importance inside population-health programs.
By Patient Age Group:
Pediatric Devices Lead Growth CurveAdults comprised 68.10% of units sold in 2025, but pediatric use cases post an 7.98% CAGR as technology adapts to child-specific needs. Studies from Oxford’s Horizon Scanning Centre confirm that calibrated non-contact sensors maintain suitable accuracy in children, reducing distress compared with rectal probes. Manufacturers apply gamification—LED smiley faces, mobile-app rewards—to improve compliance. Neonatal intensive-care units pioneer patch sensors with ±0.1 °C precision, essential for detecting sepsis risk within minutes.
Geriatric patients present distinct thermoregulation patterns, often lacking classic fever spikes. Continuous wrist sensors, validated in post-vaccination cohorts, provide 24/7 trendlines that flag subtle deviations sooner than spot checks. Dual-market designs that switch between adult and pediatric modes appeal to multigenerational households in emerging economies, broadening addressable demand and deepening the medical thermometer industry’s value proposition.
Geography Analysis
North America Medical Thermometer Market
North America delivered USD 838 million of the 2025 medical thermometer market, holding 36.60% share on the back of robust RPM reimbursement, hospital digitization and regulatory clarity. The region’s providers increasingly mandate cybersecurity certifications, creating barriers for low-cost importers but supporting premium ASPs. Growth remains healthy at 6.58% CAGR as home-based chronic-care programs scale nationwide.
APAC Medical Thermometer Market
Asia-Pacific, valued at USD 654 million in 2025, records the fastest 9.11% CAGR to 2031, underpinned by China’s hospital-digitization subsidies and India’s Ayushman Bharat insurance rollout. Although medtech investment fell from 2021 peaks, consolidation allows established thermometer makers to buy distressed sensor firms and capture local distribution networks. Japan’s rapidly aging population favors continuous monitoring wearables, while Southeast Asian clinics leapfrog straight to mobile-linked devices due to smartphone ubiquity.
EMEA and LATAM Medical Thermometer Market
Europe holds a steady 23.80% revenue slice as the Medical Device Regulation tightens post-market surveillance, prompting smaller brands to exit rather than re-certify. Mercury prohibitions remain a decisive tailwind and keep the medical thermometer market aligned with sustainability mandates. Middle East and Africa show double-digit expansion from a low base, propelled by infection-surveillance grants and private-hospital projects, yet logistical hurdles and currency volatility temper near-term uptake. Latin America’s public-sector tenders favor budget models, but private insurers increasingly reimburse connected devices, gradually shifting the mix toward higher-value smart thermometers.
Regulatory Landscape
Medical thermometers are regulated as medical devices with performance and quality requirements that vary by region and intended use. In the United States, clinical electronic thermometers fall under FDA Class II (21 CFR 880.2910). In June 2025, the FDA introduced a pathway under which certain basic electronic thermometers may qualify for 510(k) exemption when they conform to FDA-recognized consensus standards, including ISO 80601-2-56 and selected ASTM methods (for example E1112, E1965, E1104). This lowers premarket submission burden while keeping verification, validation, and ongoing compliance expectations tied to FDA quality requirements.
In Europe, thermometers must comply with Regulation (EU) 2017/745 (MDR), including clinical evaluation and post-market surveillance under the general safety and performance requirements. EN ISO 12487:2026, published June 3, 2026 by CEN, outlines methodologies for clinical performance evaluation of predictive-type thermometers used in indirect measurement modes, which tightens the evidence bar and test protocols for advanced algorithm- and prediction-focused features.
Value Chain Analysis
Upstream, sensing and electronics inputs remain anchored in infrared thermopile sensors for non-contact models, precision temperature sensors, microcontrollers, optics, and battery or power components, complemented by firmware and calibration algorithms that increasingly shape product differentiation. Calibration and metrology capabilities, including NIST-traceable practices where providers demand them, sit at the center of value creation since accuracy claims and batch-to-batch consistency influence clinical acceptance and tender eligibility.
Midstream work spans device assembly, software development (connectivity, cybersecurity, interoperability), validation testing, and regulatory documentation. Compliance drives both cost and timing; component changes can trigger re-qualification cycles under EU MDR or US pathways, extending development schedules. The FDA Quality Management System Regulation (QMSR), effective in February 2026, also aligns US quality-system expectations more closely with ISO 13485:2016, reducing the need to maintain separate quality playbooks by region. Downstream distribution runs through hospital procurement groups, medical-surgical distributors, pharmacies, and e-commerce for home-care, with growth also coming from remote patient monitoring programs that bundle thermometry with other vital-sign modules and software dashboards.
Competitive Landscape
The top five companies hold significant share of market creating a moderately concentrated medical thermometer market where brand trust and regulatory compliance matter as much as price. Terumo leverages a century-old thermometer legacy plus JPY 1,036.2 billion global revenue to maintain flagship status in hospitals. Cardinal Health, with USD 226.8 billion total sales, reinforces its Global Medical Products arm through the USD 1.2 billion acquisition of Specialty Networks, broadening therapeutic integration opportunities.
Technology differentiation centers on AI-powered fever-prediction algorithms embedded in wearables, as seen in Withings’ ScanWatch 2 which uses Greenteg’s CALERA sensor for 24/7 core-temperature tracking. Vendors pursue vertical integration to mitigate chip shortages, signing multi-year wafer contracts or acquiring MEMS-sensor startups. Platform economics become decisive: Omron’s cloud-based VitalSight program locks providers into subscription dashboards, raising switching costs and recurring revenue.
Regulatory shifts also reshape rivalry. The FDA’s 2025 510(k) exemption could commoditize entry-level digital sticks, spurring incumbents to migrate consumers toward premium smart models that add SaaS layers. Meanwhile, EU MDR compliance weeds out smaller brands unable to fund post-market surveillance, nudging the competitive balance toward scaled enterprises. Environmental pressure accelerates the mercury-free transition, giving early adopters of sustainable production processes a marketing edge in public-sector tenders.
Medical Thermometer Industry Leaders
-
American Diagnostic Corporation
-
Exergen Corporation
-
Actherm Medical Corp.
-
A&D Company Limited
-
CITIZEN SYSTEMS JAPAN CO. LTD
- *Disclaimer: Major Players sorted in no particular order
Medical Thermometer Market Companies Covered in this Report
- A&D Company Ltd
- American Diagnostic Corp
- Actherm Medical Corp
- Exergen Corp
- Citizen Systems Japan Co Ltd
- Microlife Corp
- OMRON
- Cardinal Health
- Innovo Medical
- Welch Allyn Inc (Baxter International Inc.)
- Tecnimed Srl
- Terumo
- VivaLnk Inc
- iProven
- Kinsa Inc
- HuBDIC Co Ltd
- Hartmann Group
- BPL
Market Opportunities and Future Outlook
Interoperability and workflow integration create whitespace as temperature measurement moves from standalone devices toward connected clinical and home-care data streams. Providers are expanding RPM programs and multi-parameter kits, and the market has opportunities for thermometers and temperature sensors that integrate into EHR/EMR environments using HL7 or FHIR data exchange while meeting rising cybersecurity expectations for connected medical IoT. The FDA pathway change in June 2025 for certain basic Class II clinical electronic thermometers (510(k) exemption under conditions) supports faster refresh cycles for entry-level devices, shifting differentiation toward software features, device management, and secure connectivity rather than hardware alone.
Advanced temperature modalities also create opportunities where evidence and standards are tightening. EN ISO 12487:2026 (published June 2026) formalizes clinical performance evaluation methods for predictive-type thermometers in indirect measurement mode, encouraging manufacturers to strengthen validation packages for algorithm-driven products. At the same time, modular monitoring platforms increasingly incorporate skin temperature as one of several continuous parameters, illustrated by Philips IntelliVue PM 6000 Series (June 2026) and related platform expansions that extend temperature sensing beyond handheld thermometers into broader patient monitoring.
Recent Industry Developments in Medical Thermometer Market
- June 2026: Philips announces IntelliVue PM 6000 Series with modular expansion concepts, enabling deeper integration of temperature sensing within hospital monitoring ecosystems. The launch supports a platform-based approach that can drive broader adoption of temperature data in clinical workflows and interoperability with existing EHR and IoT frameworks.
- April 2026: Sibel Health receives FDA 510(k) clearance for the ANNE Maternal wireless monitoring platform, enabling integration of maternal temperature and vital-sign data into remote patient monitoring workflows. The clearance anchors a regulatory milestone that expands access to maternal care monitoring in hospital and home-care settings.
- June 2025: The US FDA updated requirements for Class II clinical electronic thermometers, exempting certain devices from 510(k) premarket notification while keeping quality and standards-based obligations in place. The update reduces premarket friction for eligible basic thermometers and elevates the importance of robust internal verification and conformity to FDA recognized standards.
Medical Thermometer Market Report Scope and Research Methodology
Market Definition and Coverage
For this study, the market covers medical thermometers used to measure human body temperature in clinical care, home care, and remote monitoring. It includes contact and non-contact devices, and counts revenues from reusable and single-use formats sold through typical healthcare and consumer channels.
Scope exclusions: Industrial, veterinary, and process thermometers are not counted, even if similar sensing components are used.
Segments Covered in This Report
- By Product Type
- Mercury-Based
- Mercury-Free
- Infrared (Contact-less)
- Digital (Contact)
- Smart / Connected
- By Measurement Point
- Forehead
- Ear (Tympanic)
- Oral/Axillary
- Rectal
- By End User
- Hospitals
- Clinics and Physician Offices
- Home-care Settings
- Others
- By Patient Age Group
- Neonatal
- Pediatric
- Adult
- By Geography
- North America
- United States
- Canada
- Mexico
- Europe
- Germany
- United Kingdom
- France
- Italy
- Spain
- Rest of Europe
- Asia-Pacific
- China
- Japan
- India
- Australia
- South Korea
- Rest of Asia-Pacific
- Middle East and Africa
- GCC
- South Africa
- Rest of Middle East and Africa
- South America
- Brazil
- Argentina
- Rest of South America
- North America
Data Sources, Market Sizing, and Validation
Desk Research
Desk research was used to build the base structure of the market and to keep assumptions realistic before interviews began. We relied on public sources such as the US FDA device classification and guidance pages, the European Commission information related to mercury restrictions, World Bank and IMF macro indicators, UN Comtrade trade flows for relevant device categories, and peer-reviewed clinical publications that discuss thermometer accuracy and usage patterns.
In parallel, we reviewed company annual reports, investor presentations, earnings call notes, and reputable press to understand product mix shifts and channel changes. Where available, paid subscriptions for company financials and patent databases were used to organize disclosures and track technology direction without relying on a single narrative thread. The sources listed above are illustrative, and many other public datasets and documents were also checked for data collection, validation, and clarification.
Primary Interviews and Surveys
Primary work focused on validating adoption and pricing across key care settings, including hospitals, clinics, and home-use purchasing. We spoke with a mix of product, sales, clinical, and procurement roles to test what is actually bought by unit type (digital contact, infrared, and remaining mercury-based demand) and how replacement cycles behave in different regions.
The respondent input also helped confirm how procurement teams differentiate clinical-grade infrared units versus contact thermometers, especially when remote monitoring programs specify measurement types and replacement intervals.
Distribution of primary research fieldwork respondents
| Company type | Respondent position | Region |
|---|---|---|
| Top tier: 33% | CXOs: 18% | APAC: 48% |
| Mid tier: 49% | Functional/Unit leaders: 27% | EMEA: 31% |
| Smaller Players: 18% | Managers: 55% | Americas: 21% |
Market-Sizing & Forecasting
The model starts from a top-down demand pool, where healthcare activity and population signals are translated into thermometer purchasing need and then filtered by technology preference and use setting. Inputs that were used to shape the demand curve included fever screening intensity in care delivery, shares of non-contact versus contact measurement by setting, typical replacement and calibration cycles, average selling price ranges by technology, and policy and compliance shifts away from mercury devices.
Those totals were then stress-tested with selective bottom-up checks, such as sampled ASP times estimated unit volumes for a few major channels, plus distributor and procurement feedback on order patterns. When some geographies lacked clean product mix data, we used proxy indicators like import trends and hospital bed growth, and then rechecked the implied volumes with interview feedback from sales and procurement contacts.
For forecasting, scenario analysis was used, anchored to expected normalization of screening behavior, device upgrade cycles, and price movement assumptions that were confirmed during primary discussions. Growth rates were adjusted only when multiple signals moved in the same direction and the assumptions could be explained in simple volume and price terms tied to technology mix (non-contact versus contact).
Data Validation & Update Cycle
Validation is done through several checks that look for mismatches between the model output and independent market signals, such as trade movement patterns, device policy changes, and reported category revenue direction. If a variance looked too large, the assumption was revisited, and follow-up questions were sent to selected respondents to confirm the practical reason behind the change.
Before final sign-off, the numbers are reviewed in steps by another analyst, and key calculations are re-run to avoid hidden formula errors and inconsistent currency conversions. Reports are refreshed every year, and interim updates are added when major regulatory or supply events materially shift demand or pricing. Right before delivery, we run a fresh pass to reflect the latest public updates that can affect the forecast line for thermometer categories and pricing.
Mordor Intelligence's Medical Thermometer Market Size Compared Against Other Published Estimates
Published market size figures for medical thermometers can look far apart, even when they talk about similar devices. Differences usually come from what is counted as a medical thermometer, the year used as the starting point, and how price and volume are carried forward in the forecast.
Import and export movement, public policy signals on mercury phase-outs, and interview-validated price bands are the checks that keep Mordor Intelligence aligned to a human temperature measurement scope, which leads to a 2025 value that is lower than estimates that appear to include adjacent monitoring devices or broader consumer wellness electronics.
Benchmark comparison
| Source | Market Size | Gaps in Research Methodology |
|---|---|---|
| Mordor Intelligence | USD 2.29 B (2025) | |
| Industry Publisher A | USD 5.47 B (2024) | Uses a broader counted universe and a different base year, with segmentation that can fold in connected wellness and monitoring products beyond core medical thermometers, which inflates the revenue pool. |
| Research Firm B | USD 2.24 B (2023) | Anchors the series to an earlier base year and a shorter horizon, and the price progression assumptions appear to be applied more uniformly across technologies, which can shift the mid-period totals. |
The spread in the table mainly comes from boundary choices and the year each publisher anchors to, and then how fast prices and mix are allowed to move. By keeping the scope tied to temperature measurement devices and by rechecking volume and price logic through multiple external signals, the estimate stays traceable to clear steps that a reader can reproduce and challenge.
Key Questions Answered in the Report
What is the current size and growth outlook for the medical thermometer market?
The market totals USD 2.46 billion in 2026 and is projected to hit USD 3.55 billion by 2031, reflecting a 7.57% CAGR.
Why do mercury-free thermometers dominate sales?
Mercury-free models already hold 72.22% share because global bans such as the EU’s Regulation 2017/852 restrict mercury devices and push hospitals and consumers toward safer digital alternatives.
Which end-user segment is expanding the fastest?
Home-care environments show the highest growth at 8.74% CAGR through 2031 as remote-patient-monitoring programs gain reimbursement support and clinicians integrate temperature checks into telehealth workflows.
Which geographic region offers the strongest growth potential?
Asia-Pacific is advancing at a 9.11% CAGR thanks to large aging populations, expanding healthcare infrastructure and national digitization initiatives that favor connected thermometry.