
Medical Sensor Market Size and Share
Market Overview
| Study Period | 2020 - 2031 |
|---|---|
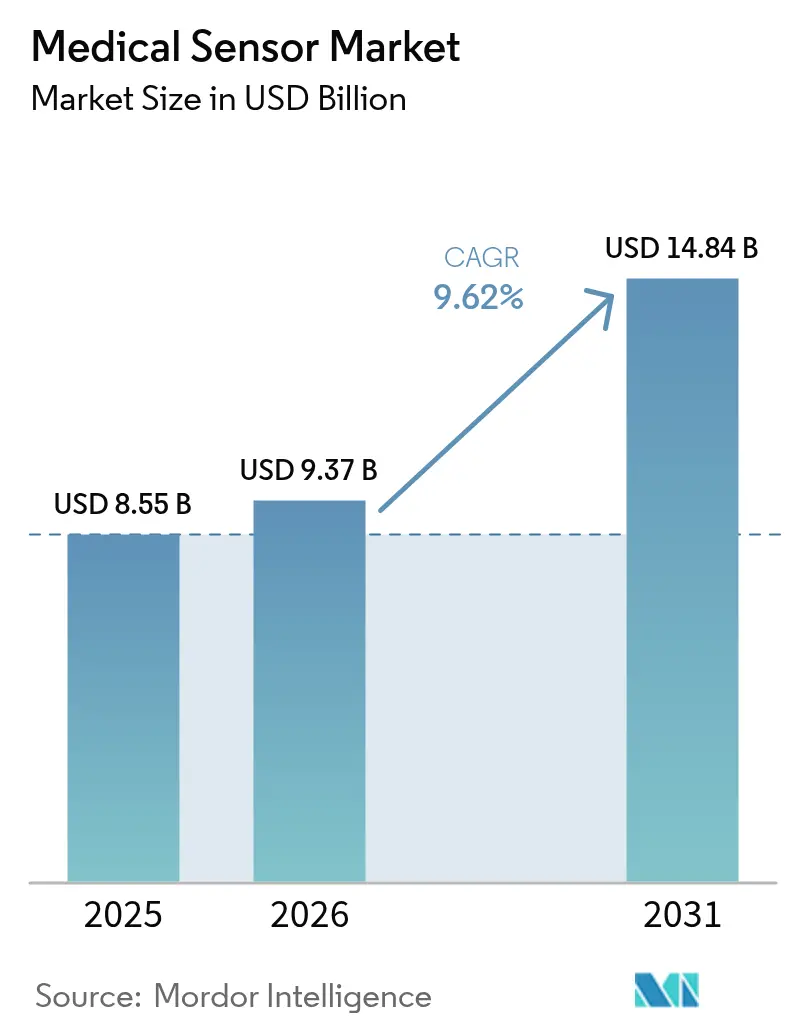
| Market Size (2026) | USD 9.37 Billion |
| Market Size (2031) | USD 14.84 Billion |
| Growth Rate (2026 - 2031) | 9.62% CAGR |
| Fastest Growing Market | Asia Pacific |
| Largest Market | North America |
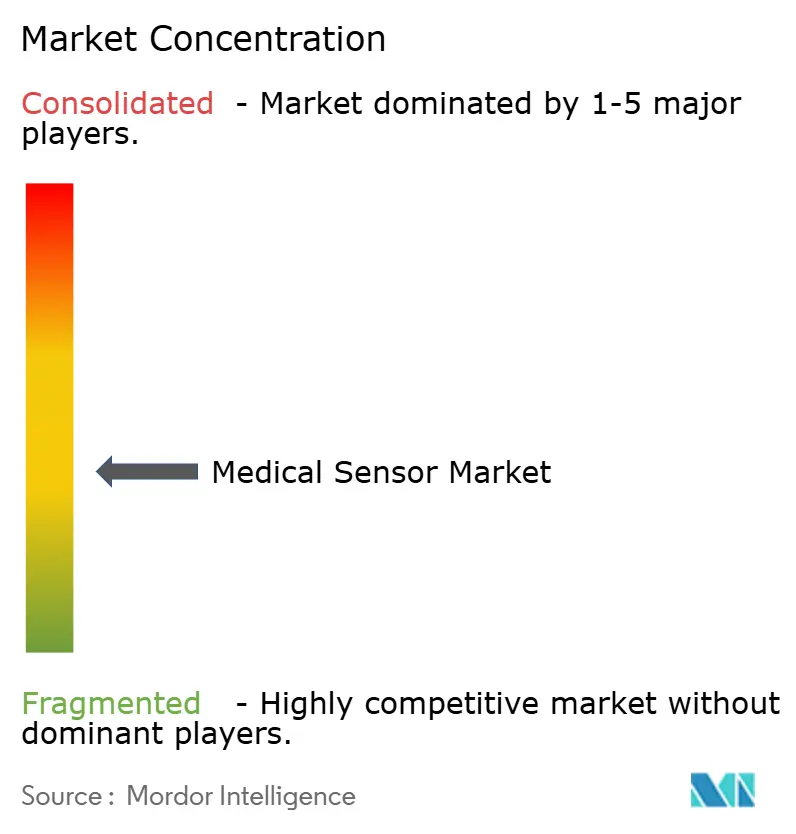
| Market Concentration | Medium |
Major Players *Disclaimer: Major Players sorted in no particular order Image © Mordor Intelligence. Reuse requires attribution under CC BY 4.0. | |
Medical Sensor Market Analysis by Mordor Intelligence
The medical sensors market size was valued at USD 8.55 billion in 2025 and estimated to grow from USD 9.37 billion in 2026 to reach USD 14.84 billion by 2031, at a CAGR of 9.62% during the forecast period (2026-2031). Rapid semiconductor miniaturization, AI-enabled analytics, and supportive regulatory pathways are accelerating the commercialization of medical devices across clinical and consumer settings. Biosensors retain demand leadership as glucose monitoring shifts from episodic testing to real-time feedback. Optical and image sensors gain momentum through high-resolution, non-invasive diagnostics that complement traditional modalities. Domestic fabrication incentives under the U.S. CHIPS Act, combined with national procurement programs in China, continue to shape supply chains and regional competitive advantages. Strategic partnerships between device firms and technology companies are shortening development cycles and broadening ecosystem integration to unlock new revenue pools across the medical sensors market.
Key Report Takeaways
- By sensor type, biosensors led with 43.35% medical sensors market share in 2025; optical/image sensors are forecast to expand at a 14.12% CAGR through 2031.
- By technology, MEMS devices captured 51.90% of the medical sensors market size in 2025, while nano/graphene sensors are projected to grow at 14.55% CAGR.
- By mode of deployment, wearable sensors accounted for 38.25% of the medical sensors market size in 2025; implantable sensors are advancing at a 13.05% CAGR to 2031.
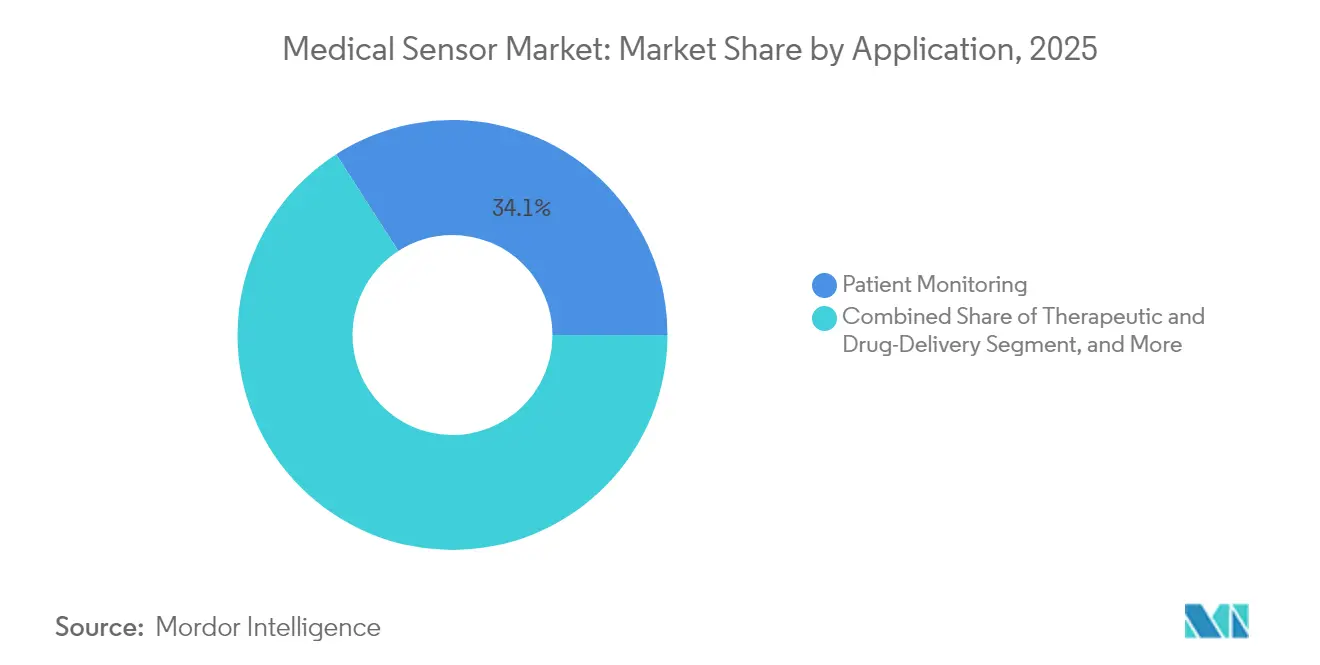
- By application, patient monitoring held 34.10% medical sensors market share in 2025; therapeutic and drug-delivery applications are growing at 13.22% CAGR.
- By end-user, hospitals controlled 63.30% of the medical sensors market size in 2025, whereas home-care settings show a 13.74% CAGR outlook.
- By geography, North America represented 34.20% medical sensors market share in 2025; Asia-Pacific exhibits the fastest regional CAGR at 13.92% to 2031.
Note: Market size and forecast figures in this report are generated using Mordor Intelligence’s proprietary estimation framework, updated with the latest available data and insights as of 2026.
Global Medical Sensor Market Trends and Insights
Drivers Impact Analysis*
| Driver | (~) % Impact on CAGR Forecast | Geographic Relevance | Impact Timeline |
|---|---|---|---|
| AI-enabled Continuous Glucose Monitoring Adoption in North America | +2.1% | North America, spill-over to EU | Medium term (2-4 years) |
| EU MDR–Driven Shift to Traceable Disposable Sensors | +1.8% | Europe, regulatory influence in Asia-Pacific | Long term (≥ 4 years) |
| China NHSA Procurement of Home-use SpO₂ Wearables | +1.5% | China, influence across Asia-Pacific | Short term (≤ 2 years) |
| Demand for Sterilizable Sensors in Robotic-Assisted Surgery (Japan) | +1.2% | Japan, adoption in developed markets | Medium term (2-4 years) |
| U.S. CHIPS-Act MEMS Fabs for Medical Sensors | +1.0% | North America, supply chain resilience globally | Long term (≥ 4 years) |
| 3D-Printed Microfluidic Wound Sensors in German Hospitals | +0.9% | Germany, EU adoption, clinical validation globally | Medium term (2-4 years) |
| Source: Mordor Intelligence | |||
AI-enabled continuous glucose monitoring adoption
Roche secured CE Mark for its Accu-Chek SmartGuide system in 2024, integrating predictive algorithms that anticipate hypoglycemia events hours in advance. The FDA expanded automated insulin dosing clearance to Type 2 diabetes patients the same year, validating a path for closed-loop therapies. Dexcom’s USD 75 million investment in Oura underscores convergence between metabolic sensing and holistic wellness tracking. Collaboration between Abbott and Medtronic is accelerating interoperable platforms that link CGM data to pump algorithms in near real time. IBM and Roche advanced this trajectory in 2025 by adding lifestyle-based predictive models to sensor dashboards.[1]Roche, “Roche Receives CE Mark for Its AI-Enabled Continuous Glucose Monitoring Solution,” roche.com
EU MDR–driven shift to traceable disposable sensors
Medical Device Regulation enforcement obliges full life-cycle traceability through unique device identifiers embedded in even single-use products, pushing manufacturers to integrate digital tracking into disposables shipped to European clinics. German hospitals now pilot 3D-printed microfluidic wound sensors that log batch data at the point of care, creating feedback loops that support both reimbursement and post-market surveillance. Global firms increasingly adopt MDR-compliant design across all facilities to avoid dual inventories, elevating quality baselines in Asia-Pacific contract lines that supply European orders.
China NHSA procurement of home-use SpO₂ wearables
China’s National Healthcare Security Administration deployed millions of AI-equipped pulse-oximeters through public hospitals in 2024. Interoperability mandates ensure these devices feed national electronic health records, enabling epidemiological insights that strengthen chronic disease prevention. Vendors tailor firmware to meet local data-sovereignty rules while sustaining ISO-13485 certification, generating a bifurcated feature set that differentiates China-bound inventory from export models.
Demand for sterilizable sensors in robotic-assisted surgery
Japanese surgical centers require pressure and optical sensors capable of repeated autoclave exposure without drift. Soft optical blood sensors used in colonoscopy trials reached 96% detection performance while enduring high-pressure steam cycles. Material science programs focus on high-temperature polymers and hermetic glass encapsulation to extend sensor lifetimes through dozens of procedures, creating a premium segment that commands higher average selling prices in the medical sensors market.
Restraints Impact Analysis*
| Restraint | (~) % Impact on CAGR Forecast | Geographic Relevance | Impact Timeline |
|---|---|---|---|
| Divergent Cyber-Security Labeling (FDA RTA-V vs EU MDCG 2024-12) | -1.4% | Global, with acute impact in North America and EU | Short term (≤ 2 years) |
| Medical-grade Semiconductor Wafer Shortage (APAC) | -1.1% | Asia-Pacific manufacturing, global supply chain impact | Medium term (2-4 years) |
| EU WEEE/RoHS 2024 Cost Impact on Single-use Sensors | -0.8% | Europe, influence on global manufacturing standards | Long term (≥ 4 years) |
| Clinician Workflow Overload with Multi-param Wearables (UK NHS) | -0.6% | UK, broader adoption challenges in public health systems | Medium term (2-4 years) |
| Source: Mordor Intelligence | |||
Divergent cyber-security labeling
Mismatch between the FDA’s real-time threat assessment framework and the EU’s pre-market security dossier rulebook requires dual validation pipelines. Development timelines lengthen by up to 20% and smaller entrants frequently limit launches to a single region, constraining competitive diversity and slowing global diffusion of innovations.
Medical-grade semiconductor wafer shortage
Foundries across Taiwan, South Korea, and China prioritize consumer electronics orders, leaving specialized image-sensor and analog lines under-allocated for medical demand. Lead times on advanced nodes exceed 12 months, pushing device makers to explore domestic wafer capacity expansions supported by the U.S. CHIPS Act funding mechanisms.
*Our forecasts treat driver/restraint impacts as directional, not additive. The impact forecasts reflect baseline growth, mix effects, and variable interactions.
Segment Analysis
By Sensor Type: Biosensors sustain clinical versatility
Biosensors captured 43.35% of the medical sensors market in 2025, anchored by glucose, cardiac, and infectious disease assays that display strong reimbursement support. Blood-glucose modules dominate subsegment revenues as continuous sensing replaces fingerstick diagnostics. Electrochemical platforms integrate AI filters that flag anomalous readings and reduce false alarms, boosting clinician trust. Pressure sensors remain critical in ventilators and hemodynamic monitors, while temperature elements now feature in multiparameter wearables that track fever progression. Flow sensors support respiratory therapy devices whose volumes rose following pandemic surges. Optical and image sensors hold the fastest growth path with a 14.12% CAGR as terahertz and hyperspectral modalities enable non-invasive tissue characterization. Accelerometers advance rehabilitation tools for stroke survivors, and niche graphene biosensors demonstrate sub-picomolar detection thresholds that anticipate future commercial uptake.
The competitive mix within biosensors is widening as research centers patent carbon nanotube arrays targeting hormonal biomarkers, adding depth to the medical sensors industry pipeline. Market leaders co-develop sensor-analytics bundles that merge raw signals with predictive dashboards. This services layer raises switching costs and broadens profit pools beyond the hardware sale. Given these trends, biosensors will preserve their dominant role while ceding relative percentage share to image-centric modalities that address oncology and dermatology needs within the medical sensors market.


By Technology: MEMS leadership meets nano-scale disruption
MEMS platforms provided 51.90% of the medical sensors market size in 2025 due to matured fabrication ecosystems and established reliability metrics. They underpin pressure, inertial, and flow devices across ICU monitors and ambulatory pumps. CMOS fabrication supports high-resolution image sensors and multifunctional system-on-chip solutions that house photodiodes, amplifiers, and radio interfaces. Fiber-optic sensors penetrate MRI suites and burn units where electromagnetic immunity is mandatory, supported by advances in flexible glass fibers that survive tensile strain.
Nano and graphene devices, though only a fraction of shipments, will post a 14.55% CAGR through 2031. Graphene metasurface biosensors demonstrated single-molecule viral detection in laboratory trial. Universities also produced sound-wave graphene sensors that achieve chemical fingerprinting, underscoring ultra-high sensitivity possibilities. Parallel progress in 3D-printed organic electronics opens design freedom for custom geometries that conventional lithography cannot deliver. As production yields improve, nano-scale architectures will increasingly displace MEMS in niche, high-sensitivity use cases across the medical sensors market.
By Mode of Deployment: Wearables dominate consumer entry
Wearable devices represented 38.25% of 2025 revenue, supported by smartphone connectivity and cloud analytics that translate sensor feeds into user-friendly dashboards. Fitness-oriented form factors use optical, inertial, and temperature elements to deliver sleep and activity insights, while clinical-grade patches collect ECG and SpO₂ data under regulated programs. Non-invasive designs reduce adherence barriers and expand sampling frequency, thus enhancing longitudinal datasets critical for preventive care algorithms.
Implantable platforms are growing at 13.05% CAGR as wireless power and miniaturized batteries lengthen dwell time. Early vascular health sensors already monitor pressure and flow to guide therapy adjustments. Disposable sensors answer infection control needs and meet traceability regulations by embedding low-cost memory tags that store batch identifiers. Their adoption surged during the pandemic when isolation protocols limited device reuse, a trend that remains sticky across the medical sensors market.
By Application: Patient monitoring anchors adoption
Patient monitoring retained 34.10% of the medical sensors market in 2025, reflecting broad integration into vitals stations, telehealth kits, and chronic disease dashboards. Remote models lower readmission risk and enable value-based reimbursement structures. Diagnostic imaging sensors deliver sharper resolution at lower radiation doses, aided by iterative reconstruction algorithms. Surgical guidance sensors provide real-time tissue oxygen feedback, elevating precision in minimally invasive procedures.
Therapeutic and drug-delivery systems hold the strongest growth at 13.22% CAGR as patch pumps and electronic bandages embed flow and pH sensors that titrate dosing in response to physiological cues. Wellness and fitness applications extend sensor footprints into consumer routines, creating hybrid datasets that bridge clinical and lifestyle domains. AI analytics extract early warning signals, positioning predictive care as a cornerstone of the medical sensors market.
By End-user: Hospitals retain scale but home care accelerates
Hospitals accounted for 63.30% of 2025 revenue by combining procurement power with clinical validation frameworks. Critical care floors rely on invasive pressure and hemodynamic sensors that interface with centralized monitoring stations. Ambulatory surgical centers embrace single-use optical elements that expedite turnover and minimize infection risk. Specialty clinics pilot niche devices such as sweat-resistant electromyography arrays that facilitate post-stroke rehabilitation.
Home-care settings record a 13.74% CAGR as reimbursement codes for remote patient monitoring expand coverage across chronic conditions. AI-driven dashboards translate multivariate sensor outputs into actionable home alerts. Smart textiles with embedded fiber-optic networks track mobility in elderly populations and deliver 100% activity classification accuracy during pilot studies. This distributed approach alleviates hospital capacity pressures and reshapes the care continuum within the medical sensors market.
Geography Analysis
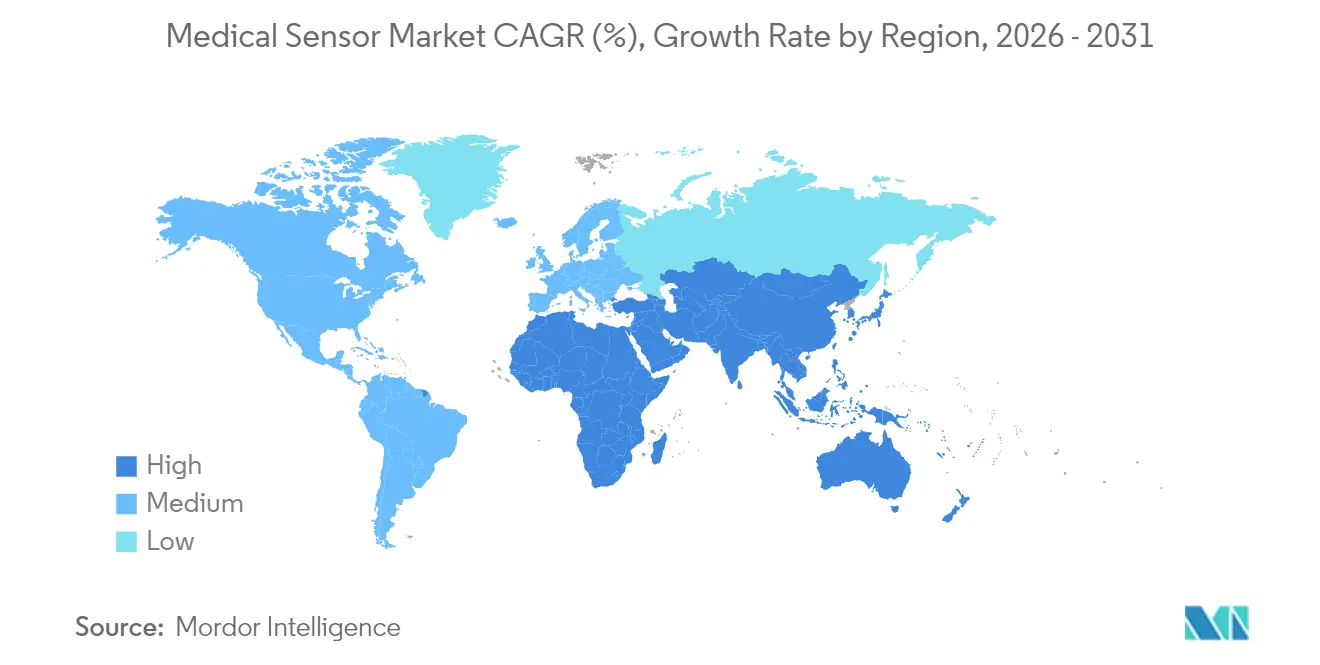
North America maintained 34.20% revenue share in 2025 owing to large installed bases of connected diabetes and cardiac devices. The CHIPS Act earmarks USD 52 billion for semiconductor capacity that prioritizes medical allocations, reducing import reliance. FDA cybersecurity guidance promotes secure-by-design principles, granting compliant vendors first-mover position. Strategic alliances, such as the Dexcom-Oura partnership, spotlight a region where consumer wearables and regulated devices increasingly overlap. Canada leverages a single-payer model to pilot community-scale remote monitoring, while Mexico attracts nearshored sensor component production under US-Mexico-Canada free trade provisions.
Asia-Pacific presents the fastest expansion at a 13.92% CAGR through 2031. China’s NHSA mass procurement funnels millions of SpO₂ wearables into primary care, creating the largest longitudinal oximetry dataset worldwide. Japan’s aging society and high adoption of robotic surgery fuel demand for autoclave-resistant sensors. India scales low-cost glucometers under national non-communicable disease programs. South Korea’s foundries enable co-location of design and fabrication, shortening cycle times for next-generation pressure and image sensors. Semiconductor wafer shortages remain a headwind, yet government incentives encourage local capacity build-out, maintaining momentum across the medical sensors market.
Europe benefits from harmonized MDR regulations that elevate traceability standards and spur adoption of smart disposable sensors. Germany pilots 3D-printed wound sensors that offer embedded UDI codes for post-market surveillance. The United Kingdom’s National Health Service trials multi-parameter wearables under digital ward models, though clinician workload concerns moderate rollout speed. France and Italy adapt cybersecurity conformity assessments ahead of EU deadlines, supporting cross-border device portability. Data privacy mandates drive encryption and edge-processing innovations, shaping global design templates for secure medical sensors market deployments.

Regulatory Landscape
Regulation for medical sensors is tightening around quality systems, traceability, and connected-device assurance across major regions. In the United States, the FDA Quality Management System Regulation (QMSR) became effective on February 2, 2026, aligning 21 CFR Part 820 more closely with ISO 13485:2016. This raises the compliance baseline for sensor-enabled device manufacturers and their critical suppliers. Product and performance standards also keep evolving, including ISO 80601-2-61:2026 (Edition 3), published in April 2026, which updates basic safety and essential performance requirements for pulse oximeter equipment. That change influences design verification and clinical validation for SpO2 sensing platforms.
In Europe, the EU MDR framework continues to drive operational requirements for disposable and connected sensors, especially UDI and post-market surveillance expectations. As of May 28, 2026, the European Commission mandated use of the first four EUDAMED modules, including actor registration, UDI and device registration, and certificates. This increases data-readiness demands across manufacturers and authorized representatives. The European Commission also proposed amendments in COM(2025) 1023 to EU MDR and IVDR to reduce burdens and improve device availability, indicating ongoing policy refinement while maintaining emphasis on traceability and market surveillance.
Value Chain Analysis
The medical sensors value chain covers upstream semiconductor materials and fabrication, sensor die and package production, module integration (including firmware and connectivity), medical device OEM assembly, regulatory verification and validation, and downstream distribution through hospitals, clinics, and home-care channels. Medical-grade semiconductor availability remains a key dependency, and the 2024-2025 bottlenecks were concentrated in long lead times for specialized sensor-grade silicon, analog front-ends, and ASIC interfaces. As a result, OEMs have to balance performance targets with component lifecycle constraints.
Midstream and downstream activities are increasingly shaped by connected-care requirements and regulatory traceability, which increases the role of software, cybersecurity controls, and device identification in what used to be a hardware-led chain. OEMs and sensor suppliers are moving toward co-development partnerships and custom ASIC strategies to reduce obsolescence risk and improve control over reliability and testing, including 100% wafer-level testing requirements for medical ICs. EU MDR and IVDR compliance expectations also add documentation and supplier-visibility demands across tiers, strengthening the need for digital supply-chain intelligence and tighter quality agreements from foundry through finished medical device.
Competitive Landscape
The medical sensors market shows moderate fragmentation. Powerhouses such as Medtronic, Abbott, and Dexcom utilize their regulatory track records and extensive portfolios to maintain channel dominance. Semiconductor specialists, including STMicroelectronics and NXP, serve as critical upstream partners, ensuring supply continuity and providing reference design support. Consumer-electronics entrants capitalize on volume manufacturing and UX expertise to fast-track FDA submissions for wellness devices that straddle regulated and non-regulated categories.
Partnerships define competitive strategy. Volta Medical partnered with GE HealthCare to integrate AI electrophysiology algorithms with advanced mapping sensors, accelerating cath lab adoption. Dexcom and Abbott pursue ecosystem plays that link CGM data to consumer sleep and activity metrics, broadening longitudinal insight. Emerging startups focus on nano-material breakthroughs that promise order-of-magnitude sensitivity gains, positioning them as potential acquisition targets once manufacturability hurdles are cleared.
Competitive intensity heightens as policymakers tie reimbursement to outcome evidence that sensors uniquely provide. Firms integrate analytics subscriptions and cloud dashboards to elevate recurring revenue share. Those able to secure domestic wafer supply, achieve MDR cybersecurity conformity, and build AI stewardship credentials will strengthen standing in the medical sensors market over the forecast horizon.
Medical Sensor Industry Leaders
Medtronic plc
TE Connectivity Ltd.
Honeywell International Inc.
GE Healthcare Technologies Inc.
Abbott Laboratories
- *Disclaimer: Major Players sorted in no particular order

Market Opportunities and Future Outlook
Multi-analyte and longer-wear continuous sensing is a clear whitespace where sensor differentiation aligns with clinical pathways and device platform strategy. Europe-focused approvals illustrate this direction: Senseonics received CE Mark in January 2026 for Eversense 365, a 365-day implantable CGM system, and Abbott secured CE Mark in May 2026 for Libre Duo and Libre Duo 10 Day systems for simultaneous continuous glucose and ketone monitoring. These milestones broaden the addressable scope beyond glucose-only workflows and give sensor makers room to compete on accuracy, wear duration, calibration burden, and clinical decision support integration.
A second opportunity is sensor-to-workflow integration for decentralized monitoring, where adoption depends on interoperability, cybersecurity, and usability as much as sensing performance. Partnerships show how ecosystem alignment is becoming a go-to-market lever: in June 2026, MiniMed expanded its commercialization agreement with Abbott to integrate dual glucose-ketone sensors into MiniMed smart dosing platforms, linking sensor innovation to automated or guided therapy decisions. For suppliers, this increases the value of reference designs, validated connectivity stacks, and data pipeline readiness (EHR/IoMT alignment), and it supports recurring revenue models through analytics layers built on sensor data streams.
Recent Industry Developments
- June 2026: MiniMed announced an expanded commercialization agreement with Abbott to integrate dual glucose-ketone sensors into MiniMed smart dosing platforms. The announcement frames multi-analyte sensing as a platform feature rather than a standalone component, increasing switching costs through tighter therapy workflow integration.
- June 2026: Medtronic received FDA 510(k) clearance for the Nellcor pulse oximetry system with the Nell-EQ intelligent processor to improve SpO2 and pulse rate monitoring reliability across diverse patients and conditions. This clearance supports continued refresh cycles in hospital monitoring sensors where performance robustness and standard compliance act as procurement gatekeepers.
- May 2024: Sensirion launched the SLD3x series compact digital liquid flow sensor platform designed for precise dosing in subcutaneous drug delivery, including features such as bubble detection and occlusion alerts. The launch reinforces the role of safety-oriented sensing in therapeutic and drug-delivery devices where flow accuracy and fault detection directly affect clinical risk.


Research Methodology Framework and Report Scope
Market Definition and Coverage
The medical sensors market, for this methodology, covers sensor components and modules that detect physiological or device signals and convert them into usable readings inside medical devices and monitoring systems, across clinical and consumer care settings.
Scope exclusions: Pure software analytics, standalone displays, and non-medical industrial sensors are not counted unless they are sold as part of a medical sensing solution.
Segmentation Overview
- By Sensor Type
- Pressure Sensors
- Temperature Sensors
- Biosensors
- Blood-Glucose Sensors
- Flow / Airflow Sensors
- Optical / Image Sensors
- Accelerometers and Motion Sensors
- Other Sensor Types
- By Technology
- MEMS
- CMOS
- Fiber-optic
- Nano / Graphene
- 3D-Printed
- Sensor Fusion Modules
- By Mode of Deployment
- Wearable
- Implantable
- Invasive (Catheter-based)
- Non-invasive
- Disposable / Single-use
- By Application
- Patient Monitoring (Vital Signs, RPM)
- Diagnostic Imaging and In-vitro Diagnostics
- Therapeutic and Drug-Delivery
- Surgical and Minimally-Invasive Procedures
- Wellness and Fitness
- By End-user
- Hospitals and Large Health Systems
- Ambulatory Surgical Centers
- Home-care Settings
- Specialty Clinics and Diagnostic Labs
- By Geography
- North America
- United States
- Canada
- Mexico
- Europe
- United Kingdom
- Germany
- France
- Italy
- Rest of Europe
- Asia-Pacific
- China
- Japan
- India
- South Korea
- Rest of Asia-Pacific
- Middle East and Africa
- Middle East
- Saudi Arabia
- United Arab Emirates
- Turkey
- Rest of Middle East
- Africa
- South Africa
- Egypt
- Rest of Africa
- Middle East
- South America
- Brazil
- Argentina
- Rest of South America
- North America
Data Sources, Market Sizing, and Validation
Desk Research
Desk research starts by building a fact base around patient monitoring adoption, diagnostic procedure volumes, and connected device penetration, then mapping those demand indicators to how sensing content is typically specified in regulated medical devices. For sources, we use public and official material such as the US FDA device databases and safety communications, US CDC and OECD health statistics, World Bank population and aging indicators, and trade and customs statistics where sensor-enabled device flows can be directionally checked.
On the supply side, we review company annual reports, 10-K style filings, investor presentations, earnings transcripts, and product brochures to understand what is being shipped and how sensing content is positioned inside devices. Patent databases are also used to confirm technology direction (for example, biosensing and MEMS related filings). A paid subscription for company financials and news is used selectively to cross-check revenue splits and major capacity or product announcements. The desk sources listed here are illustrative only, and additional public references were used for validation and clarification during the work.
Primary Interviews and Surveys
Primary work is used to pressure test assumptions that are hard to see in public data, such as typical sensor content per device, replacement cycles, and pricing movement by sensor type and use case. Interviews include device OEM teams, component suppliers, contract manufacturers, distributors, and hospital or homecare procurement stakeholders across APAC, EMEA, and the Americas. Their inputs are then used to align the model to real purchase behavior and regulatory driven demand shifts.
Distribution of primary research fieldwork respondents
| Company type | Respondent position | Region |
|---|---|---|
| Top tier: 28% | CXOs: 16% | APAC: 46% |
| Mid tier: 55% | Functional/Unit leaders: 31% | EMEA: 31% |
| Smaller Players: 17% | Managers: 53% | Americas: 23% |
Market-Sizing & Forecasting
Sizing begins with a top-down build where medical device production and installed base signals are reconstructed by major application areas, and then sensor penetration and average sensor content are applied to convert that demand pool into market value. Because not every country reports the same device statistics, we normalize inputs using healthcare spend, procedure volumes, and aging population indicators before allocating totals by region.
To keep the outputs practical, we corroborate totals using selective bottom-up approximations, such as sampling device categories and applying typical sensors-per-device and ASP ranges shared by interviewees, followed by channel checks where available. Key model inputs include patient monitoring device shipments, diagnostic imaging and critical care utilization, wearable health device adoption, sensor replacement and calibration cycles, and ASP movement by sensor type as designs shift toward smaller and more integrated sensing modules.
Forecasts are built using scenario analysis supported by expert consensus on the direction of procedure growth, remote monitoring adoption, and regulatory and reimbursement tailwinds, and then the scenarios are converted into a single base case for reporting. Where bottom-up gaps exist, the missing pieces are filled using ratio-based proxies from similar device classes and are only accepted after they match independent demand signals and interview feedback.
Data Validation & Update Cycle
Validation is done in layers so the final totals are not driven by one data stream. We compare outputs against independent signals like device shipment trends, healthcare utilization indicators, and publicly discussed pricing patterns, then investigate any variance that looks too large for the underlying drivers.
Before sign-off, assumptions are reviewed across multiple analysts, and outliers trigger follow-up calls or extra source checks, especially when a single geography or application shows an unusual jump. Reports are refreshed annually, with interim updates when material events occur such as major regulatory changes, pricing shocks, or supply constraints. A final pre-delivery review is completed so clients receive the most current view.
Mordor Intelligence's Medical Sensors Market Size Measured Against Other Published Estimates
Published market sizes for medical sensors can vary widely because each publisher draws the boundary differently and uses a different mix of device scope, sensor content assumptions, and time-period currency conversion. Differences in whether the focus is on sensor components versus full sensor-enabled devices also tend to create large gaps.
Key gap drivers in this market usually come from what gets counted as medical sensing value, how fast ASPs are assumed to change as integration increases, and whether the demand pool is anchored to procedure and monitoring utilization or to broader medical device revenues. By tracking procedure-linked demand signals and refreshing sensor content and ASP assumptions through primary checks, Mordor Intelligence keeps the 2026 market value tied to sensor revenue rather than full device value, which is where the largest spread typically begins.
Benchmark comparison
| Source | Market Size | Gaps in Research Methodology |
|---|---|---|
| Mordor Intelligence | USD 9.37 B (2026) | |
| Global Consultancy A | USD 42.60 B (2023) | This estimate appears to include a wider definition that can roll up sensor-enabled medical devices and related systems, which inflates value versus component and module level sensor revenue, and it also uses a higher growth curve into 2030. |
| Research Platform B | USD 2.22 B (2024) | This estimate likely narrows the scope to a smaller set of device classes or sensing types, and it can also apply conservative penetration and pricing assumptions, thereby reducing the total market value versus broader coverage models. |
The table shows that the spread is mainly explained by scope boundaries and how the demand pool is constructed, not by small math differences. When the model is anchored to clear device usage signals, applies realistic sensor content rules, and sanity-checks ASP movement with interviews, the outcome is easier to replicate and defend during planning discussions.


Key Questions Answered in the Report
How large is the medical sensors market today?
The market stands at USD 9.37 billion in 2026 and is set to reach USD 14.84 billion by 2031, registering a 9.62% CAGR.
Which sensor type generates the highest revenue?
Biosensors lead with 43.35% share, supported by continuous glucose monitoring and cardiac diagnostics growth.
What is the fastest-growing deployment mode?
Implantable sensors exhibit a 13.05% CAGR as wireless power and biocompatible materials mature.
Why is Asia-Pacific the fastest-growing region for medical sensors?
National procurement of home-use SpO₂ wearables in China and advanced sterilizable sensor demand in Japan drive a 13.92% regional CAGR.
How are regulations shaping product design in Europe?
The EU Medical Device Regulation mandates full traceability, prompting manufacturers to embed digital identifiers even in disposable sensors.
What competitive strategies are market leaders adopting?
Firms pursue partnerships that merge sensor hardware with AI analytics platforms, creating integrated ecosystems that improve patient outcomes and generate recurring revenues.
Page last updated on:






