
Medical Radiation Shielding Market Size and Share
Market Overview
| Study Period | 2020 - 2031 |
|---|---|
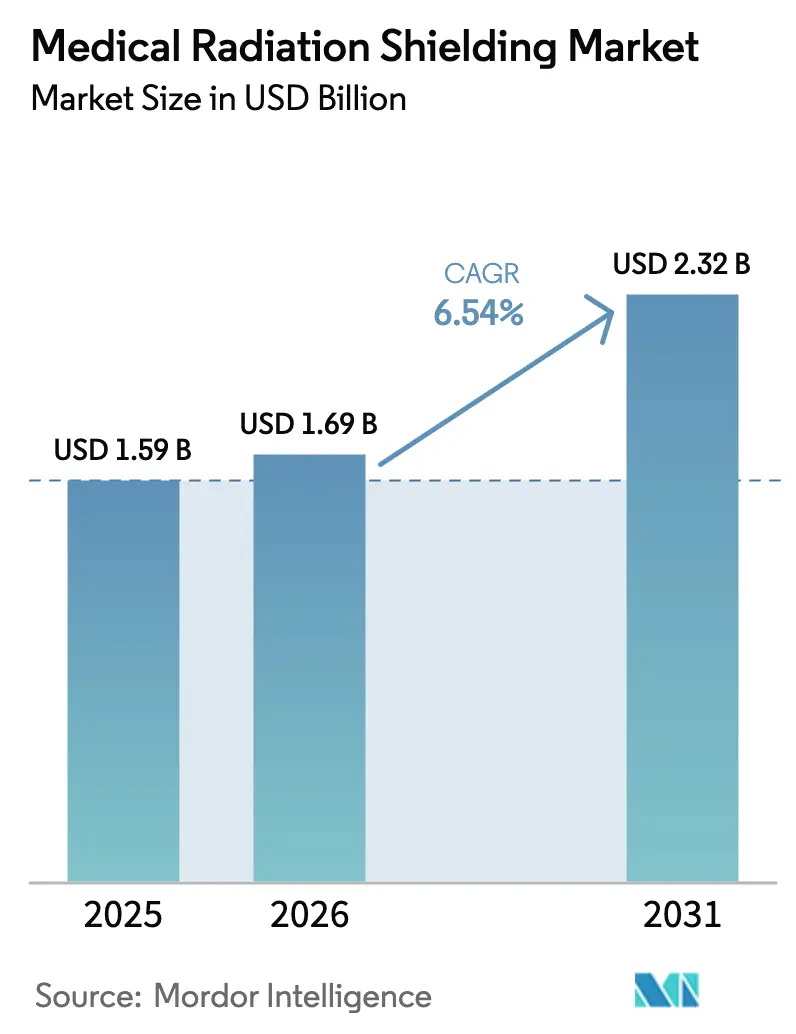
| Market Size (2026) | USD 1.69 Billion |
| Market Size (2031) | USD 2.32 Billion |
| Growth Rate (2026 - 2031) | 6.54 % |
| Fastest Growing Market | Asia-Pacific |
| Largest Market | North America |
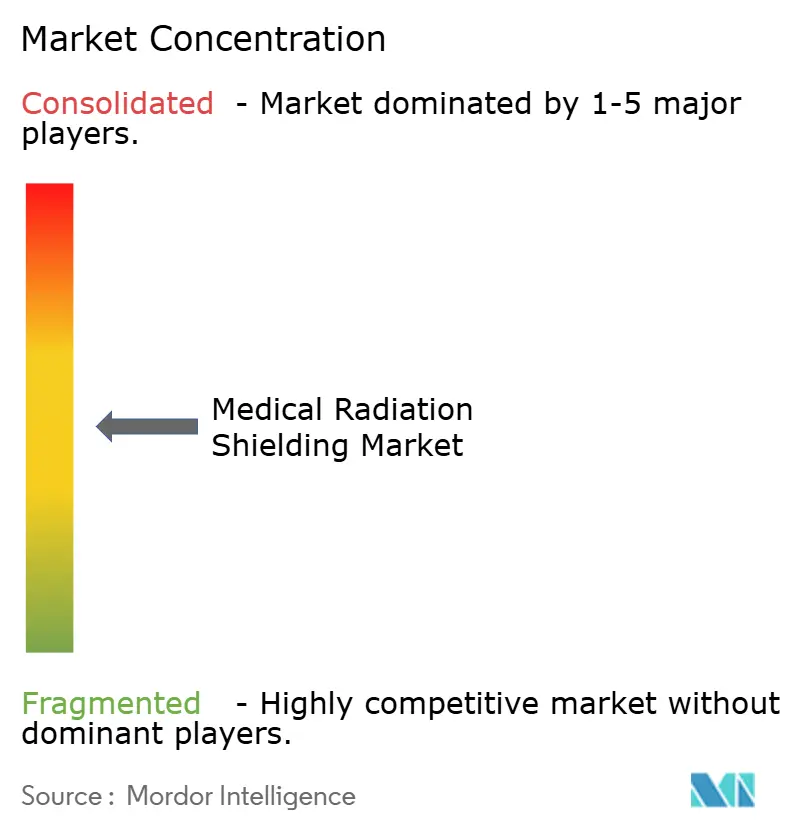
| Market Concentration | Medium |
Major Players *Disclaimer: Major Players sorted in no particular order Image © Mordor Intelligence. Reuse requires attribution under CC BY 4.0. | |
Medical Radiation Shielding Market Analysis by Mordor Intelligence
The Medical Radiation Shielding Market size is projected to be USD 1.59 billion in 2025, USD 1.69 billion in 2026, and reach USD 2.32 billion by 2031, growing at a CAGR of 6.54% from 2026 to 2031.
Demand tracks the rising global cancer burden, faster adoption of proton and heavy ion therapy, and the build-out of radiopharmaceutical plants in the Asia-Pacific. Non-lead composites are gaining traction because they cut weight, lower disposal risk, and enable quick retrofits of legacy vaults. Vertically integrated suppliers that recycle lead and smelt tungsten in-house are softening margin pressure from volatile metals prices. Turnkey contracts that bundle shielding, civil works, and regulatory filings are now the preferred procurement route for new particle therapy centers, especially in China and India.
Key Report Takeaways
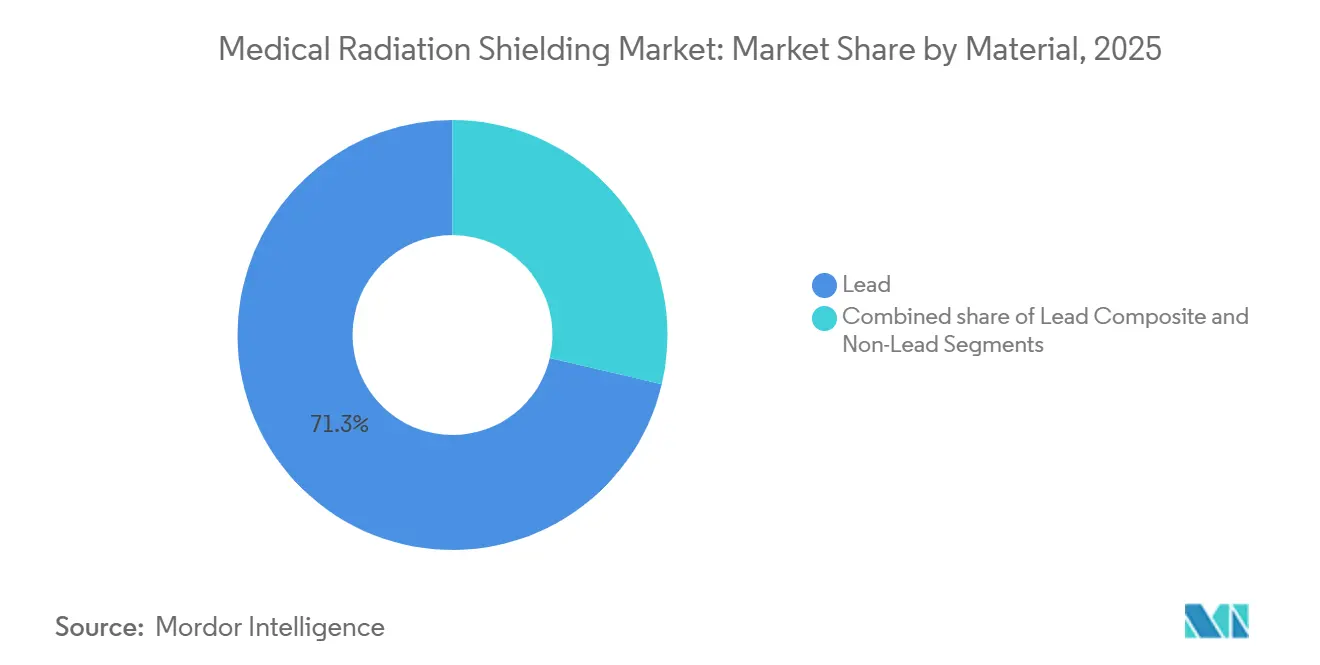
- By material, lead retained 71.32% of the medical radiation shielding market share in 2025, while non-lead composites are forecast to expand at an 8.35% CAGR to 2031.
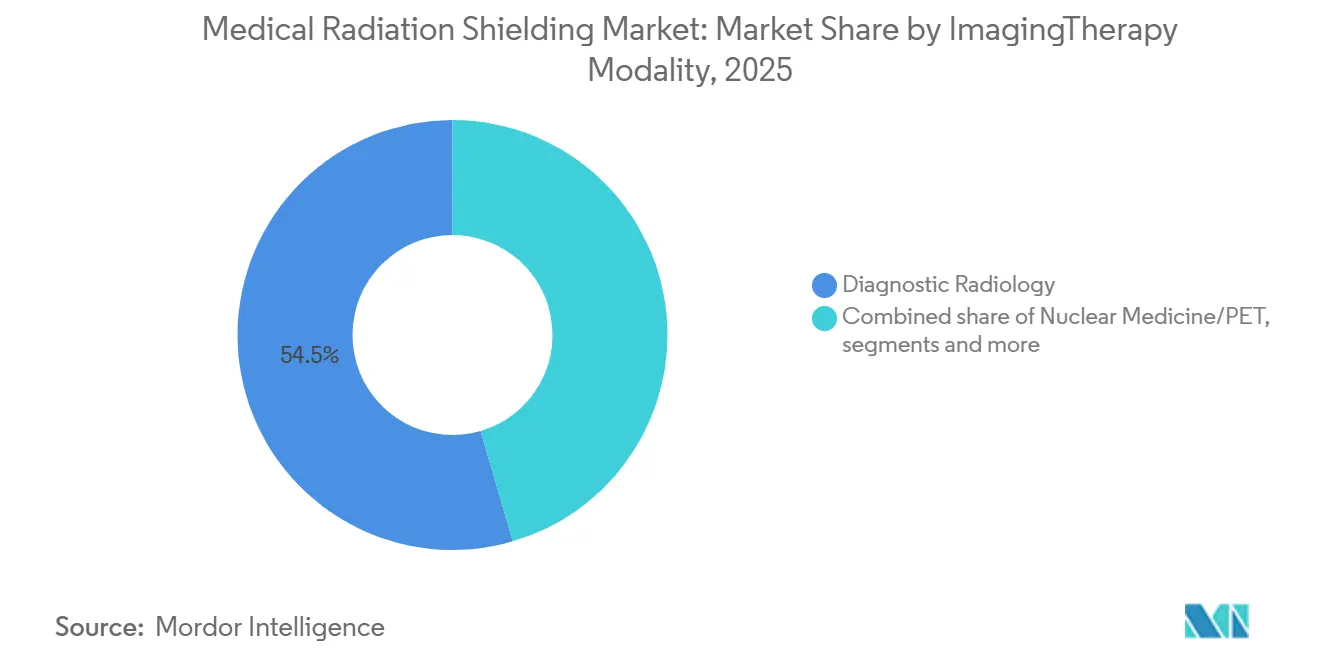
- By imaging and therapy modality, diagnostic radiology led with a 54.53% revenue share in 2025; proton and heavy ion therapy are projected to post the fastest growth rate of 9.51% through 2031.
- By end user, hospitals accounted for 61.56% of the medical radiation shielding market size in 2025, and ambulatory surgery centers are projected to grow at a 9.84% CAGR from 2026 to 2031.
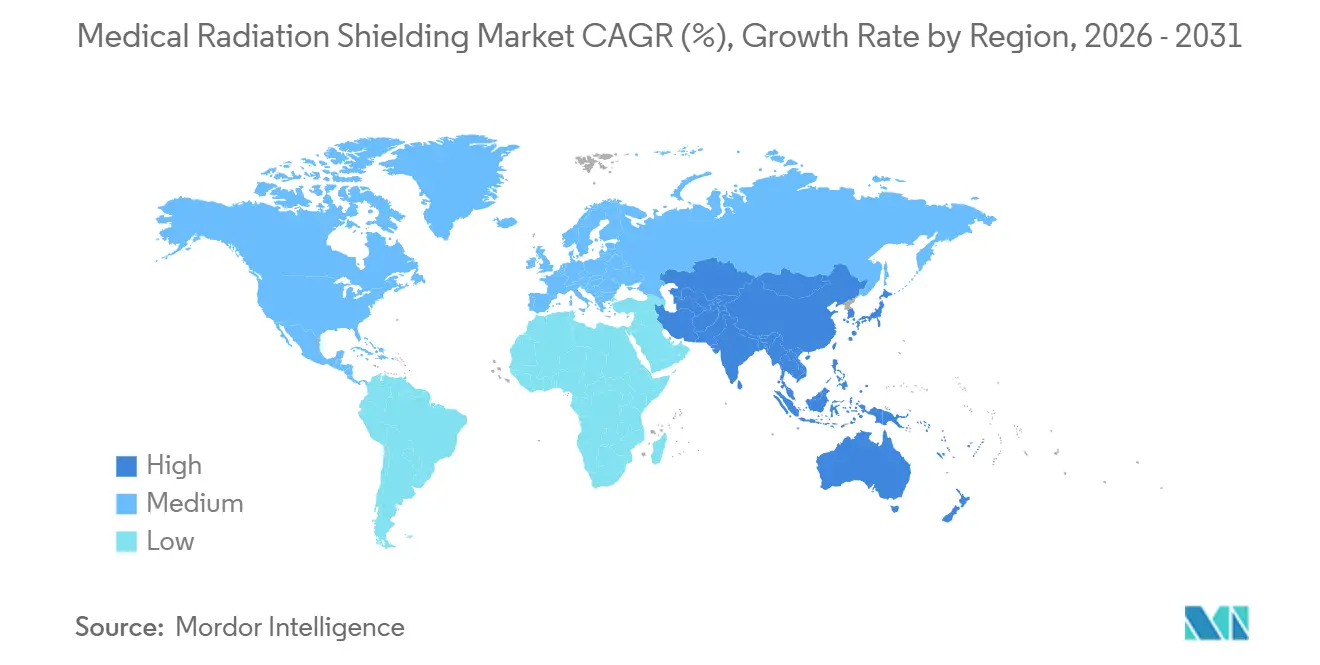
- By geography, North America captured 35.65% of the 2025 revenue, while the Asia-Pacific region is projected to advance at a 7.23% CAGR through 2031.
Note: Market size and forecast figures in this report are generated using Mordor Intelligence’s proprietary estimation framework, updated with the latest available data and insights as of January 2026.
Market Trends and Insights
Drivers Impact Analysis of Medical Radiation Shielding Market*
| Driver | (~) % Impact on CAGR Forecast | Geographic Relevance | Impact Timeline |
|---|---|---|---|
| Rising Global Cancer Incidence | +1.2% | Global, acute in Asia-Pacific and Sub-Saharan Africa | Medium term (2-4 years) |
| Adoption of Advanced Radiation Modalities | +0.8% | North America, Europe, Japan, South Korea, Singapore | Long term (≥ 4 years) |
| Expansion of Nuclear Medicine Capacity | +1.1% | North America, Europe, China, India | Medium term (2-4 years) |
| Government-Funded Oncology Programs | +0.9% | Asia-Pacific, Middle East & Africa, Latin America | Long term (≥ 4 years) |
| Uptake of Intraoperative Radiation Therapy | +0.7% | North America, Western Europe, urban Asia-Pacific | Short term (≤ 2 years) |
| 3D-Printed Polymer–Tungsten Retrofits | +0.6% | Global, early in Eastern Europe and Southeast Asia | Short term (≤ 2 years) |
| Source: Mordor Intelligence | |||
Rising Global Cancer Incidence Elevating Radiotherapy and Imaging Installations
Cancer remains the second-leading cause of death worldwide, and 50-60% of patients need radiotherapy during treatment[1]. Twenty-three Sub-Saharan countries still lack radiotherapy devices, so the IAEA's Rays of Hope program is deploying linear accelerators and cobalt-60 units in these regions. Each new vault requires 2-4 mm of lead-equivalent shielding for walls, ceilings, and floors, which necessitates several metric tons of material. The growing adoption of CT and fluoroscopy in emerging markets further accelerates shielding demand for technician protection. Continued screening initiatives and universal coverage pledges are maintaining a robust global pipeline of shielding projects, which is expected to crest in the next four years.
Adoption of Advanced Radiation Modalities Necessitating Enhanced Shielding
The number of global proton therapy centers rose to 114 by 2025, with an additional 40 centers slated for completion by 2030. These facilities require 3 m neutron-attenuating concrete walls complemented by borated polyethylene layers. Image-guided and intensity-modulated linear accelerators also require tighter control over scatter radiation, driving the need for retrofits of existing bunkers. Vendors such as Hitachi bundle vault design with equipment supply, compressing schedules but pushing project costs over USD 100 million for a two-gantry proton suite[2]. Integrated suppliers that manage civil works, shielding physics, and approvals are positioned to win these long-cycle contracts.
Expansion of Nuclear Medicine and Radiopharmaceutical Manufacturing
Targeted radionuclide therapies for neuroendocrine and prostate cancers are moving to mainstream protocols. Novartis added hot cells with tungsten-lined glove boxes to its Indianapolis plant, incurring a USD 120 million investment in 2025. Orano Med has earmarked EUR 250 million for thorium and lead isotope production, requiring modular, shielded labs. The EU also approved EUR 2 billion for the Pallas reactor, which will need extensive containment shielding. Facilities must incorporate lead-glass windows, HEPA-filtered HVAC systems, and dosimetry sensors, thereby opening the scope for turnkey shielding packages.
Government-Funded Oncology Infrastructure in Emerging Markets
India budgeted USD 1.5 billion through 2026 to build 20 tertiary cancer centers. China subsidizes up to 60% of radiotherapy equipment and construction, lifting installed machines above 3,000 by 2024. These programs favor prefabricated shielding panels that can be installed in weeks rather than months, enabling rapid capacity expansion. Local fabricators that partner with global experts to meet IAEA codes are gaining share, while foreign suppliers compete on engineering certification and fast installation.
Restraints Impact Analysis of Medical Radiation Shielding Market*
| Restraint | (~) % Impact on CAGR Forecast | Geographic Relevance | Impact Timeline |
|---|---|---|---|
| High capital expenditure for shielded facilities and bunker construction | -1.3% | Global, with acute impact in Sub-Saharan Africa, South Asia, and Latin America | Short term (≤ 2 years) |
| Volatile prices of lead, tungsten, and non-lead alloys | -0.9% | Global, pronounced in Asia-Pacific and Europe | Medium term (2-4 years) |
| Environmental liability from lead-contaminated waste streams | -0.7% | North America and Europe under strict disposal regulations; emerging relevance Asia-Pacific | Medium term (2-4 years) |
| Limited availability of certified radiation shielding engineers in developing regions | -0.6% | Sub-Saharan Africa, South Asia, and parts of Latin America | Short term (≤ 2 years) |
| Source: Mordor Intelligence | |||
High Capital Expenditure for Shielded Facilities and Bunker Construction
External-beam vaults cost USD 1.5–3 million each, while proton centers exceed USD 100 million, with shielding accounting for up to 30% of the expenditure. Many public hospitals in low-income regions rely on annual appropriations, stretching procurement cycles beyond 18 months. The U.S. EPA classifies waste as hazardous, adding USD 200–400 per metric ton in disposal fees and deterring retrofits[3]. Prefabricated barriers and 3D-printed composites offer relief but still need code validation, prolonging decision timelines in cash-constrained markets.
Volatile Prices of Lead, Tungsten, and Non-Lead Alloys
Lead averaged USD 2,100–2,200 per metric ton in 2025, while tungsten hovered between USD 270 and USD 330 per metric ton. Export quotas from China and Vietnam amplified price swings, squeezing suppliers locked into fixed-price contracts. Bismuth traded around USD 6 per pound, reflecting tight refining capacity. Fabricators with recycling loops or their own smelters are partially insulated, but smaller regional players often absorb cost spikes, hampering R&D for non-lead solutions.
*Our forecasts treat driver/restraint impacts as directional, not additive. The impact forecasts reflect baseline growth, mix effects, and variable interactions.
Segment Analysis
By Material: Non-Lead Composites Gain Ground on Retrofit and Environmental Advantages
Lead remained dominant in 2025, accounting for 71.32% of revenues; however, the medical radiation shielding market size for non-lead composites is forecast to grow at an 8.35% CAGR through 2031. California Proposition 65 audits and the EU Restriction of Hazardous Substances directive intensified the shift. Tungsten-polymer panels produced through 3D printing cut weight by 30-40% and speed up installation. Borated polyethylene demand is rising alongside particle therapy projects, because it attenuates fast neutrons. Suppliers that deliver hybrid portfolios lead for high-attenuation walls and non-lead for weight-sensitive retrofits capture cross-segment opportunities.
The portability of polymer-tungsten tiles appeals to imaging chains upgrading multiple sites. Hospitals in seismic zones welcome lighter walls that reduce the need for structural steel. Recycling programs that reclaim lead from decommissioned vaults provide input for cast-lead bricks used in new builds, easing disposal concerns. These trends collectively erode lead’s share while opening space for specialty fabricators fluent in both metal casting and additive manufacturing.
By Imaging/Therapy Modality: Proton Therapy Drives Premium Shielding Demand
Diagnostic radiology accounted for 54.53% of 2025 revenue, but proton and heavy ion therapy are expected to expand at a 9.51% CAGR, outpacing every other modality. Each proton gantry requires 3 m of thick concrete, plus borated polyethylene, pushing project budgets well above those of traditional linac rooms. The medical radiation shielding market size for particle therapy suites is therefore set to swell, even though the absolute number of centers remains modest.
Nuclear medicine plants need glove boxes, hot cells, and lead-glass windows, creating steady demand as targeted radionuclide therapies are commercialized. External-beam linacs still account for the most extensive installed base, particularly in emerging regions upgrading from cobalt-60 units. Intraoperative radiation therapy systems are driving growth in modular barriers, benefiting firms that can fabricate custom panels in days rather than weeks.
By End User: Ambulatory Surgery Centers Embrace Compact IORT Solutions
Hospitals accounted for 61.56% of 2025 revenue, yet ambulatory surgery centers are forecasted to grow at a rate of 9.84% yearly, the highest among end users. Lightweight 1-2 mm panels let outpatient facilities add radiation capability without significant structural changes, shortening build times. The medical radiation shielding market share for ambulatory centers is expected to rise steadily through 2031.
Diagnostic imaging chains deploy mobile CT trailers that need removable lead curtains, driving a niche for snap-fit shielding. Veterinary hospitals and research labs form a smaller but consistent customer base, as regulators enforce occupational exposure limits. Vendors supplying pre-engineered kits sized to standard operating rooms are improving margins through volume production. Hospitals still anchor absolute demand, but growth momentum is clearly shifting to the outpatient space.
Geography Analysis
North America Medical Radiation Shielding Market
North America generated 35.65% of 2025 revenue, buoyed by high healthcare spending and stringent FDA oversight that mandates certified shielding materials. Replacement cycles for aging vaults sustain projects in urban markets, while proton therapy expansions in Connecticut and Tampa require premium neutron protection. EPA waste rules are accelerating the adoption of non-lead alternatives, encouraging closed-loop recycling.
APAC Medical Radiation Shielding Market
The Asia-Pacific region is the growth engine, with a projected 7.23% CAGR through 2031, driven by public-sector build-outs in China and India. China surpassed 3,000 radiotherapy machines in 2024, thanks to provincial subsidies that cover up to 60% of the costs. India’s USD 1.5 billion cancer-center program prefers modular panels to compress timelines. Private chains, such as Apollo Hospitals, are adding proton centers in Chennai and Kolkata, thereby amplifying demand for neutron-grade concrete.
EMEA and South America Medical Radiation Shielding Market
Europe emphasizes lead-free solutions under the Restriction of Hazardous Substances (RoHS) directive, spurring research and development in bismuth and tungsten composites. The Middle East funds centers of excellence in the United Arab Emirates and Saudi Arabia to stem the flow of outbound medical tourism. Sub-Saharan Africa remains underserved, but the IAEA Rays of Hope initiative is opening a multi-year pipeline of external-beam vaults. South America’s first proton therapy unit commenced operations in Buenos Aires in 2025, signaling a rising demand for premium shielding.
Regulatory Landscape
Medical radiation shielding demand is tied to radiation-safety and radiation-protection compliance frameworks used to specify imaging and therapy room requirements. In the United States, radiation-emitting electronic products fall under the Federal Food, Drug, and Cosmetic Act (Sections 531-542) and implementing requirements in 21 CFR Subchapter J. Cabinet X-ray systems must meet the performance standard in 21 CFR 1020.40, including limits on radiation emission (for example, 0.5 mR in one hour measured at 5 cm). These requirements feed into procurement specifications for structural shielding (walls, doors, lead glass, barriers) and the documentation practices used for testing, labeling, and records and reports, which in turn affect timelines for new rooms and retrofits.
Across other major markets, harmonized standards and stricter technical documentation shape acceptance criteria for radiation-protection features. The EU Medical Device Regulation (EU) 2017/745 requires ionizing-radiation devices to be designed to reduce patient and user exposure as far as possible, raising the bar for technical files and post-market obligations that cascade into room design, shielding calculations, and validation packages. For diagnostic X-ray equipment, IEC collateral and particular standards remain key anchors, including IEC 60601-1-3:2008 with AMD1:2013 and AMD2:2021 for radiation protection, and IEC 60601-2-54:2022 for radiography and radioscopy. Suppliers and installers typically align shielding specifications and acceptance testing with these recognized requirements to support site licensing and inspection readiness.
Competitive Landscape
The top five vendors control roughly 40% of global revenue, indicating moderate concentration. Mirion Technologies leveraged its USD 800 million 2024 revenue base to cross-sell shielding with radiation detectors. Strategic alliances between barrier suppliers and linac or cyclotron OEMs are now essential for securing turnkey contracts, especially in regions building first-generation particle centers. Engineering certification, rapid installation, and compliance with IEC codes are the primary buying criteria as regulators tighten lead-waste rules under the U.S. Resource Conservation and Recovery Act.
3D-printed polymer–tungsten panels present white-space growth. Regional specialists in Eastern Europe and Southeast Asia undercut Western pricing by 20-30%, though they still face capacity and standards hurdles. Vendors incorporating cloud-based workflow tools that auto-populate licensing forms and stream dosimetry data to inspectors finish projects weeks faster than rivals, giving them an execution edge. Market momentum is clearly shifting from pure material supply to integrated project delivery, favoring players that combine materials engineering with regulatory expertise.
Medical Radiation Shielding Industry Leaders
-
Nelco Inc
-
Marshield
-
Radiation Protection Products Inc
-
Gaven Industries Inc
-
Esco Technologies Inc.
- *Disclaimer: Major Players sorted in no particular order
Medical Radiation Shielding Market Companies Covered in this Report
- A&L Shielding
- Alpha Source Group
- AmRay Group
- Barrier Technologies
- ETS-Lindgren
- Esco Technologies Inc.
- Gaven Industries
- Global Partners In Shielding Inc.
- JL Goslar GmbH
- Kemper Medical
- Lite Tech Inc.
- MarShield
- MAVIG GmbH
- Mirion Technologies Inc.
- Nelco
- Radiation Protection Products
- Ray-Bar Engineering
- Shandong EM Radiation Protection Materials
- Veritas Medical Solutions
- Wardray Premise Ltd.
Market Opportunities and Future Outlook
Turnkey delivery and faster retrofits are a key whitespace as hospitals, imaging chains, and ambulatory centers add or modernize CT, fluoroscopy, nuclear medicine rooms, and IORT suites while trying to compress construction schedules. Procurement is moving toward bundled scope (shielding materials, doors and lead glass, civil works coordination, and documentation for licensing and inspection), which creates room for vendors that can standardize designs across multi-site rollouts and reduce disruption during replacement cycles. Lead Glass Pro’s June 2026 expansion of turn-key X-ray room installation across 26 US states, along with its March 2026 investment in expanded manufacturing capacity using advanced CNC milling and fiber laser cutting, points to supply-side alignment with project-based demand for lead glass, barriers, and room packages.
Material substitution and design optimization also offer near-term lanes tied to environmental and operational constraints already visible in the market. Non-lead composites (polymer-tungsten, borated polyethylene, and other lead-free composites) help reduce disposal risk and weight pressure in legacy vault retrofits, and the market context highlights rapid uptake of 3D-printed polymer-tungsten retrofits for quicker installation. In parallel, the 2026 research activity noted in the market around lead-free composite attenuation structures and computational optimization, including machine-learning-assisted shielding design for diagnostic applications, supports a pipeline of new formulations and design tools that can be commercialized into lighter panels, modular barriers, and standardized room kits. This direction is especially relevant for outpatient settings and retrofit-heavy geographies where structural loading and downtime drive buying decisions.
Recent Industry Developments in Medical Radiation Shielding Market
- June 2026: Lead Glass Pro expanded turn-key X-ray room installation services to 26 US states, scaling its on-site execution footprint for imaging construction and retrofit projects. The update supports faster, standardized deployments of room shielding packages that combine lead glass, barriers, and installation coordination across multi-site healthcare customers.
- April 2025: Carl Zeiss Meditec received FDA 510(k) clearance for an upgraded Intrabeam IORT system designed around 1-2 mm lead-equivalent wall protection requirements. Smaller shielding footprints reduce build complexity for hospitals and ambulatory surgery centers, improving feasibility for adding IORT capability in space-constrained facilities.
- April 2024: NanoRay highlighted progress in transmission X-ray tube technology, reporting radiation reduction and efficiency gains that improve imaging performance and operating characteristics. As dose-management features and new tube architectures diffuse into clinical systems, shielding design and retrofit decisions increasingly align with updated room use patterns and equipment configurations.
Medical Radiation Shielding Market Report Scope and Research Methodology
Market Definition and Coverage
This market covers products and materials used to reduce exposure to ionizing radiation in medical settings, mainly around diagnostic imaging rooms, nuclear medicine areas, and radiotherapy bunkers. It includes installed shielding and related solutions bought by healthcare facilities for new build, retrofit, and replacement needs.
Scope exclusions: the sizing excludes personal protective apparel as well as non-medical industrial shielding and radiation detection or dosimetry equipment.
Segments Covered in This Report
- By Material
- Lead
- Lead Composite
- Non-Lead (Bismuth, Tungsten, Antimony, Borated PE)
- By Imaging / Therapy Modality
- Diagnostic Radiology (X-ray, CT, Fluoroscopy)
- Nuclear Medicine / PET
- External Beam Radiation Therapy (LINAC, IMRT, IGRT)
- Proton & Heavy Ion Therapy
- By End User
- Hospitals
- Diagnostic Imaging Centers
- Ambulatory Surgery Centers
- Other End Users
- Geography
- North America
- United States
- Canada
- Mexico
- Europe
- Germany
- United Kingdom
- France
- Italy
- Spain
- Rest Of Europe
- Asia-Pacific
- China
- Japan
- India
- South Korea
- Australia
- Rest Of Asia-Pacific
- Middle-East And Africa
- GCC
- South Africa
- Rest Of Middle East And Africa
- South America
- Brazil
- Argentina
- Rest Of South America
- North America
Data Sources, Market Sizing, and Validation
Desk Research
For desk research, we first map the demand pool by linking radiation exposure rules and facility build activity to the installed base of imaging and therapy rooms. Public sources such as the US FDA device databases, US NRC guidance, CDC healthcare statistics, and international bodies such as IAEA references help keep definitions consistent and prevent mixing industrial and medical use cases.
We also review sources such as peer reviewed papers on shielding design and attenuation, hospital construction and capital spend updates, and company filings and investor presentations for product mix cues. When needed, paid subscriptions focused on company financials and intelligence, patent databases, and shipment level import or export data are used to cross-check material flows and supplier footprints. The desk sources listed above are illustrative only, and we reviewed many other public documents and datasets to support collection, validation, and clarification.
Primary Interviews and Surveys
Primary interviews and survey responses are used to confirm what gets purchased in real projects (new rooms, upgrades, and compliance-driven retrofits) and to test pricing and specification assumptions across lead, lead composite, and non-lead options. We speak with manufacturers, distributors, installers, shielding designers, and hospital and imaging center stakeholders across major regions so gaps from desk research can be closed and key assumptions re-checked before finalizing results.
Distribution of primary research fieldwork respondents
| Company type | Respondent position | Region |
|---|---|---|
| Top tier: 36% | CXOs: 15% | APAC: 51% |
| Mid tier: 43% | Functional/Unit leaders: 27% | EMEA: 30% |
| Smaller Players: 21% | Managers: 58% | Americas: 19% |
Market-Sizing & Forecasting
Sizing starts from a top-down build that reconstructs the addressable spend by modality-linked room counts and project activity, and then applies typical shielding configurations by room type. Diagnostic radiology, nuclear medicine, and external beam therapy are treated separately because their shielding thickness, materials, and install intensity differ, and that difference affects how spend is converted to value.
To keep the model grounded, a few practical inputs are tracked and updated each cycle, including imaging and radiotherapy procedure volume signals, additions and replacements of major imaging equipment, hospital construction and refurbishment trends, material choice shifts toward non-lead options, and typical price ranges for key items such as lead-lined doors, lead glass, curtains, and shielding panels. Where the desk view is thin, we use conservative ranges and narrow them based on interview feedback.
Results are corroborated with selective bottom-up approximations, including sampled project bills of quantities, installer channel checks, and volume-by-price sanity checks for high-frequency items. Totals are adjusted if the implied spend looks inconsistent. For forecasting, scenario analysis is used around procedure growth and facility expansion, and assumptions on material mix and pricing are updated based on what experts expect to change over the next few years.
Data Validation & Update Cycle
Validation is done through multiple checks so the final numbers do not rely on any single data point. Model outputs are compared with independent signals such as room build activity, equipment additions, and material demand cues, and then unusual jumps are reviewed until a clear explanation is found.
Before sign-off, the work is reviewed by another analyst and key assumptions are re-tested against interview notes, especially where pricing, material mix, or modality exposure could shift totals. Reports are refreshed annually, and interim updates are made when material events occur, such as major regulatory changes or sharp shifts in construction activity. Right before delivery, a fresh pass is completed so clients receive the most current view available.
Mordor Intelligence's Medical Radiation Shielding Market Size Versus Other Published Estimates
Published market values for medical radiation shielding can look different even when they are describing a similar end use, since each publisher makes its own choices on what products are counted and which year is treated as the base. Differences also show up when one model leans more on equipment and room activity indicators, and another leans more on broad product buckets and averaged pricing.
Key gap drivers in this market usually come from how structural shielding (doors, lead glass, barriers, curtains, panels, and room-level solutions) is treated versus personal protective apparel, and from whether MRI-related shielding is mixed in with ionizing radiation categories. Currency timing and the way price changes are carried forward year to year also matter, especially when lead and alternative material costs move quickly.
Benchmark comparison
| Source | Market Size | Gaps in Research Methodology |
|---|---|---|
| Mordor Intelligence | USD 1.59 B (2025) | |
| Industry Research Publisher A | USD 1.55 B (2024) | The estimate is anchored to an earlier base year and it also appears to include a wider set of product lines, including protective apparel, which can lift totals when procedure volumes are rising. |
| Industry Research Publisher B | USD 1.67 B (2025) | The published figure uses a broader definition that can blend adjacent shielding categories and different timing for price updates, which can shift the same-year value when material mix assumptions differ. |
The spread in figures is mostly explained by scope choices and how pricing and mix are carried forward between years, and the table makes that visible. Some estimates fold in personal protective garments or adjacent categories, then the medical room build signal becomes less direct. In Mordor Intelligence, the market total is limited to installed medical shielding solutions for diagnostic radiology, nuclear medicine, and radiotherapy settings, and protective apparel is kept out so the value stays tied to room and project activity.
Key Questions Answered in the Report
What is the forecast value of the medical radiation shielding market in 2031?
The market is expected to reach USD 2.32 billion by 2031, growing at a 6.54% CAGR.
Which material segment is growing the fastest?
Non-lead composites, especially polymer-tungsten and borated polyethylene blends, are projected to rise at an 8.35% CAGR through 2031.
Why is Asia-Pacific the fastest growing region?
Government-funded oncology programs in China and India, along with private proton therapy investments, are driving a projected 7.23% CAGR in the region.
How are 3D-printed shields impacting demand?
Additive manufacturing lowers weight and installation labor, reducing retrofit costs by up to 25% and accelerating adoption in cost-sensitive markets.
What is the main restraint for new shielding projects?
High capital expenditure, with vaults costing USD 1.5-3 million and proton centers exceeding USD 100 million, remains the primary barrier.
Which end-user segment is expanding the quickest?
Ambulatory surgery centers, fueled by compact intraoperative radiation therapy systems, are advancing at a 9.84% CAGR through 2031.