
Medical Linear Accelerator Market Size and Share
Market Overview
| Study Period | 2020 - 2031 |
|---|---|
| Market Size (2026) | USD 4.55 Billion |
| Market Size (2031) | USD 6.69 Billion |
| Growth Rate (2026 - 2031) | 8.03 % |
| Fastest Growing Market | Asia Pacific |
| Largest Market | North America |
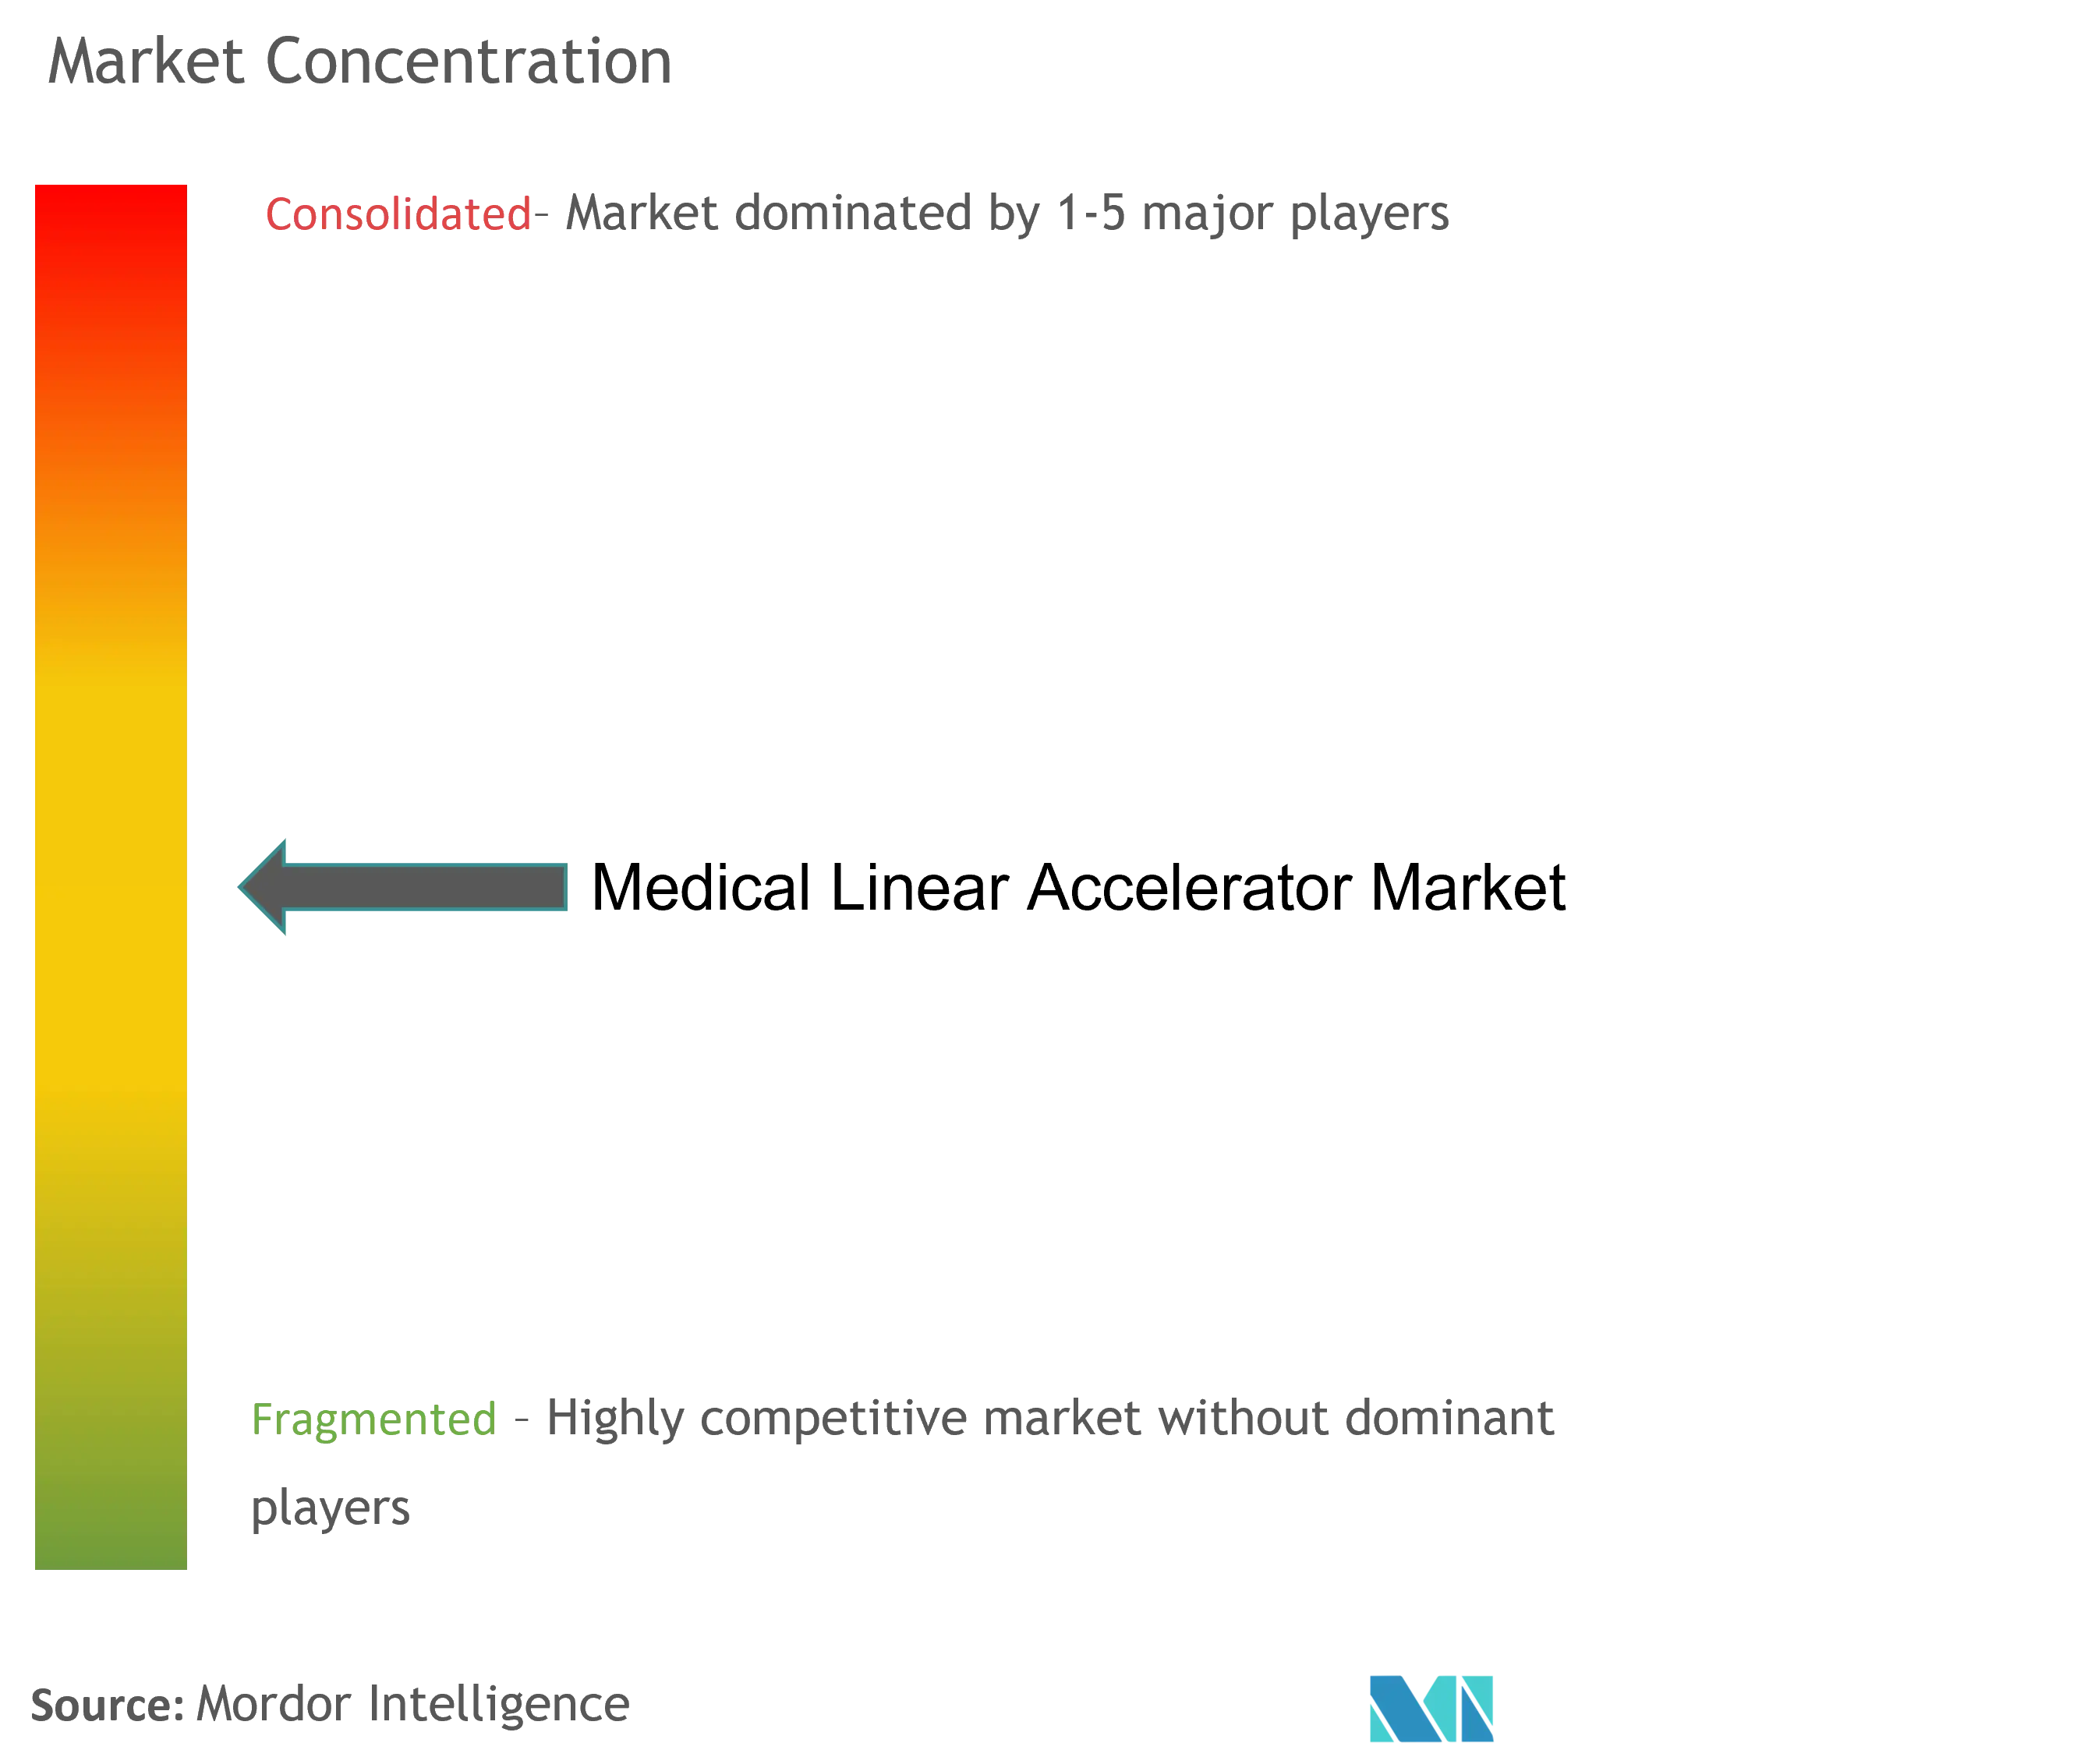
| Market Concentration | Low |
Major Players
*Disclaimer: Major Players sorted in no particular order Image © Mordor Intelligence. Reuse requires attribution under CC BY 4.0. |
|
Medical Linear Accelerator Market Analysis by Mordor Intelligence
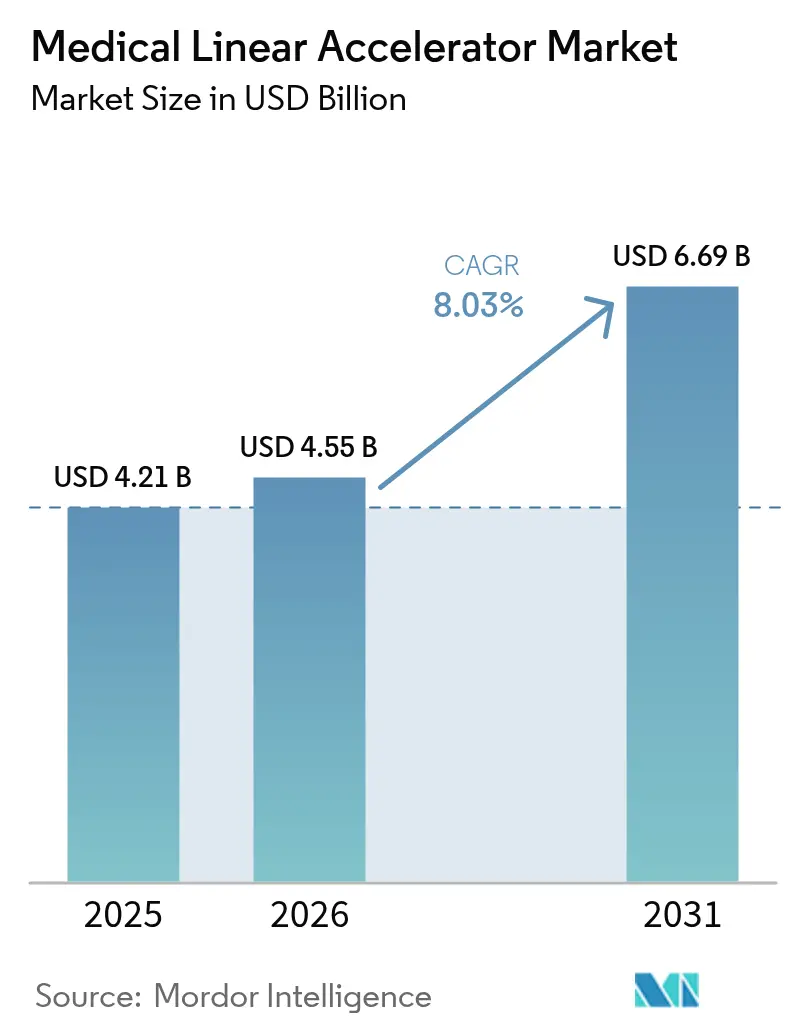
The medical linear accelerator market size was valued at USD 4.21 billion in 2025 and estimated to grow from USD 4.55 billion in 2026 to reach USD 6.69 billion by 2031, at a CAGR of 8.03% during the forecast period (2026-2031). Accelerated adoption of FLASH-RT, AI-driven adaptive systems and MRI-guided platforms is redefining treatment precision, shortening care pathways and broadening the addressable patient pool. Rising global cancer incidence, structured government replacement programs and the commercialization of next-generation LINACs continue to draw capital into the medical linear accelerator market, while disruptive entrants such as biology-guided radiotherapy vendors create competitive tension. At the same time, component-level supply constraints and workforce shortages temper near-term installation rates, pushing vendors to automate workflows and integrate service resiliency. Growth opportunities surface most visibly in Asia-Pacific, where greenfield installations outpace mature-market replacement cycles, and in decentralized care networks where compact LINACs bring high-end therapy into community settings.
Key Report Takeaways
By technology, Intensity-Modulated RT held 64.53% of medical linear accelerator market share in 2024, whereas Volumetric-Modulated Arc Therapy is advancing at an 8.19% CAGR through 2030.
By application, breast cancer captured 83.12% share of the medical linear accelerator market size in 2024, while lung cancer is projected to expand at an 8.78% CAGR between 2025 and 2030.
By energy type, High-Energy systems (6-15 MeV) commanded 72.56% share of the medical linear accelerator market size in 2024; Very-High Energy platforms are set to grow at a 9.01% CAGR to 2030.
By modality, Photon-based LINACs accounted for 71.23% medical linear accelerator market share in 2024, while MRI-guided systems pace ahead at an 8.96% CAGR through 2030.
North America led with 39.23% revenue contribution in 2024; Asia-Pacific registers the fastest regional CAGR at 9.23% to 2030
Note: Market size and forecast figures in this report are generated using Mordor Intelligence’s proprietary estimation framework, updated with the latest available data and insights as of 2026.
Market Trends and Insights
Drivers Impact Analysis of Medical Linear Accelerator Market*
| Restraint | (~) % Impact on CAGR Forecast | Geographic Relevance | Impact Timeline |
|---|---|---|---|
| Rising global cancer incidence | +1.8% | Global, with highest impact in Asia-Pacific and emerging markets | Long term (≥ 4 years) |
| Rapid adoption of AI-enabled adaptive radiotherapy | +1.2% | North America & EU, expanding to APAC | Medium term (2-4 years) |
| Government funding & equipment replacement cycles | +1.5% | Global, with concentrated impact in UK, Australia, Canada | Short term (≤ 2 years) |
| Expansion of radiotherapy capacity in emerging economies | +1.0% | APAC core, spill-over to MEA and Latin America | Long term (≥ 4 years) |
| Commercialization of FLASH-RT-ready LINAC platforms | +0.9% | North America & EU, early adoption centers | Medium term (2-4 years) |
| Growth of compact LINACs for decentralized cancer care | +0.7% | Global, with emphasis on rural and underserved regions | Long term (≥ 4 years) |
| Source: Mordor Intelligence | |||
Rising Global Cancer Incidence
Global cancer cases are forecast to rise 42% by 2040, with 70% occurring in low- and middle-income nations where radiotherapy access remains severely constrained. Current penetration stands at roughly 380 LINACs for 1.2 billion Africans versus nearly 4,000 units for 331 million Americans, underscoring the inequity driving sustained demand in the medical linear accelerator market. International agencies now frame radiotherapy equipment as a core intervention, pivoting investment priorities in emerging economies from replacement to greenfield installation. This demographic pressure underpins the long-term expansion profile of the medical linear accelerator market.
Rapid Adoption of AI-Enabled Adaptive Radiotherapy
AI now automates contouring, planning and on-table adaptation, cutting planning times by up to 70% and helping offset workforce gaps. Systems such as Elekta’s adaptive CT-LINAC adjust beam parameters in real time to anatomical change, boosting dose conformity and sparing healthy tissue. These performance gains fuel premium-priced upgrades and reinforce the value proposition of next-generation platforms within the medical linear accelerator market.
Government Funding & Equipment Replacement Cycles
Targeted funding programs accelerate modernization. The UK’s GBP 130 million Radiotherapy Modernisation Fund replaced more than 100 aging systems and shaved GBP 17.1 million via bulk purchasing. Australia’s scheme reimburses up to USD 3 million per LINAC over 8-10 years, ensuring predictable market pull. These policies stabilize ordering cycles and stimulate early adoption of capabilities such as MRI guidance and FLASH readiness.
Expansion of Radiotherapy Capacity in Emerging Economies
China’s 2021–2035 medical isotope plan aims to double domestic scale, channeling budget toward LINAC procurement and isotope production. Taiwan now hosts eight proton-therapy centers for 23 million residents, illustrating advanced technology uptake yet highlighting residual wait-list pressures. Similar deficits in India and sub-Saharan Africa propel multi-year growth prospects for the medical linear accelerator market
Restraints Impact Analysis of Medical Linear Accelerator Market*
| Restraint | (~) % Impact on CAGR Forecast | Geographic Relevance | Impact Timeline |
|---|---|---|---|
| High capital & maintenance costs | -1.4% | Global, with highest impact in emerging markets and smaller facilities | Long term (≥ 4 years) |
| Shortage of trained radiation-oncology workforce | -1.1% | Global, with acute shortages in North America and Europe | Medium term (2-4 years) |
| Lengthy regulatory & reimbursement approval timelines | -0.8% | North America & EU, with spillover effects globally | Medium term (2-4 years) |
| RF-component supply-chain disruptions for klystrons | -0.6% | Global, with concentrated impact on high-energy systems | Short term (≤ 2 years) |
| Source: Mordor Intelligence | |||
High Capital & Maintenance Costs
Purchase prices exceed USD 4 million and annual service can top 10% of capital outlay, peaking near year seven. These economics limit early replacement appetite and complicate uptake in low-resource settings, restraining the medical linear accelerator market despite demonstrable clinical need.
Shortage of Trained Radiation-Oncology Workforce
Vacancy rates among radiation therapists climbed to 10.7% in 2022 and are projected to worsen, while dosimetrist shortfalls may reach 50 per year by 2035. Skills scarcity creates bottlenecks even where capital equipment is available, capping capacity expansion within the medical linear accelerator marke
*Our forecasts treat driver/restraint impacts as directional, not additive. The impact forecasts reflect baseline growth, mix effects, and variable interactions.
Medical Linear Accelerator Market Segment Analysis
By Technology:
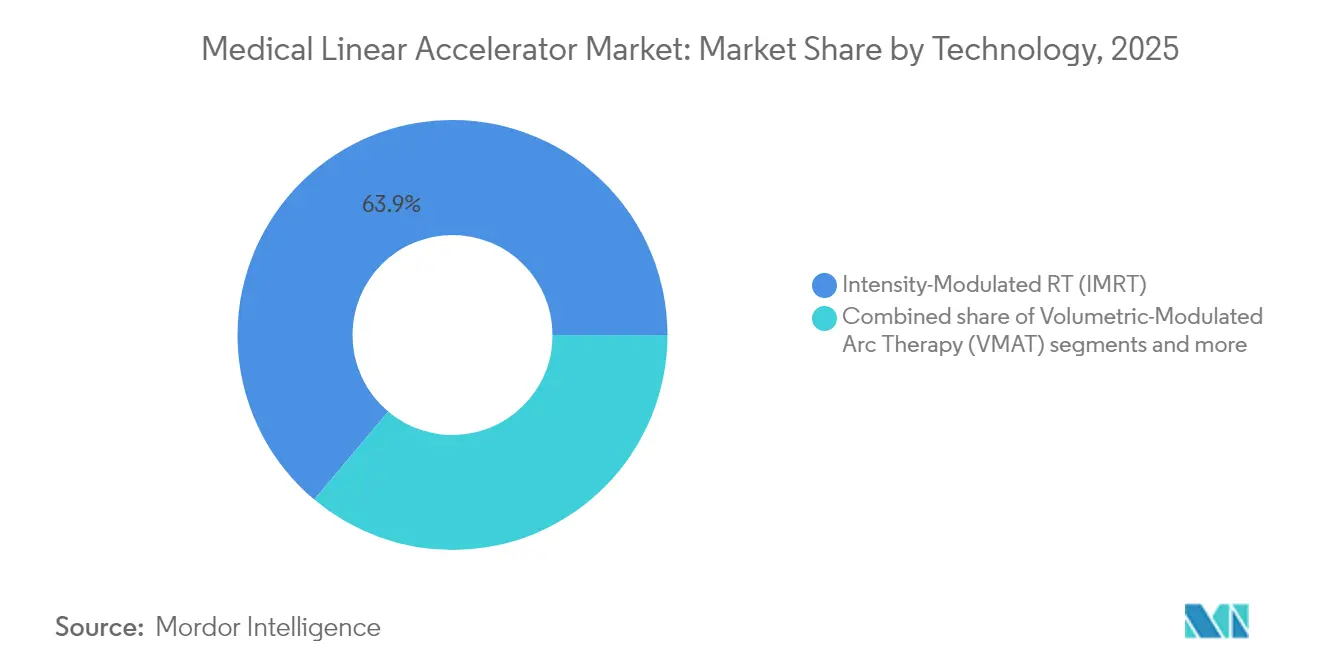
IMRT Dominance Faces VMAT AccelerationIntensity-Modulated RT led the medical linear accelerator market size with USD 2.69 billion in 2025. The segment benefits from entrenched reimbursement frameworks and robust clinical evidence, securing routine use across breast, prostate and head-and-neck protocols. Yet IMRT’s position is gradually eroded by VMAT, whose rotational dose delivery cuts treatment time to 2–4 minutes, easing throughput pressures. VMAT posted an 8.10% CAGR outlook to 2031, outpacing the overall medical linear accelerator market.
Emerging sub-technologies, including image-guided RT and stereotactic SRS/SBRT, grow on the strength of hypo-fractionated regimens that align with patient convenience and workforce optimization. Rapid progress in FLASH-RT and biology-guided systems represents the next curve, but regulatory and evidence hurdles keep their aggregate revenue share below 3% through 2025. Vendor portfolios thus straddle legacy volumes from IMRT while investing in VMAT software upgrades and adaptive workflows.


By Application:
Breast Cancer Leadership Challenged by Lung InnovationBreast cancer therapy represented USD 3.46 billion of the medical linear accelerator market size in 2025, fueled by high disease prevalence and standardized fractionation schedules. Deep-inspiration breath-hold techniques, now integrated into LINAC software, further entrench adoption. Nonetheless, lung cancer revenues climb fastest at an 8.69% CAGR, propelled by the need for ultra-precise dose sculpting around mobile thoracic structures.
Biology-guided radiotherapy, cleared for lung and bone applications, synchronizes beam delivery to tumor PET emissions, expanding re-irradiation and Stage IV indications. Prostate workflows leverage MRI guidance to spare surrounding organs, with adaptive planning reducing toxicity. Colorectal and head-and-neck treatments continue steady uptake as hypofractionation models gain payor acceptance. Across categories, reimbursement alignment increasingly prizes technologies that reduce total fractions, a trend that benefits the medical linear accelerator market.
By Energy Type:
High-Energy Systems Face Very-High DisruptionHigh-Energy (6-15 MeV) configurations retain 72.02% of the medical linear accelerator market share, preferred for their versatility across deep-seated tumors without excessive neutron contamination. Yet Very-High Energy Electron (VHEE) research demonstrates superior depth-dose profiles for FLASH, and commercial prototypes above 15 MeV project a 8.88% CAGR.
Manufacturers now offer multi-energy heads within single gantries, providing institutions a future-proof path as treatment protocols evolve. Low-Energy units (<6 MeV) persist for superficial lesions and intra-operative settings, though their revenue share inches downward. Overall, energy flexibility becomes a selling point, especially in capital-constrained health systems seeking long asset lifetimes inside the medical linear accelerator market.

By Modality:
Photon Dominance Meets MRI-Guided InnovationPhoton-based systems commanded 70.75% of 2025 revenue, covering the broadest spectrum of treatment sites and supporting established quality-assurance processes. MRI-guided LINACs, however, delivered an 8.84% CAGR, building momentum via real-time imaging that eliminates CT setup margins and enables daily adaptation.
Electron machines address niche uses such as total-skin therapy, while adaptive RT suites integrate AI engines with cone-beam CT to approximate MRI performance at lower cost. FLASH-ready designs emerge as vendors retrofit gun assemblies and beamlines to achieve dose-rates above 40 Gy/s. Institutions now weigh the incremental cost of MRI coils and shielding against toxicity reductions, shaping procurement criteria across the medical linear accelerator market.
Geography Analysis
Europe, North America and APAC Medical Linear Accelerator Market
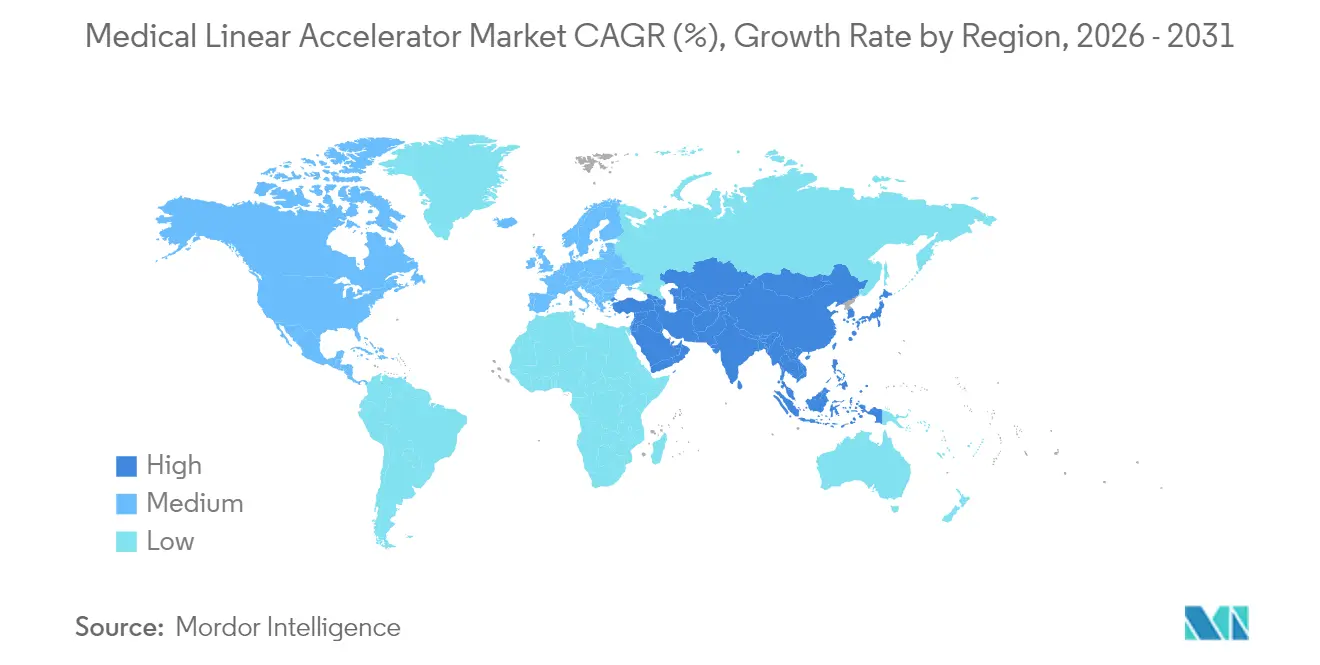
North America maintains 38.88% market share in 2025, supported by robust healthcare infrastructure, favorable reimbursement frameworks, and early adoption of breakthrough technologies including AI-powered adaptive systems and biology-guided radiotherapy. The region benefits from substantial government investments, exemplified by the UK's £70 million radiotherapy equipment program and Canada's equipment replacement initiatives that modernize aging LINAC fleets while expanding treatment capacity. However, Asia-Pacific emerges as the fastest-growing region at 9.08% CAGR through 2031, driven by healthcare infrastructure expansion, rising cancer incidence, and government-supported technology adoption programs.
EMEA, South America and APAC Medical Linear Accelerator Market
Europe demonstrates steady growth through coordinated healthcare modernization programs and regulatory harmonization initiatives that facilitate technology adoption across member states. The region's emphasis on MRI-guided systems and adaptive radiotherapy reflects its leadership in precision oncology research and clinical implementation. South America shows emerging potential through targeted investments in cancer care infrastructure, while Middle East and Africa regions experience growth driven by healthcare system development and international technology transfer programs. China's nuclear medicine expansion, supported by the 2021-2035 development plan targeting industry scale doubling, exemplifies Asia-Pacific's commitment to advanced cancer treatment capabilities. Taiwan's achievement of the world's highest particle therapy facility density demonstrates the region's technological sophistication, though operational challenges including patient waitlists highlight the need for continued capacity expansion to meet growing demand.

Regulatory Landscape
Medical linear accelerators are regulated as high-risk therapeutic radiation devices, with market access commonly gated by U.S. FDA classification and premarket pathways and by the EU Medical Device Regulation (MDR 2017/745). In the United States, medical linear accelerators fall under FDA device classification (21 CFR 892.5050, product code IWK) and are typically cleared via 510(k), reinforcing a substantial documentation and testing burden for new platforms and major software updates.
International consensus standards and jurisdiction-specific conformity assessments shape design and verification requirements. IEC 60601-2-1:2020 is a widely used particular standard for electron accelerators for radiotherapy, while the EU MDR raises the bar for clinical evidence, post-market surveillance, and software lifecycle controls compared with the prior MDD framework. Recent clearances highlight the regulatory cadence for next-generation systems: in January 2026, Elekta announced FDA 510(k) clearance for the Elekta Evo CT-Linac, and Varian secured FDA 510(k) clearance for Halcyon and Ethos Radiotherapy System version 5.0; in December 2025, Shinva reported MDR CE certification for its XHA600E and XHA1400 systems, signaling increasing compliance capability among China-based manufacturers.
Value Chain Analysis
The medical linear accelerator value chain begins with specialized upstream components and materials, including RF power sources (klystrons and magnetrons), accelerating structures and waveguides, high-Z beam-shaping materials (for example tungsten collimator leaves), and precision motion and imaging subsystems for modern IGRT and adaptive workflows. These inputs are characterized by tight tolerances, regulatory-grade traceability, and concentrated supplier bases for select subsystems, making procurement strategy and qualification cycles central to delivery timelines, particularly for high-energy configurations.
Midstream activities center on platform engineering, gantry and beamline integration, software development (planning, imaging reconstruction, adaptive functions), and extensive quality assurance and acceptance testing aligned with IEC and local regulatory requirements. Vendors increasingly internalize critical manufacturing steps to control lead times and quality, exemplified by Siemens Healthineers implementing a fully automated, digitized production line for tungsten collimator leaves at its Kemnath site in February 2025. Downstream, the chain is dominated by direct sales to hospitals and cancer centers, bunker readiness and installation services, commissioning support, and long-tail service and software contracts; spare parts logistics and field-service coverage directly influence uptime, while localized production and assembly has gained prominence in China as domestic suppliers such as United Imaging and Shinva expand presence alongside global incumbents.
Competitive Landscape
The top five vendors account for half of of global revenue, yielding a moderate concentration profile within the medical linear accelerator market. Siemens Healthineers’ 2024 acquisition of Varian created a portfolio spanning conventional LINACs to proton therapy, unlocking EUR 300 million in annual synergies and strengthening integrated service offerings. Elekta answers via AI-powered adaptive CT-LINAC innovations and sizable emerging-market tenders, while Accuray exploits a focused strategy around precision SRS platforms.
RefleXion introduces biology-guided radiotherapy, winning FDA clearance and raising USD 105 million to scale production. The start-up’s SCINTIX mode challenges legacy paradigms by tethering dose delivery to tumor biology rather than anatomy. ViewRay’s bankruptcy illustrates capital intensity hurdles; yet its IP may catalyze consolidation as larger players seek MRI competencies. Supply-chain resilience, especially for klystrons and high-precision bearings, increasingly influences vendor selection, with dual-sourcing and predictive maintenance emerging as differentiators.
Customer buying criteria coalesce around adaptability, AI automation and service uptime. Vendors bundle software licenses and training to offset workforce gaps, while managed-equipment services convert capex to opex. In developing markets, compact units paired with turnkey bunker solutions appeal to hospital networks expanding outside tier-one cities. Overall, competition centers on delivering clinical efficacy, operational efficiency and economic flexibility inside the medical linear accelerator market.
Medical Linear Accelerator Industry Leaders
-
Accuray Inc.
-
Shinva Medical Instruments Co. Ltd.
-
Elekta
-
ViewRay, Inc.
-
Panacea Medical Technologies Pvt. Ltd.
- *Disclaimer: Major Players sorted in no particular order
Medical Linear Accelerator Market Companies Covered in this Report
- Varian Medical Systems
- Elekta
- Accuray
- ViewRay Inc.
- United Imaging Healthcare Co. Ltd.
- Shinva Medical Instrument
- RefleXion Medical Inc.
- Xstrahl Ltd.
- Hitachi
- GE HealthCare Technologies Inc.
- Sumitomo Heavy Industries Ltd.
- Mevion Medical Systems Inc.
- Advanced Oncotherapy plc
- Panacea Medical Technologies
- Neusoft Medical Systems Co. Ltd.
- TAE Life Sciences LLC

Market Opportunities and Future Outlook
A large near-term whitespace sits in expanding radiotherapy access and modernizing installed fleets in capital-constrained settings, where the gap between disease burden and treatment capacity remains visible. The RD context highlights equipment scarcity in parts of Africa relative to the United States, while government replacement programs in markets such as the United Kingdom and Australia formalize procurement pull and create openings for vendors that can deliver predictable throughput, training, and service resiliency alongside the hardware.
Technology-driven opportunity is clustering around systems that compress infrastructure requirements and staffing intensity while maintaining high-precision delivery. New product activity in 2026 underscores this direction: United Imaging showcased a CE-marked uRT-linac 506c with an integrated diagnostic-quality CT on a single platform at ESTRO 2026, supporting streamlined image guidance and adaptive workflows, and Mevion introduced the S250-FIT proton therapy system designed for standard LINAC vaults after an April 2026 installation at Stanford Medicine, reinforcing demand for solutions that fit existing facilities. In parallel, vendors are aligning roadmaps with acceptance testing and standardization efforts, as reflected by AAPM guidance on conventional LINAC acceptance testing, supporting institutions that aim to shorten commissioning cycles and reduce manual measurement burdens through automation.
Recent Industry Developments in Medical Linear Accelerator Market
- May 2026: A second omnibus order in the ViewRay liquidation advances the wind-down of a prior MRI-guided radiotherapy player, shaping asset disposition and service obligations for installed systems and guiding competitive transitions.
- March 2026: A Bangkok procurement deal involving Shinva Medical Instruments Co. Ltd. advances its Southeast Asia expansion as a hospital signs to procure three Shinva accelerator models, signaling a reference site outside China for competitive tenders.
- December 2025: MDR CE certification was achieved for XHA600E and XHA1400 medical linear accelerators, enabling Europe-bound bids and increasing competitive pressure on established vendors.


Medical Linear Accelerator Market Report Scope and Research Methodology
Market Definition and Coverage
This market covers revenues generated from medical linear accelerators used to deliver external beam radiation therapy in hospitals and cancer treatment settings, including the major system configurations sold for routine clinical use across regions.
Scope exclusions: Brachytherapy systems, proton therapy equipment, and standalone imaging-only radiotherapy devices are excluded from this sizing unless sold as part of a LINAC-led treatment platform.
Segments Covered in This Report
-
By Technology (Value, USD Million)
- Intensity-Modulated RT (IMRT)
- Volumetric-Modulated Arc Therapy (VMAT)
- Image-Guided RT (IGRT)
- Stereotactic SRS/SBRT
- Others
-
By Application (Value, USD Million)
- Breast Cancer
- Lung Cancer
- Prostate Cancer
- Colorectal Cancer
- Head & Neck Cancer
- Other Cancers
-
By Energy Type (Value, USD Million)
- Low-Energy (<6 MeV)
- High-Energy (6–15 MeV)
- Very-High Energy (>15 MeV)
-
By Modality (Value, USD Million)
- Photon-based LINAC
- Electron-based LINAC
- MRI-guided LINAC
- Adaptive RT Systems
- FLASH-ready LINAC
-
By Geography (Value, USD Million)
-
North America
- United States
- Canada
-
Europe
- Germany
- United Kingdom
- France
- Italy
- Spain
- Rest of Europe
-
Asia-Pacific
- China
- India
- Japan
- South Korea
- Australia
- Rest of Asia-Pacific
-
South America
- Brazil
- Argentina
- Rest of South America
-
Middle East and Africa
- GCC
- South Africa
- Rest of Middle East and Africa
-
North America
Data Sources, Market Sizing, and Validation
Desk Research
Desk research starts by mapping the demand pool for radiotherapy equipment and the installed base dynamics, since replacement cycles often drive purchases as much as new capacity additions. We rely on public sources such as World Health Organization cancer statistics, IAEA DIRAC radiotherapy resource data, the OECD Health Statistics series, and CDC and NCI program publications to set the baseline incidence and treatment access context.
On the supply side, we review annual reports, investor presentations, product manuals, regulatory and clearance databases such as FDA and similar country regulators, and peer-reviewed clinical journals that indicate adoption of techniques like IMRT, VMAT, IGRT, and SRS and SBRT. For cross checks, we also reference paid subscriptions for company financials and intelligence, patent databases, and a shipment-level import-export database in markets where equipment trade visibility is meaningful. This list is illustrative, and we reviewed many additional public and proprietary sources to fill gaps, validate assumptions, and clarify unclear data points.
Primary Interviews and Surveys
Primary work is used to confirm how procurement decisions are made, how replacement budgets are approved, and how technology upgrades are priced in real bids. We speak with a mix of OEM and channel-side experts, hospital procurement and radiation oncology leadership, and service and maintenance stakeholders across APAC, EMEA, and the Americas, so our assumptions on ASP movement, deployment timelines, and utilization patterns are grounded.
Distribution of primary research fieldwork respondents
| Company type | Respondent position | Region |
|---|---|---|
| Top tier: 32% | CXOs: 15% | APAC: 40% |
| Mid tier: 48% | Functional/Unit leaders: 42% | EMEA: 36% |
| Smaller Players: 20% | Managers: 43% | Americas: 24% |
Market-Sizing & Forecasting
Our model is built mainly through a top-down approach where cancer incidence, radiotherapy eligibility, treatment course mix, and linac density targets are used to reconstruct equipment demand by region, then converted into value using observed pricing bands. To keep totals realistic, we corroborate results with selective bottom-up checks such as sampled ASP by configuration, channel checks on tender volumes, and a reasonableness rollup using installed base and replacement timing.
Inputs that materially move the estimate include the installed base and age profile of LINACs, replacement cycle length, the share of advanced techniques adopted (for example IMRT and VMAT), typical treatment room build-out timelines, service and software attachment rates, and regional reimbursement and budget signals that influence procurement pace. Forecasts are run using scenario analysis supported by expert views, with base, faster replacement, and slower capex cases stress tested before selecting the final curve. Where data is thin in smaller countries, gaps are handled by using proxy penetration rates tied to comparable health system capacity indicators, then rechecked with interview feedback before being carried into the forecast.
Data Validation & Update Cycle
Validation is done through multiple checks so the final number is not dependent on a single assumption. Analysts compare outputs against independent signals such as radiotherapy center counts, known replacement programs, and directionally consistent shipment and tender activity, and then investigate variance when any region looks out of line.
Before sign-off, the file goes through internal peer review, with re-contact triggers when pricing, replacement timing, or adoption shares shift beyond a reasonable band. Reports are refreshed annually, and interim updates are made when material events occur such as policy changes, major product launches, or supply constraints that can move delivery schedules. Right before delivery, a fresh analyst pass is completed so clients receive the latest updated view available at that time.
Mordor Intelligence's Medical Linear Accelerator Market Estimate Compared With Other Published Estimates
Published market sizes for medical linear accelerators can vary even when the topic looks identical, because the included product boundary and the year chosen as the base can change the math quickly. Differences also come from how services, software, and upgrades are treated, plus the way currency conversion and inflation are applied across regions.
By tracking installed base replacement timing and ASP bands by configuration, and then refreshing assumptions through interview re-checks, Mordor Intelligence keeps the value tied to clinical deployment realities instead of mixing adjacent radiotherapy equipment categories. Some publications appear to use older base years, or they widen scope to include more treatment delivery and planning components, which can lift totals even if unit demand is similar.
Benchmark comparison
| Source | Market Size | Gaps in Research Methodology |
|---|---|---|
| Mordor Intelligence | USD 4.55 B (2026) | |
| Industry Publisher A | USD 4.10 B (2024) | Uses an earlier base year, and its reported scope appears to fold in a broader set of components and technology buckets, which can shift value even when core LINAC system demand is stable. |
| Industry Publisher B | USD 3.90 B (2024) | Shows a lower base value and an inconsistent presentation of base versus forecast, which suggests different boundary handling for system revenue versus services, and a less transparent year-by-year build. |
The table highlights that base-year choice and what gets counted around the LINAC system, such as software, service, and upgrade content, explain most of the spread. With a clearly stated base year and a repeatable set of demand indicators, we can reconcile these differences and keep the final number traceable to practical purchase and replacement behavior.


Key Questions Answered in the Report
What is the current value of the medical linear accelerator market?
The medical linear accelerator market size is USD 4.55 billion in 2026.
How fast is the market expected to grow through 2031?
Revenue is projected to rise at an 8.03% CAGR, reaching USD 6.69 billion by 2031.
Which technology segment is growing the quickest?
Volumetric-Modulated Arc Therapy is forecast to expand at an 8.10% CAGR through 2031.
Why is Asia-Pacific the fastest-growing region?
Rising cancer incidence, government investment in treatment infrastructure and bulk procurement programs drive a 9.08% CAGR in Asia-Pacific installations.
What bottlenecks could limit adoption of new LINACs?
High capital costs, klystron supply-chain constraints and shortages of trained radiation-oncology professionals can slow deployment despite strong demand.
How are vendors addressing workforce shortages?
Vendors integrate AI-enabled adaptive planning and service bundles that automate routine tasks, reduce planning time and provide remote support to offset staffing gaps.
Page last updated on:


 Your data is secure and never sold or shared.


