
Medical Kiosk Market Size and Share
Market Overview
| Study Period | 2020 - 2031 |
|---|---|
| Market Size (2026) | USD 1.91 Billion |
| Market Size (2031) | USD 3.47 Billion |
| Growth Rate (2026 - 2031) | 12.74 % |
| Fastest Growing Market | Asia-Pacific |
| Largest Market | North America |
| Market Concentration | Medium |
Major Players *Disclaimer: Major Players sorted in no particular order Image © Mordor Intelligence. Reuse requires attribution under CC BY 4.0. | |
Medical Kiosk Market Analysis by Mordor Intelligence
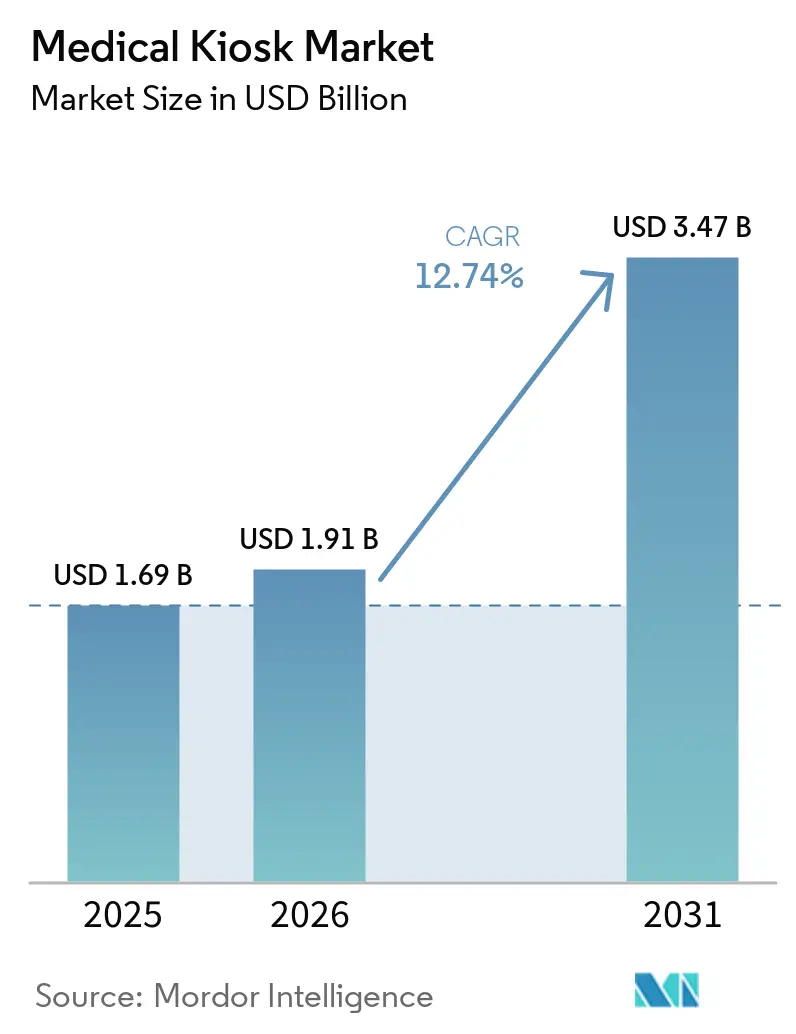
The Medical Kiosk Market size was valued at USD 1.69 billion in 2025 and estimated to grow from USD 1.91 billion in 2026 to reach USD 3.47 billion by 2031, at a CAGR of 12.74% during the forecast period (2026-2031).
Strong digital health policies, fast-expanding 5G coverage, and AI-driven diagnostic modules position medical kiosks as core infrastructure of omnichannel care delivery networks. Providers view the units as a practical way to offset staffing shortages, meet chronic-care demand, and comply with post-pandemic infection-control norms. Vendors that bundle hardware, software, and integration services outpace product-only suppliers because health systems rank interoperability and cybersecurity oversight ahead of initial hardware costs. In parallel, retail pharmacies, community banks, and grocery chains deploy telemedicine kiosks to turn foot-traffic locations into care access points, enlarging the commercial addressable base of the medical kiosk market.
Key Report Takeaways
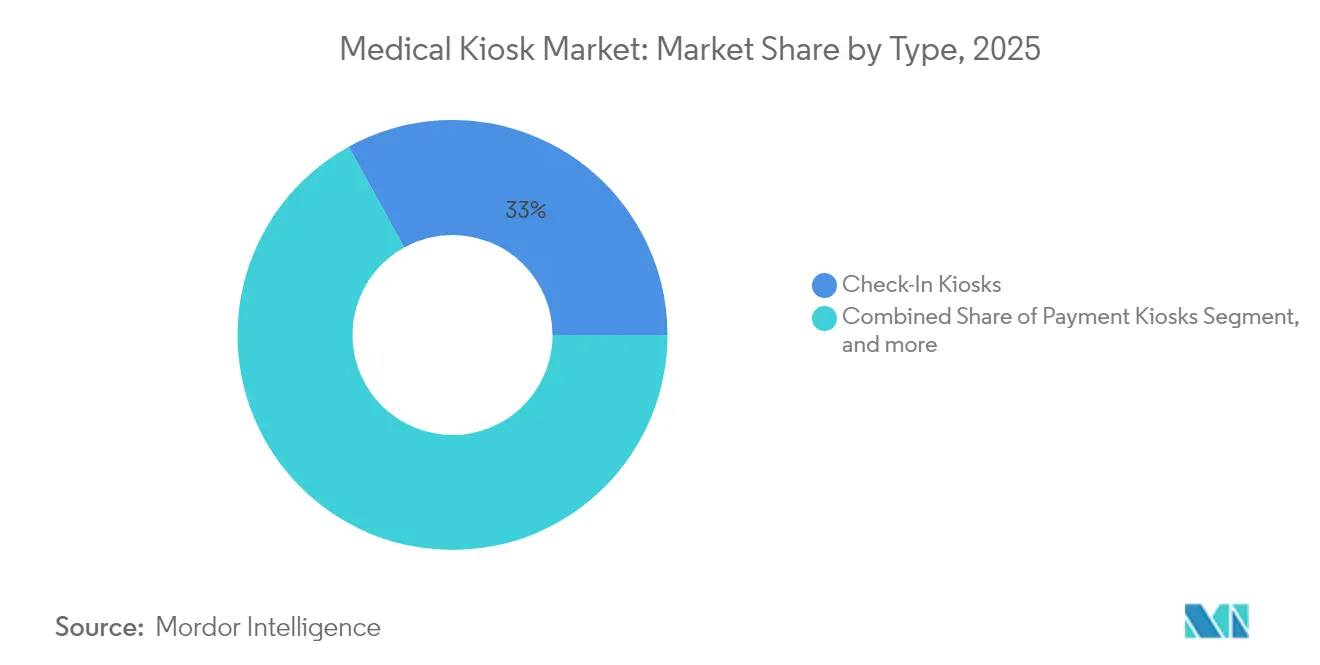
- By type, check-in kiosks led with 33.02% revenue share in 2025, while telemedicine kiosks are projected to expand at a 13.86% CAGR to 2031.
- By component, hardware accounted for 51.05% of the medical kiosk market share in 2025; services record the highest projected CAGR at 15.22% through 2031.
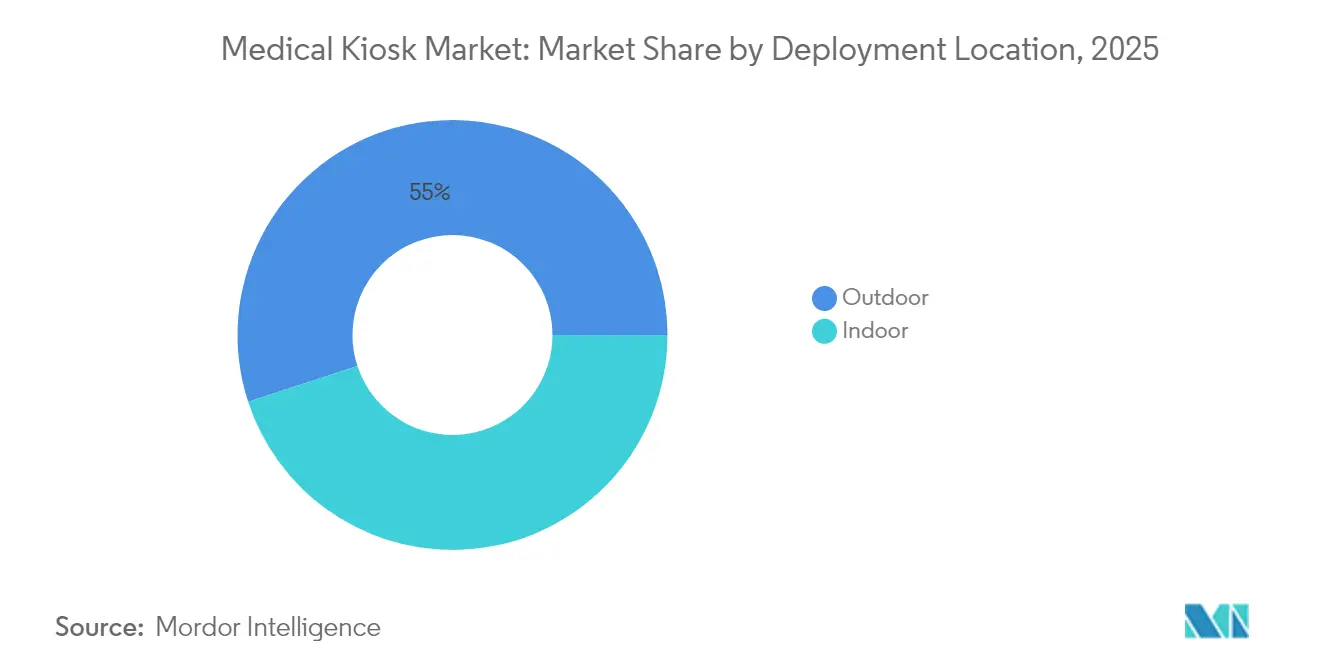
- By deployment location, indoor units held 44.98% of the medical kiosk market size in 2025; outdoor placements are advancing at a 15.59% CAGR through 2031.
- By mobility, freestanding formats captured 40.78% medical kiosk market share in 2025, whereas mobile/cart solutions post a 17.33% CAGR to 2031.
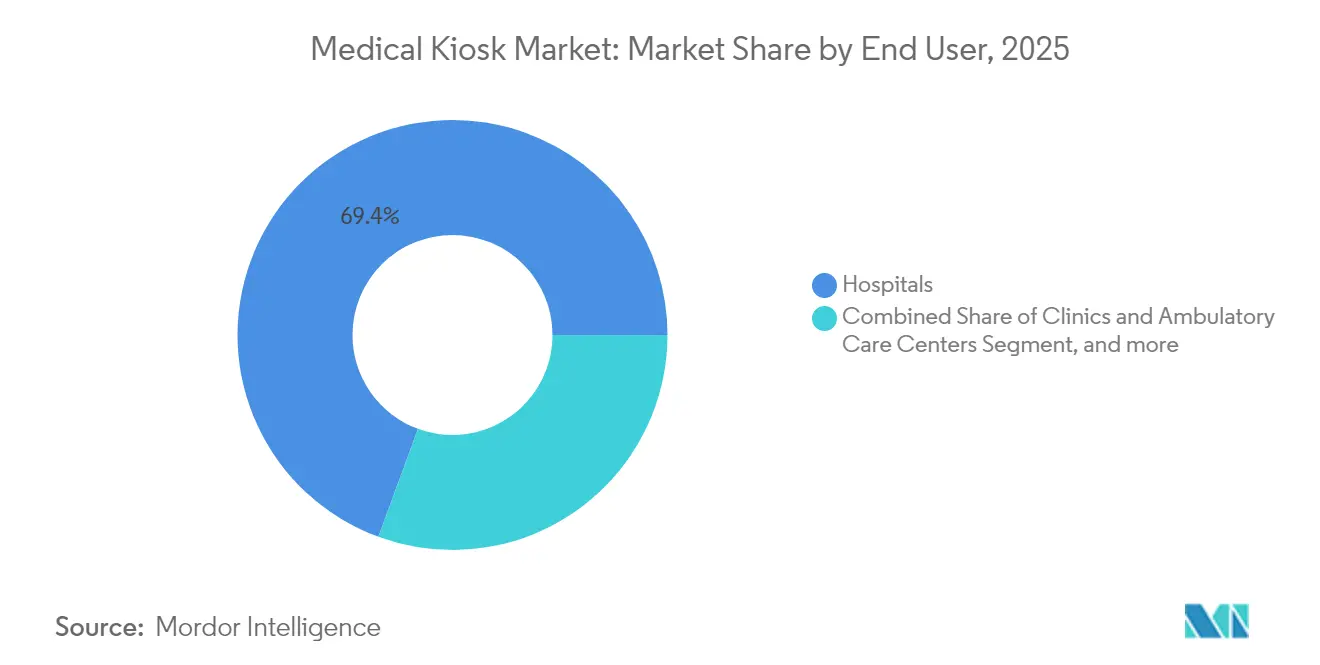
- By end user, hospitals led with 69.40% revenue share in 2025; pharmacies and drugstores are growing fastest at 18.52% CAGR through 2031.
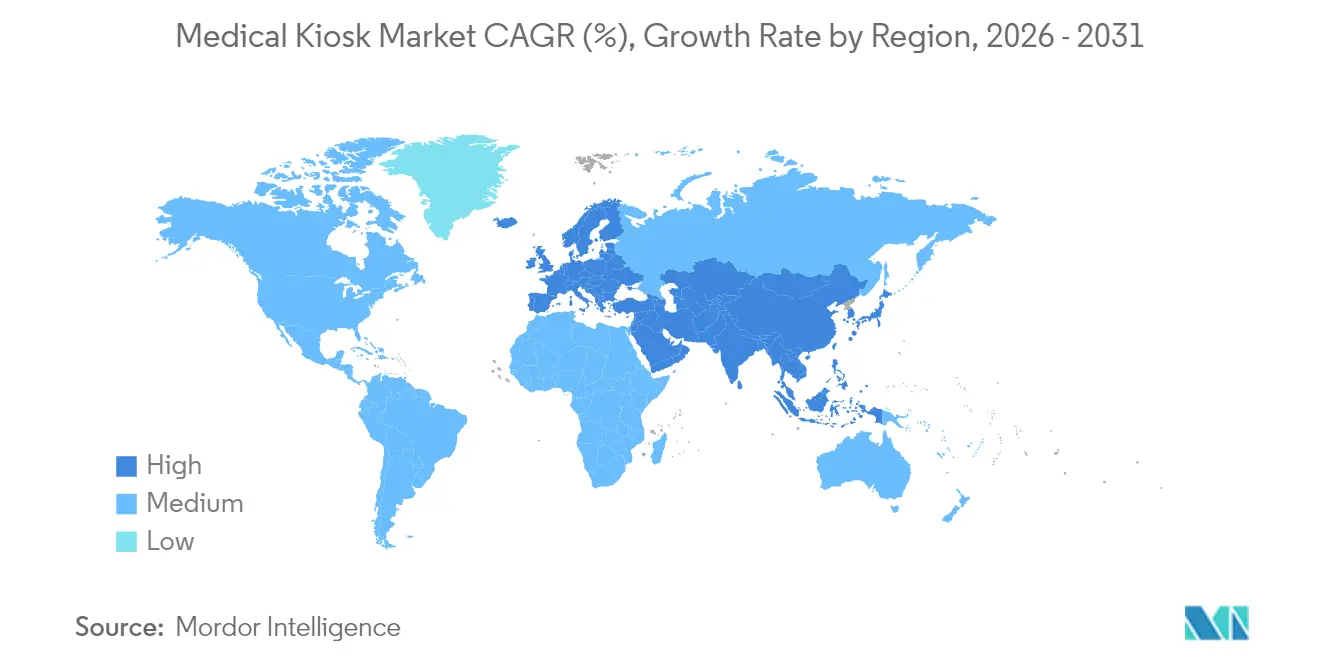
- By geography, North America commanded 46.45% medical kiosk market share in 2025; Asia-Pacific is set to surge at a 19.56% CAGR to 2031.
Note: Market size and forecast figures in this report are generated using Mordor Intelligence’s proprietary estimation framework, updated with the latest available data and insights as of 2026.
Market Trends and Insights
Drivers Impact Analysis of Medical Kiosk Market*
| Driver | ( ~ ) % Impact on CAGR Forecast | Geographic Relevance | Impact Timeline |
|---|---|---|---|
| 5G networks enabling real-time teleconsult | +2.1% | Global, earliest uptake in North America, China, Korea | Medium term (2-4 years) |
| Healthcare digitalization for remote monitoring | +2.8% | Global, spreading to emerging markets | Long term (≥ 4 years) |
| Demand for contactless self-service | +1.9% | Global, strongest in North America and Europe | Short term (≤ 2 years) |
| Government reimbursement pilots | +1.7% | North America and EU core, expanding in APAC | Medium term (2-4 years) |
| AI-driven triage and diagnostics | +2.3% | Global, fastest in developed economies | Long term (≥ 4 years) |
| Chronic disease rise and physician shortage | +2.4% | Global, acute in rural North America and aging APAC | Long term (≥ 4 years) |
| Source: Mordor Intelligence | |||
Expansion of 5G Infrastructure Enabling Real-Time Care
Siriraj Hospital’s 5G Smart Hospital project lowered pathology turnaround to minutes and streamed ambulance vitals directly to specialists, proving that ultra-low-latency connectivity makes kiosks viable for critical care interactions.[1] Health systems now plan kiosks as network endpoints rather than stand-alone machines, boosting transaction capacity and reducing unit cost as more devices ride the same 5G backbone. Edge processing further shrinks lag, enabling HD video consults, AI image reads, and remote robotics. The result is a scalable fabric in which each kiosk strengthens the overall care grid—a dynamic underpinning the medical kiosk market worldwide.
Accelerated Healthcare Digitalization Streamlining Patient Remote Monitoring
Remote-monitoring platforms reached 35% AI adoption in 2024, integrating kiosks as public touchpoints for patients lacking connected devices.[2] Turkey’s Disease Management Platform already logged 73 million chronic encounters by syncing kiosk outputs with its electronic record hub, illustrating how large-scale digital ecosystems absorb self-service endpoints. The shift pushes vendors to certify HL7-FHIR connectors and population-health dashboards, deepening service revenue in the medical kiosk market.
Increased Demand for Contactless, Infection-Controlled Self-Service
Pandemic workstreams normalized touch-free triage. Singapore’s Pharmacy Smart Interface pairs automated dispensing with pharmacist video sessions, trimming queuing time and reducing surface contamination risk. Patient preference surveys show two-thirds of Gen Z users favor kiosk check-in over staffed desks, suggesting durable behavioral change that enlarges the medical kiosk market.
Government-Backed Reimbursement Pilots
US Medicare’s telehealth flexibilities, extended through March 2025, reimburse home and kiosk interactions equally, eliminating geographic barriers and heightening return-on-investment calculations for providers.[3] The proposed VA Telehealth Grant plan funds hardware in rural counties, a catalyst that makes kiosks financially feasible for low-volume clinics.
Restraints Impact Analysis of Medical Kiosk Market*
| Restraint | ( ~ ) % Impact on CAGR Forecast | Geographic Relevance | Impact Timeline |
|---|---|---|---|
| Stringent cybersecurity and data-privacy rules | -1.8% | Global, especially EU and North America | Medium term (2-4 years) |
| High capital and integration costs | -1.4% | Global, strongest in cost-sensitive markets | Short term (≤ 2 years) |
| Limited elderly adoption | -1.1% | Global, notable in aging societies | Long term (≥ 4 years) |
| Vendor lock-in risk | -0.9% | Global, higher in fragmented payer landscapes | Medium term (2-4 years) |
| Source: Mordor Intelligence | |||
Stringent Cybersecurity and Data Privacy Regulations
FDA’s Software Bill of Materials mandate forces suppliers to list every code library, inflating compliance cycles and favoring firms with mature DevSecOps teams. The PATCH Act and HIPAA updates require live threat monitoring; 67% of US health systems admit they lack resources for 24/7 coverage, slowing purchase decisions.
High Capital Expenditure and Integration Costs
Full-featured telemedicine kiosks run into six-figure deployments once EHR connectors, cyber audits, and staff training are included. Smaller clinics often defer projects or choose pared-down hardware, compressing near-term uptake in some segments of the medical kiosk market.
*Our forecasts treat driver/restraint impacts as directional, not additive. The impact forecasts reflect baseline growth, mix effects, and variable interactions.
Medical Kiosk Market Segment Analysis
By Type:
Telemedicine Kiosks Drive Clinical TransformationCheck-In Kiosks held 33.02% medical kiosk market share in 2025, yet telemedicine units are expected to grow with 13.86% CAGR between 2026 and 2031 outpaces every other type in the medical kiosk market. Check-in kiosks still dominate day-to-day workflows, but sustained reimbursement for video consults elevates diagnostic kiosks to enterprise-level priority. In busy ambulatory centers, a single telemedicine kiosk can conduct vitals, provide AI-triage, and connect to an off-site physician in one room cycle, freeing in-house staff for acute cases.
Vital-signs and pharmacy kiosks follow a similar clinical logic, supplying chronic-care data and immediate dispensing in one stop. Payment and way-finding models remain relevant for throughput but face mobile-app redundancy. As AI modules mature, suppliers bundle multiple functions, nudging buyers toward platform contracts and enlarging the medical kiosk market.

By Component:
Services Growth Reflects Integration ComplexityHardware held 51.05% medical kiosk market share in 2025, yet services clock the fastest trajectory at 15.22% as hospitals outsource HL7 integration, SBOM documentation, and patch management. Each regulatory cycle expands the service attach rate, turning managed-service agreements into multi-year revenue streams that stabilize vendor cash flow.
Software remains pivotal for user interface and AI inference engines. Still, license revenue often converts into subscription, blurring lines between software and services. Vendors emphasizing turnkey delivery now close larger deals, signaling that ecosystem capabilities trump hardware features in the medical kiosk market.
By Deployment Location:
Outdoor Growth Signals Access ExpansionOutdoor units, projected at a 15.59% CAGR, transition kiosks from facility fixtures to community assets. Hartford HealthCare’s supermarket placements illustrate congestion relief at hospitals and meet patients where daily life unfolds. Ruggedized enclosures, solar backup, and multi-path connectivity mitigate uptime concerns, broadening geographic reach.
Indoor locations remain critical for high-acuity settings and controlled diagnostics and held 44.98% of overall revenue in 2025. Yet payers now reimburse outdoor kiosk encounters, tipping total cost of care models toward distributed placement. This flexibility widens the medical kiosk market size for vendors equipped to certify weatherproof designs.
By Mobility:
Mobile Solutions Enable Flexible Care DeliveryFreestanding models dominate base installations with 40.78% in 2025, but mobile carts post a 17.33% CAGR through 2031, reflecting a pivot to event-based and outreach care. Philippine health authorities deploy cart units after typhoons to restore chronic services within 48 hours, underscoring mobility’s disaster-response value.
Mobile designs must balance battery life, connectivity, and onboard sterilization. Vendors that master these technical nuances capture incremental revenue from humanitarian agencies and employer clinics, enriching the medical kiosk market landscape.
By End User:
Pharmacy Adoption Accelerates Retail HealthcarePharmacies and drugstores, with an 18.52% CAGR, merge dispensing and diagnostics, cutting refill cycles and adding immunization revenue streams. Walgreens’ robotic fulfillment rollout to 5,000 stores clears back-of-house space, leaving front-of-store areas for telehealth pods that elevate the medical kiosk market.
Hospitals, still the largest buyers commanding 69.40% of overall medical kiosk market size in 2025., integrate kiosks into command centers to distribute triage load. Banks, universities, and long-term-care chains follow as secondary adopters, each pushing new workflow requirements that spur iterative product upgrades.
Geography Analysis
North America Medical Kiosk Market
North America generated 46.45% of global revenue in 2025 as Medicare policy continuity and grant funding de-risk capital outlays. Regional kiosk density now averages one unit per 42,000 residents, a ratio policymakers deem favorable for preventive-care access. Demand also benefits from cohesive broadband and cloud-hosting ecosystems, giving suppliers predictable service margins in the medical kiosk market.
Europe Medical Kiosk Market
Europe’s blend of aging demographics and universal payer models sustains steady replacement cycles. Yet GDPR’s rigorous consent protocols extend deployment lead times, compelling vendors to preload privacy-by-design features. Outdoor telehealth kiosks in Spain’s CostadelSol region now support tourist populations without local medical records, showing that interoperability hurdles can be cleared when public funds align with commercial expertise.
APAC, MEA and South America Medical Kiosk Market
Asia-Pacific posts the fastest expansion at 19.56% CAGR, lifting regional procurement budgets for remote-care endpoints. Government smart-hospital grants in Thailand and India’s Ayushman Bharat digital mission keep the medical kiosk market in high gear. Meanwhile, South Korea pilots 5G-linked kiosks at metro stations, illustrating infrastructure convergence. Growth in the Middle East, Africa, and South America follows capital investment cycles but remains hampered by patchy connectivity and limited local service partners.
Regulatory Landscape
Medical kiosks sit at the intersection of medical device rules and digital health requirements. Deployments that include regulated measurement or diagnostic modules must comply with U.S. FDA controls, including establishment registration and device listing, and they also need to meet broader Quality System expectations. For software components, vendors face growing scrutiny through cybersecurity and transparency requirements, including Software Bill of Materials practices. In January 2026, FDA signaled shifts in its digital health framework, including updated positions around low-risk digital health functions such as general wellness and clinical decision support (CDS), which affects how kiosk vendors scope features, documentation, and claims.
Accessibility compliance is also shaping patient-facing kiosk requirements. In the United States, ADA-aligned accessibility practices and WCAG 2.1 AA requirements for patient-facing digital experiences influence check-in and wayfinding workflows in provider settings, particularly where HHS-funded programs are involved, and it creates design and retrofit work for installed fleets. In Europe, the European Accessibility Act (EAA) and EN 301 549 requirements for self-service terminals introduce procurement constraints and lifecycle considerations for kiosks placed in public and healthcare facilities, favoring vendors with accessibility-by-design evidence and audit-ready software updates.
Competitive Landscape
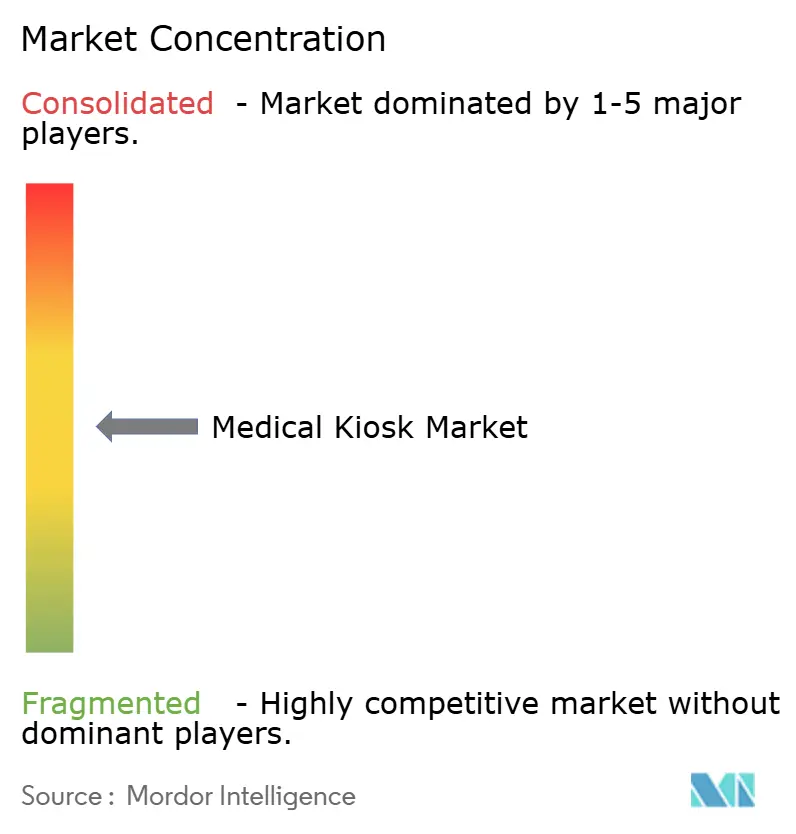
The market is moderately concentrated. Large self-service vendors such as NCR leverage supply-chain scale and field-service footprints to win multisite deals, while focused players like OnMed and UniDoc Health differentiate on telehealth workflow and diagnostic scope. International standard ISO/IEEE 11073-10700:2024 now anchors device connectivity rules, rewarding firms that pursued open-architecture designs early.
Strategy pivots center on ecosystem partnerships. OnMed teamed with the US National Disaster Medical System to validate CareStation units for emergency deployments, demonstrating the brand equity that mission-critical trials confer. NCR’s software-defined kiosk roadmap signals intent to fold healthcare into its managed-service portfolio following an 8% rise in self-service banking revenue in Q4 2024.
Pricing power remains dispersed, yet vendors bundling cybersecurity monitoring and reimbursement coding see higher contract retention. As buyers consolidate around interoperable platforms, suppliers with narrowly framed offerings risk relegation to niche plays, an undercurrent shaping future share shifts inside the medical kiosk market.
Medical Kiosk Industry Leaders
-
Fabcon, Inc.
-
Meridian Kiosks
-
VeriFone, Inc.
-
XIPHIAS Software Technologies
-
RedyRef Interactive Kiosks
- *Disclaimer: Major Players sorted in no particular order
Medical Kiosk Market Companies Covered in this Report
- KIOSK Information Systems
- NCR Corporation
- Olea Kiosks
- Meridian Kiosks
- ADVANCED KIOSKS
- Fabcon
- VeriFone
- RedyRef Interactive Kiosks
- imageHOLDERS
- XIPHIAS Software Technologies
- JCM Global
- Frank Mayer and Associates
- Kiosks4business
- DynaTouch
- UniDoc Health Corp.
- Clearwave Corporation
- HashKiosk
- iDoctorCloud
- NCR Voyix
- Phoenix Kiosk Inc.
Market Opportunities and Future Outlook
Regulatory clarity around lower-risk digital health software creates space for kiosk vendors to move beyond administrative check-in into guided self-assessment, health education, and non-time-critical decision support modules that keep claims within enforcement-discretion boundaries while still automating workflows. FDA digital health guidance activity in January 2026, along with established device pathways for certain physiological monitoring functions (for example, cardiovascular diagnostic device classifications), supports a two-track product strategy: regulated clinical peripherals where needed, and low-risk software experiences where speed-to-deploy and updates matter most.
Integration services are a concrete commercialization lane as providers connect kiosks to EHR/HIS stacks for registration, payments, and results delivery. That dynamic increases demand for HL7-FHIR connectors, identity management, and ongoing patching. Real deployments also show how placement is broadening the addressable base: Hartford HealthCare partnered with OnMed to place Care Stations in Stop & Shop supermarkets in Connecticut, indicating that retail footprints can support clinically oriented virtual-care endpoints. At the same time, OEM/ODM manufacturers such as Hongzhou Smart are positioning healthcare kiosk offerings that emphasize configurable hardware and integration layers for different provider IT environments. These patterns favor platform bundles that combine hardware, software, and services, and they open procurement channels in pharmacies, grocery chains, and other high-traffic venues where accessibility and cybersecurity requirements can be addressed through standardized, updateable builds.
Recent Industry Developments in Medical Kiosk Market
- June 2026: Adherent360 launched a medication kiosk and pharmacy platform solution at the AdventHealth Meadow Woods Emergency Room to assist with patient discharge medication access. The launch expands clinical-use case coverage and interoperability with discharge workflow in a major health system.
- March 2025: NCR Atleos Corporation reported strong Q4 2024 self-service banking results; signals potential expansion into medical kiosk applications. The result underscores cross-industry applicability of self-service platforms toward healthcare.
- November 2024: OnMed/CareSource/Valley Healthcare collaborated to deploy OnMed CareStation in Columbus, GA, first federally qualified health center to offer hybrid care solutions. Demonstrates payer-supported, community-access model for medical kiosks and telehealth integration.
Medical Kiosk Market Report Scope and Research Methodology
Market Definition and Coverage
For this methodology, the medical kiosk market covers self-service and assisted digital kiosks used in healthcare settings to support patient intake, wayfinding, payments, basic vitals capture, and telehealth style interactions, counted on a revenue basis across major regions.
Scope exclusions: We exclude general retail self-service kiosks and non-medical digital signage that is not designed for clinical or patient workflow use.
Segments Covered in This Report
- By Type
- Check-In Kiosks
- Payment Kiosks
- Way-Finding & Information Kiosks
- Telemedicine / Telehealth Kiosks
- Vital-Signs Measurement Kiosks
- Pharmacy / Medication-Dispensing Kiosks
- Patient Education Kiosks
- Others
- By Component
- Hardware
- Software
- Services
- By Deployment Location
- Indoor
- Outdoor
- By Mobility
- Freestanding
- Wall-Mounted
- Countertop
- Mobile / Cart
- By End User
- Hospitals
- Clinics & Ambulatory Care Centers
- Pharmacies & Drugstores
- Diagnostic Laboratories
- Long-Term Care Facilities
- Corporate & Industrial Health Centers
- Others
- By Geography
- North America
- United States
- Canada
- Mexico
- Europe
- Germany
- United Kingdom
- France
- Italy
- Spain
- Rest of Europe
- Asia-Pacific
- China
- Japan
- India
- Australia
- South Korea
- Rest of Asia-Pacific
- Middle East & Africa
- GCC
- South Africa
- Rest of Middle East & Africa
- South America
- Brazil
- Argentina
- Rest of South America
- North America
Data Sources, Market Sizing, and Validation
Desk Research
Desk work started with clarifying where medical kiosks are actually deployed and how demand is reflected in public datasets. We used public sources such as the US FDA device databases (where connected measurement modules apply), the US Bureau of Labor Statistics for staffing pressure signals, the US Census Bureau and UN Comtrade for electronics trade context, and OECD health statistics to sense-check site and patient throughput trends.
We also reviewed company filings, investor presentations, hospital procurement notices, and association websites related to digital health and hospital operations to understand buying cycles and replacement timing. In a few places, a paid subscription for company financials and a patent database were used to confirm product direction and avoid double counting adjacent kiosk categories. The desk sources mentioned are illustrative and not exhaustive, and many other public documents were also used for collection, validation, and clarification.
Primary Interviews and Surveys
Primary work focused on validating what gets sold and installed, plus how pricing and service attachment have shifted across recent quarters. We spoke with kiosk solution providers, component suppliers, healthcare IT teams, and facility operations stakeholders across major regions. This respondent input helped fill model gaps and pressure-test assumptions on unit mix, adoption velocity, and service bundling.
Distribution of primary research fieldwork respondents
| Company type | Respondent position | Region |
|---|---|---|
| Top tier: 38% | CXOs: 20% | APAC: 45% |
| Mid tier: 42% | Functional/Unit leaders: 34% | EMEA: 31% |
| Smaller Players: 20% | Managers: 46% | Americas: 24% |
Market-Sizing & Forecasting
Sizing was built using a top-down demand pool that starts from healthcare site counts and patient flow intensity, and then applies kiosk adoption and replacement cycles by setting (for example hospitals versus clinics, and indoor versus outdoor use). To keep the model practical, we relied on inputs that can be checked repeatedly over time, including deployment location mix, typical kiosk units per site, service attachment rates, average selling price ranges by component bundle, and replacement timing driven by hardware life and software upgrade cycles.
Results were corroborated with selective bottom-up approximations, where sampled ASP times implied unit volumes were compared with supplier and channel checks by region. When gaps showed up in bottom-up visibility, conservative penetration bands were used and then adjusted after interview feedback, especially where multi-year software and services are bundled with hardware. For forecasting, scenario analysis was applied, anchored on healthcare digital intake adoption, staffing constraints, reimbursement comfort for remote care touchpoints, and budgeting patterns shared by practitioners.
Data Validation & Update Cycle
Model outputs were checked against independent signals such as installed base commentary in public materials, procurement seasonality, and the pace of new site openings, and then anomalies were investigated before sign-off. If a region or use setting showed an unusual shift, assumptions were re-tested through follow-up outreach and cross-checks on pricing ranges and service attachment.
Reports are refreshed annually, and interim updates are triggered when material events affect pricing, demand, or supply availability. Before delivery, an analyst completes a final refresh pass on key inputs, including currency conversions and recent ASP checks, so clients receive an updated view tied to repeatable steps.
Mordor Intelligence's Medical Kiosk Market Size Compared Against Other Published Estimates
Published market numbers for medical kiosks can differ more than expected because publishers do not always count the same revenue lines or apply the same timing assumptions. Differences in what gets annualized from multi-year contracts, as well as the FX date used for conversion, can move totals even when deployment activity looks similar.
A common gap driver is refresh cadence for pricing, since newer configurations (such as telehealth enabled kiosks and higher-grade peripherals) can change the average selling price over a short period. When ASP and service attachment assumptions are re-validated during updates and currency timing is held consistent, Mordor Intelligence keeps the total tied to a reproducible revenue build rather than older price points.
Benchmark comparison
| Source | Market Size | Gaps in Research Methodology |
|---|---|---|
| Mordor Intelligence | USD 1.69 B (2025) | |
| Global Consultancy A | USD 1.42 B (2023) | Uses an earlier base year and commonly treats the market as hardware-only, which excludes recurring software and services that are frequently bundled in healthcare deployments. |
| Industry Association B | USD 1.76 B (2024) | Applies a broad kiosk ASP assumption and relies on voluntary member submissions, which can overstate healthcare-grade pricing and undercount non-member shipments in some regions. |
Across the three figures, the spread is mainly explained by timing and how recurring lines are handled, rather than by disagreement on demand direction. Once scope is kept consistent across hardware, software, and services, and pricing is updated using recent contract checks, decision-makers get a clearer value that can be repeated year after year.
Key Questions Answered in the Report
What is the projected size of the medical kiosk market by 2031?
The market is forecast to reach USD 3.47 billion by 2031, reflecting a 12.74% CAGR over the period (2026-2031).
Which segment grows fastest within the medical kiosk market?
Telemedicine kiosks record the highest growth, expanding at a 13.86% CAGR as providers shift from administrative to clinical self-service.
Why are services outpacing hardware in revenue growth?
Integration with EHRs, cybersecurity compliance, and ongoing software support drive a 15.22% CAGR for services, exceeding hardware’s pace.
Which region leads in medical kiosk market share today?
North America holds 46.45% share due to mature IT infrastructure and supportive reimbursement policy.
How do pharmacies benefit from adopting kiosks?
Pharmacies leverage kiosks for teleconsults and automated dispensing, enabling an 18.52% CAGR in the segment by merging medication fulfillment with primary care.
What is the main regulatory hurdle for kiosk vendors?
Compliance with FDA’s Software Bill of Materials and broader cybersecurity mandates increases development and operational costs, especially for smaller manufacturers.