Medical Implants Market Size and Share
Market Overview
| Study Period | 2020 - 2031 |
|---|---|
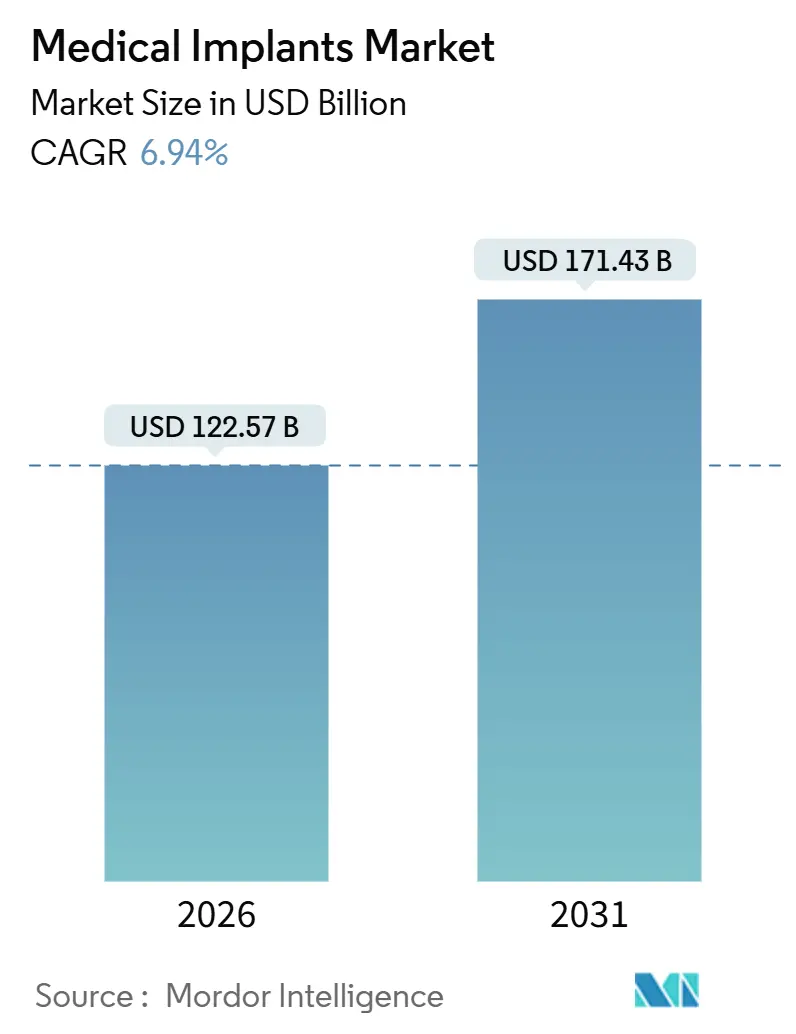
| Market Size (2026) | USD 122.57 Billion |
| Market Size (2031) | USD 171.43 Billion |
| Growth Rate (2026 - 2031) | 6.94% CAGR |
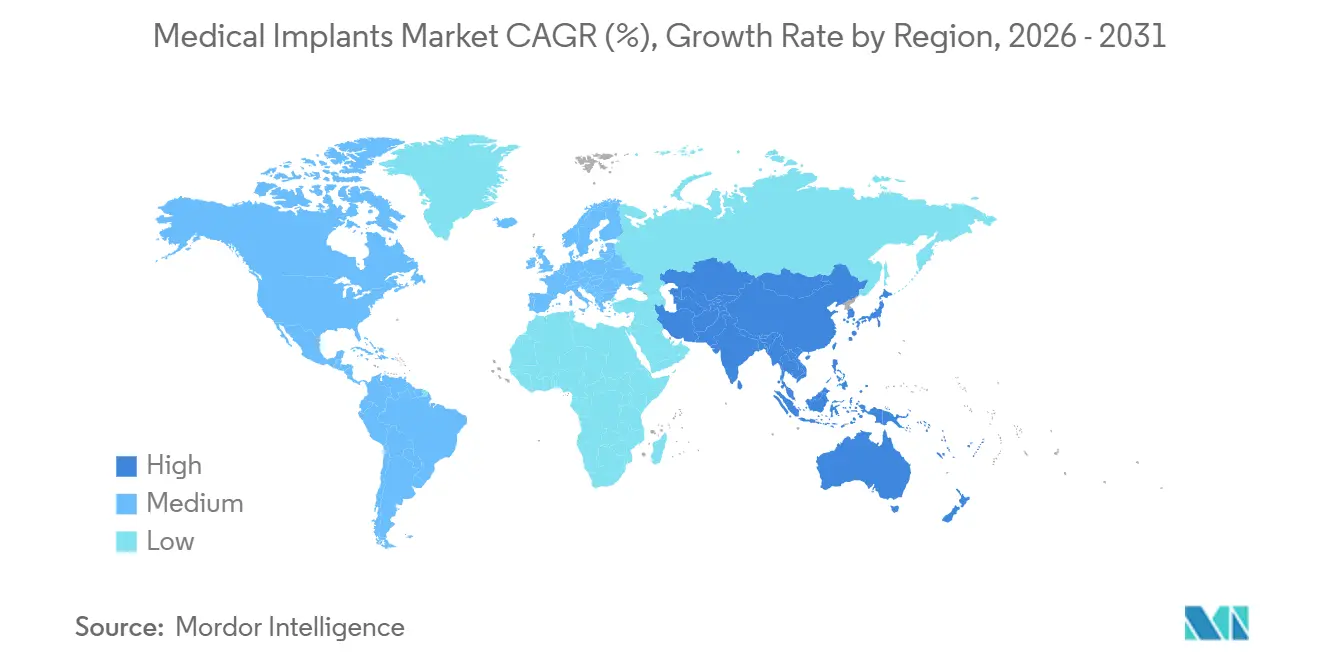
| Fastest Growing Market | Asia Pacific |
| Largest Market | North America |
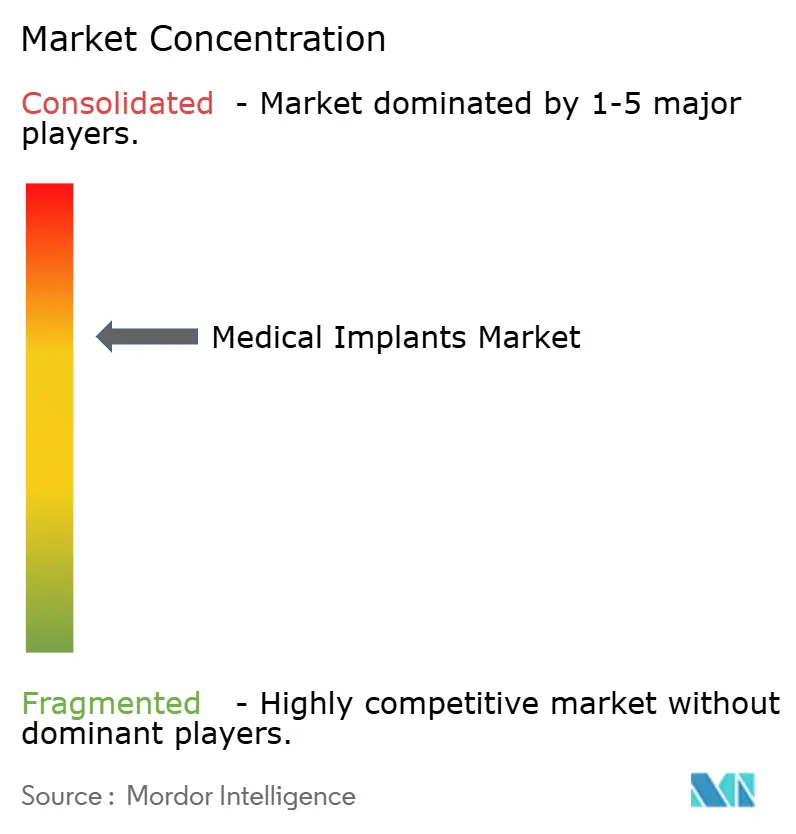
| Market Concentration | Medium |
Major Players *Disclaimer: Major Players sorted in no particular order Image © Mordor Intelligence. Reuse requires attribution under CC BY 4.0. | |
Medical Implants Market Analysis by Mordor Intelligence
The global medical implants market size is expected to reach USD 122.57 billion in 2026 and is projected to reach USD 171.43 billion by 2031, advancing at a 6.94% CAGR over the forecast period. Demand moves in lockstep with larger demographic trends, material science advances, and payer policies that channel more procedures toward outpatient settings. Aging populations generate sustained orthopedic and cardiovascular volumes, while aesthetic preferences and rising middle-class incomes unlock new cohorts for cosmetic and dental devices. Smart sensor-enabled platforms and additive manufacturing shorten operating times and recovery periods, encouraging provider adoption even as reimbursement scrutiny rises. Competitive dynamics remain moderate, with the top five companies holding 42% share, leaving headroom for regional specialists that meet price-sensitive segments with locally made implants and direct-to-consumer channels.
Key Report Takeaways
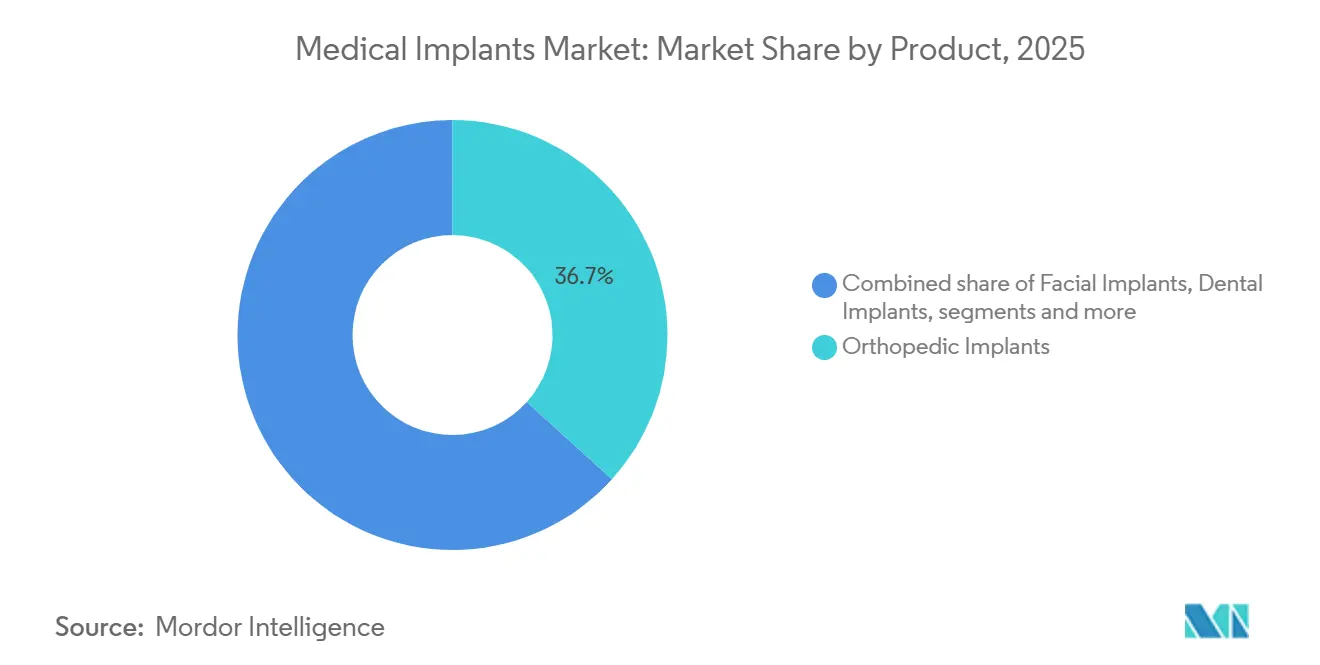
- By product, orthopedic implants led with a 36.7% revenue share in 2025, while dental implants are forecast to grow at an 8.12% CAGR through 2031.
- By material, metallic biomaterials accounted for 49.2% of the segment in 2025, but bioresorbable polymers will register a 7.57% CAGR over the same horizon.
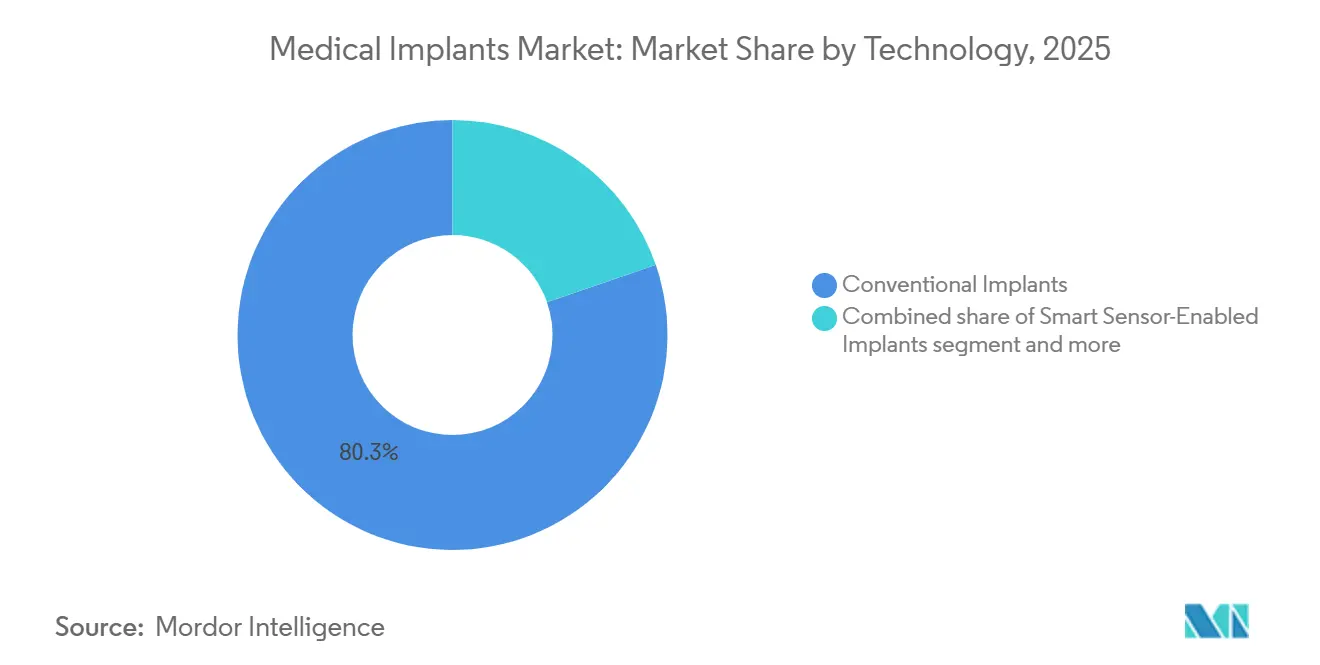
- By technology, conventional platforms retained 80.3% share in 2025, yet smart sensor-enabled implants are poised for an 8.45% CAGR to 2031.
- By end-user, hospitals captured 46.7% demand in 2025, whereas ambulatory surgical centers will expand at a 7.81% CAGR through 2031.
- By geography, North America held a 41.3% stake in 2025, but Asia-Pacific will post the fastest 8.31% CAGR through 2031.
Note: Market size and forecast figures in this report are generated using Mordor Intelligence’s proprietary estimation framework, updated with the latest available data and insights as of January 2026.
Global Medical Implants Market Trends and Insights
Drivers Impact Analysis
| Driver | (~) % Impact on CAGR Forecast | Geographic Relevance | Impact Timeline |
|---|---|---|---|
| Aging population & higher chronic disease burden | +1.8% | Global, centered in North America, Europe, Japan | Long term (≥ 4 years) |
| Expanding elective cosmetic & dental procedures | +1.2% | Global, faster in Asia-Pacific and Middle East | Medium term (2–4 years) |
| Continuous material science breakthroughs enabling ultra-light & bio-active implants | +1.0% | R&D hubs in North America and Europe; volume adoption in Asia-Pacific | Medium term (2–4 years) |
| Large language-model assisted design compressing R&D timelines | +0.6% | Innovation clusters in North America and Europe | Short term (≤ 2 years) |
| Healthcare Infrastructure Development & Medical Tourism | +1.0 | Asia Pacific, Middle East, Latin America | Long term (≥ 4 years) |
| Growing Popularity of 3D Printing | +0.9 | Global, with hubs in North America, Europe, China | Medium term (2-4 years) |
| Source: Mordor Intelligence | |||
Aging Population and Higher Chronic Disease Burden Propel Implant Volumes
Adults aged 65 and older numbered 857 million worldwide in 2025 and will exceed 1 billion by 2030, driving sustained demand for joint replacements, pacemakers, and intraocular lenses [1]United Nations, “World Population Ageing 2025,” un.org. Total knee arthroplasty procedures in the United States rose to 1.2 million in 2025, up 24% from 2020, while hip replacements increased 14% during the same period. Cardiac device adoption followed suit, with 3.8 million Americans living with implanted pacemakers or defibrillators in 2025. Chronic kidney disease, which affects 850 million people globally, boosts the need for vascular-access grafts, a subsegment that grew 9% year over year in 2025. These population dynamics underpin a multidecade growth runway even as price pressures mount from value-based procurement.
Expanding Elective Cosmetic and Dental Procedures Unlock New Patient Cohorts
Global elective cosmetic surgeries, such as breast augmentation and facial contouring, grew significantly between 2023 and 2025, helped by social-media influence and installment-based financing. Breast implant placements crossed over 2 million units in 2025, with silicone-gel devices making up the majority due to lower capsular contracture rates. The United States alone saw nearly 3 million dental-implant procedures in 2025. Asia-Pacific clinics captured double-digit growth as private networks offered zirconia and titanium implants at significantly lower prices than Western counterparts, yet with comparable osseointegration. Medical tourists contributed significantly to dental and cosmetic implant revenue in Thailand and Turkey in 2025. This was driven by substantial cost savings compared to U.S. pricing.
Continuous Material Science Breakthroughs Enable Ultra-Light and Bio-Active Implants
Electron-beam-melted titanium-aluminum-vanadium lattice structures now weigh significantly less than solid titanium yet sustain yield strengths above 900 megapascals, improving load distribution in spine cages [2]Zimmer Biomet, “Titanium Lattice Research,” zimmerbiomet.com. Hydroxyapatite and bio-glass coatings accelerate osteoblast adhesion, halving osseointegration time to six weeks and cutting early failure rates below 2% in primary hip arthroplasty. Bioresorbable polymers such as poly-lactic-co-glycolic acid remove the need for second surgeries, avoiding USD 8,000–12,000 in hardware removal costs per patient. The U.S. FDA cleared 14 new biomaterial formulations in 2025, twice the 2023 tally, endorsing long-term safety profiles. Material advances thus reinforce the medical implants market's path toward lighter, faster-integrating devices.
Large Language-Model Assisted Design Compresses R&D Timelines
Zimmer Biomet’s in-house large language model digests CT scans and runs 500 load-case simulations overnight, shrinking design cycles from six months to three weeks. Conformis used similar tools to cut manufacturing scrap by 18% and save USD 1,200 in material per custom knee implant. Medtronic automated safety-data extraction for FDA submissions, reducing filing preparation time by 40% and speeding January 2026 clearance of its Micra AV2 pacemaker. These platforms lower entry barriers for mid-tier firms, though unresolved IP questions around AI-generated designs add legal uncertainty.
Restraints Impact Analysis
| Restraint | (~) % Impact on CAGR Forecast | Geographic Relevance | Impact Timeline |
|---|---|---|---|
| Intensifying regulatory scrutiny & longer approval timelines | -0.9% | Global, sharper in North America and Europe | Medium term (2–4 years) |
| High device cost & limited reimbursement | -1.1% | Emerging markets in Asia-Pacific, the Middle East & Africa, and South America | Long term (≥ 4 years) |
| Cybersecurity risks for smart implants are eroding clinician confidence | -0.5% | North America, Europe (high smart-implant penetration) | Short term (≤ 2 years) |
| Global titanium supply-chain volatility post-2027 | -0.7% | Global, acute impact on high-volume manufacturers in North America, Europe, APAC | Medium term (2-4 years) |
| Source: Mordor Intelligence | |||
Intensifying Regulatory Scrutiny and Longer Approval Timelines Delay Market Entry
The U.S. FDA stretched average 510(k) reviews to 9.2 months in 2025 as evaluators demanded extra biocompatibility data for new polymers. Europe’s Medical Device Regulation forced manufacturers to recertify legacy products at a combined industry cost of EUR 5 billion in 2025, delaying 37 launches by 14 months [3]European Commission, “MDR Impact Report 2025,” ec.europa.eu. China added mandatory cybersecurity audits for connected implants, extending approval by six to nine months and obliging encryption compliance with GB/T 39204. Smaller firms often lack the infrastructure to meet these demands, concentrating share with incumbents and slowing adoption of closed-loop neuromodulation or smart orthopedic sensors.
High Device Cost and Limited Reimbursement Constrain Adoption in Emerging Markets
A total knee-replacement system costs USD 8,000–15,000 in India, where public health spending averages USD 73 per capita, restricting access to urban hospitals and medical tourists. Brazil’s public plan reimburses only 40% of orthopedic implant expenses, pushing patients to pay out of pocket or defer surgery. Most national insurers treat dental implants as elective, limiting coverage to households in the top quartile of income distribution. Zimmer Biomet introduced Essential-line hip and knee implants in 2025, priced 35% below flagship devices, but lower margins curb spending on surgeon training and logistics in low-income regions.
Segment Analysis
By Product: Orthopedic Demand Dominates While Dental Leads Growth
Orthopedic implants contributed the largest slice of the medical implants market at 36.7% in 2025, benefiting from growing hip, knee, and spine surgeries among aging populations. Dental devices, although smaller, deliver the fastest 8.12% CAGR thanks to aesthetic dentistry and improved implant–bone integration.
Orthopedic leaders focus on robotics and 3D printing to shorten operating times, whereas dental specialists target digital workflows connecting intraoral scanners to design software. Cardiovascular implants held 23.14%, anchored by pacemakers and transcatheter valves from Medtronic and Abbott that improve outcomes in heart-failure patients. Cochlear and auditory implants grew 7.26% on wider indications for pediatric hearing loss. Cosmetic implants, including breast and facial devices, added 11.7% of revenue amid a 22% jump in global elective surgeries.
Note: Segment shares of all individual segments available upon report purchase
By Material: Metallic Incumbents Face Bioresorbable Momentum
Metallic biomaterials represented 49.2% of the medical implants market share in 2025, owing to titanium’s favorable strength-to-weight profile. Bioresorbable polymers, however, will post a 7.57% CAGR through 2031 as clinicians favor implants that dissolve post-healing.
Polymeric options such as poly-ether-ether-ketone held 28.1%, offering radiolucency for post-operative imaging. Ceramics, mainly zirconia and alumina, captured 14.6% and shine in dental crowns and femoral heads due to high wear resistance. Natural resorbables attracted major research and development spend; Stryker invested heavily to develop screws that degrade safely, lowering revision rates tied to permanent hardware removal. Rising titanium prices accelerate exploration of tantalum and niobium alternatives.
By Technology: Smart Sensor Platforms Gain Traction
Conventional devices commanded 80.3% of revenue in 2025, yet smart sensor-enabled platforms are forecast to grow 8.45% annually as providers tap continuous monitoring to curb readmissions.
Smart cardiac monitors already feed real-time data to electronic records, cutting heart-failure readmissions significantly. Additive manufacturing, 12.1% of the segment in 2025, will keep expanding as payers now recognize customized implants with dedicated reimbursement codes. Nevertheless, cybersecurity advisories for Bluetooth-enabled stimulators heighten compliance costs, prompting vendors to adopt over-the-air authentication patches.
Note: Segment shares of all individual segments available upon report purchase
By End-User: Outpatient Shift Benefits Ambulatory Centers
Hospitals retained 46.7% of the market in 2025, reflecting capacity for complex revisions and high-acuity care. Ambulatory surgical centers, though smaller at 21.3%, are rising at a 7.81% CAGR as insurers achieve payment parity for elective joint replacements delivered outside traditional hospital walls.
Dental and ophthalmology clinics together accounted for 32.5%, enabled by in-house imaging and surgical-planning systems that streamline patient flow. Hospitals fight back with bundled-payment contracts covering the full episode of care at competitive rates, while private-equity backing fuels ASC expansion into suburban areas.
Geography Analysis
North America anchored 41.3% of the medical implants market in 2025 thanks to the highest per-capita procedure rates and expedited breakthrough-device pathways that shorten time to market. Recent Medicare coverage for robotic joint replacements added USD 2.1 billion in reimbursement headroom and spurred hospital purchases of Stryker’s Mako and Zimmer Biomet’s Rosa systems. Canada’s single-payer caps create nine-month wait lists, sending 12,000 citizens annually to U.S. providers for faster access.
Europe supplied 28.2% of global revenue in 2025, but Medical Device Regulation costs prompted 14 mid-sized firms to exit, consolidating supply with multinationals. Asia-Pacific, by contrast, will drive future gains with an 8.31% CAGR; China’s Healthy China 2030 initiative set aside CNY 120 billion to extend orthopedic coverage in tier-2 cities, while India’s Ayushman Bharat scheme now covers 500 million citizens for implant procedures. Japan’s reimbursement schedules cut device prices 2% every two years, squeezing margins but keeping procedure volumes high as 28% of the population is already over 65 years old.
The Middle East & Africa and South America contributed a combined 14.6% in 2025. The United Arab Emirates approved 22 new implant models after streamlining its review pathway to recruit device makers. Brazil expanded public coverage to include congenital dental implants, adding 180,000 beneficiaries and USD 320 million in demand. South Africa continues to battle shipping delays linked to Red Sea disruptions, prompting distributors to build local inventory hubs.
Competitive Landscape
The medical implants market shows moderate concentration. Zimmer Biomet, Stryker, Medtronic, Johnson & Johnson MedTech, and Smith & Nephew hold significant combined shares, leaving openings for regional firms such as MicroPort and Osstem that compete on price and localized distribution.
Stryker’s USD 420 million purchase of Additive Orthopaedics in 2025 gives it in-house 3D printing that cuts lead times from eight weeks to ten days for custom titanium implants. Medtronic invested USD 1.2 billion in closed-loop neuromodulation R&D, underpinning its August 2025 FDA approval of the Percept PC system featuring real-time brain-signal tracking.
Digital disruptors use direct-to-consumer portals. Conformis sells patient-specific knees online to hospitals, gaining 4.2% of the U.S. custom-implant segment on a lean sales force. Boston Scientific’s Watchman FLX integrates imaging guidance and cut complications by 18% in a 2025 clinical study. Patent filings confirm momentum: Zimmer Biomet lodged 37 porous-coating applications in 2025, and Abbott filed 22 patents for sub-centimeter cardiac sensors. ISO 13485 certification remains standard; 89% of vendors retained compliant quality systems after biennial audits.
Medical Implants Industry Leaders
Boston Scientific Corporation
Johnson & Johnson (DePuy Synthes, Ethicon, Mentor)
Medtronic plc
Stryker Corporation
Zimmer Biomet Holdings
- *Disclaimer: Major Players sorted in no particular order
Recent Industry Developments
- July 2025: Edwards Lifesciences secured FDA approval for its Sapien M3 system for mitral regurgitation. The company's SAPIEN M3 mitral valve replacement system is the first transcatheter therapy utilizing a transseptal approach to receive US Food and Drug Administration (FDA) approval for the treatment of mitral regurgitation (MR)
- July 2025: SetPoint Medical received FDA approval for the first implantable neuroimmune modulation device designed to treat rheumatoid arthritis through targeted electrical stimulation of the vagus nerve.
- April 2025: Precision Neuroscience received FDA 510(k) clearance for its Layer 7 Cortical Interface, a high-resolution implant authorized for up to 30 days of mapping and stimulating cortical activity.
Research Methodology Framework and Report Scope
Market Definitions and Key Coverage
Our study defines the global medical implants market as every regulated device intentionally placed inside or on the human body for more than thirty days to replace, support, or monitor anatomical structures; this includes orthopedic joints, cardiovascular stents and pacemakers, dental fixtures, ophthalmic lenses, neurostimulators, breast and facial implants, plus emerging smart or 3-D-printed variants. According to Mordor Intelligence, accessories, consumables, temporary fixation devices, and purely cosmetic injectable fillers are outside scope.
Scope Exclusions: temporary tissue grafts, contraceptive rods, and external prosthetic limbs are not counted.
Segmentation Overview
- By Product
- Orthopedic Implants
- Hip Orthopedic Devices
- Knee Orthopedic Devices
- Spine Orthopedic Devices
- Joint Reconstruction
- Other Orthopedic Products
- Cardiovascular Implants
- Pacing Devices
- Stents
- Structural Cardiac Implants
- Ophthalmic Implants
- Intra-ocular Lens
- Glaucoma Implants
- Dental Implants
- Cochlear & Auditory Implants
- Facial Implants
- Breast Implants
- Other Implants (neurostimulators, contraceptive, etc.)
- Orthopedic Implants
- By Material
- Metallic Biomaterials
- Polymeric Biomaterials
- Ceramic Biomaterials
- Natural / Bioresorbable Biomaterials
- By Technology
- Conventional Implants
- 3-D Printed / Additive Manufactured Implants
- Smart Sensor-Enabled Implants
- By End-User
- Hospitals
- Specialty Clinics
- Ambulatory Surgical Centers
- By Geography
- North America
- United States
- Canada
- Mexico
- Europe
- Germany
- United Kingdom
- France
- Italy
- Spain
- Rest of Europe
- Asia-Pacific
- China
- Japan
- India
- Australia
- South Korea
- Rest of APAC
- Middle East & Africa
- GCC
- South Africa
- Rest of Middle East & Africa
- South America
- Brazil
- Argentina
- Rest of South America
- North America
Detailed Research Methodology and Data Validation
Primary Research
Surgeons, biomedical engineers, hospital procurement heads, and implant distributors across North America, Europe, and key Asia-Pacific markets were interviewed. Their insights validated adoption curves for sensor-enabled implants, typical revision rates, and price dispersion, allowing us to refine secondary estimates and assumptions.
Desk Research
Analysts began with public datasets from organizations such as the US FDA's 510(k) register, EU's EUDAMED notices, OECD Health Statistics, and WHO elective-surgery trackers to size procedure pools and regulatory pipelines. Trade association papers from the Advanced Medical Technology Association, American Academy of Orthopedic Surgeons, and International Dental Federation provided unit shipments and average selling price indications. Company 10-Ks, investor decks, and customs records (UN Comtrade HS 9021) helped cross-check regional flow. Paid intelligence from D&B Hoovers and Questel supplemented revenue splits and patent velocity. This list is illustrative; many other repositories were reviewed for consistency and clarification.
Market-Sizing & Forecasting
A top-down procedure-volume model converted orthopedic, cardiovascular, dental, and cataract surgeries into device counts, which are then multiplied by blended ASPs and reconciled with selective supplier roll-ups for plausibility. Key inputs include aging population growth, elective surgery backlog clearance, reimbursement revisions, titanium and cobalt price trends, regulatory approval cadence, and share shift toward additive-manufactured designs. Multivariate regression with lagged macroeconomic indicators generates the 2025-2030 forecast, while scenario analysis captures pacing delays or accelerated smart-implant uptake. Gaps in granular shipment data are bridged using channel checks and averaged import values.
Data Validation & Update Cycle
Outputs pass three-layer analyst reviews, variance checks against independent procedural statistics, and anomaly flags. Mordor refreshes the model annually and re-runs critical assumptions when material events, such as new CMS coding or large recalls, occur, ensuring clients always receive the latest vetted view.
Why Mordor's Medical Implants Baseline Commands Reliability
Published estimates often diverge because firms differ on what qualifies as an implant, how far elective surgery rebounds extend, and which exchange rates anchor their models.
Key gap drivers include broader device baskets, aggressive double-digit ASP escalation, or static pre-COVID procedure assumptions used by other studies, whereas our baseline captures only long-term implants, applies blended multi-currency averages, and factors verified backlog digestion rates.
Benchmark comparison
| Market Size | Anonymized source | Primary gap driver |
|---|---|---|
| USD 114.66 B | Mordor Intelligence | - |
| USD 126.29 B | Regional Consultancy A | Includes temporary scaffolds and contraceptive inserts |
| USD 128.21 B | Global Consultancy B | Uses uniform 7% ASP inflation without regional adjustment |
| USD 130.11 B | Trade Journal C | Rolls forward 2022 surgery volumes without post-pandemic catch-up check |
These comparisons show that when scope precision, realistic price progressions, and current procedure data are combined, as in Mordor's model, the resulting baseline remains balanced, transparent, and reliably reproducible for strategic planning.
Key Questions Answered in the Report
How large will be the medical implants market in 2026?
The medical implants market size stands at USD 122.23 billion in 2026 and is set to reach USD 171.43 billion by 2031.
Which product category generates the most revenue?
Orthopedic implants lead, accounting for 36.7% of global revenue in 2025.
What is the fastest-growing segment by product?
Dental implants show the highest growth with an 8.12% CAGR projected through 2031.
How are smart sensor-enabled implants impacting outcomes?
Smart implants that transmit real-time data have reduced hospital readmissions in cardiac patients by up to 20% in pilot studies.
Which region will see the quickest expansion?
Asia-Pacific is expected to register the fastest regional growth at an 8.31% CAGR to 2031.
What factors restrain adoption in emerging economies?
High device prices and limited reimbursement coverage slow uptake despite strong patient need.


