
Medical Imaging Workstations Market Size and Share
Market Overview
| Study Period | 2020 - 2031 |
|---|---|
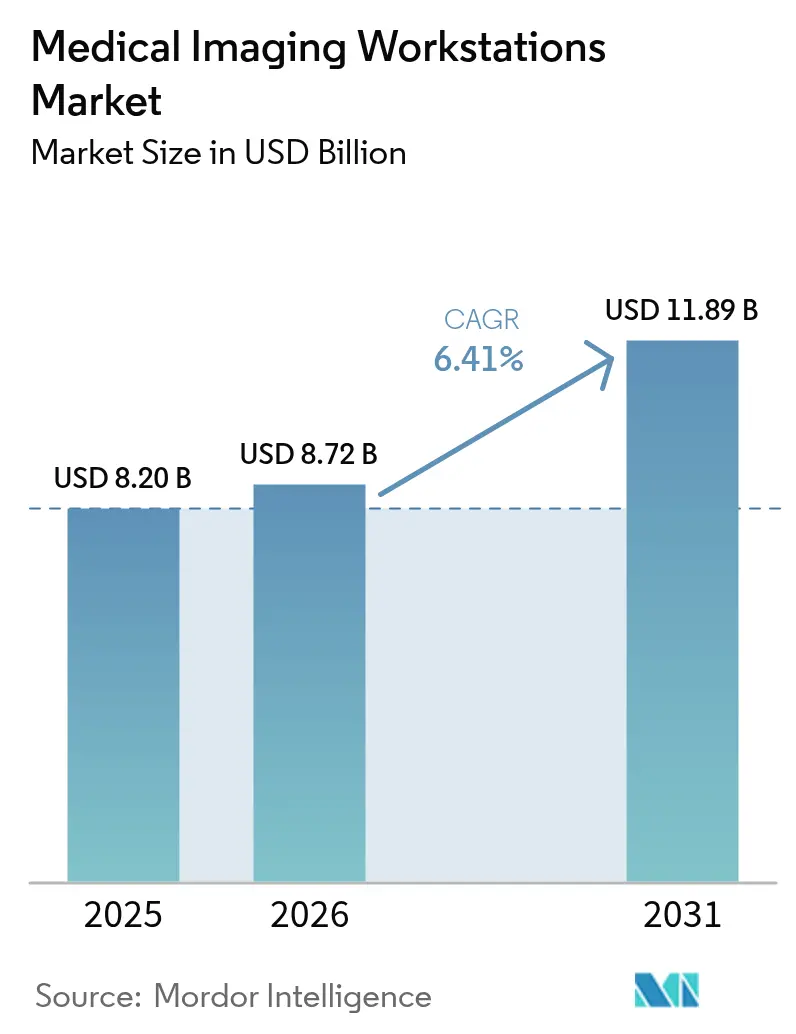
| Market Size (2026) | USD 8.72 Billion |
| Market Size (2031) | USD 11.89 Billion |
| Growth Rate (2026 - 2031) | 6.41 % |
| Fastest Growing Market | Asia Pacific |
| Largest Market | North America |
| Market Concentration | Medium |
Major Players *Disclaimer: Major Players sorted in no particular order Image © Mordor Intelligence. Reuse requires attribution under CC BY 4.0. | |
Medical Imaging Workstations Market Analysis by Mordor Intelligence
The Medical Imaging Workstations Market size was valued at USD 8.20 billion in 2025 and estimated to grow from USD 8.72 billion in 2026 to reach USD 11.89 billion by 2031, at a CAGR of 6.41% during the forecast period (2026-2031). Faster replacement cycles, enterprise picture-archiving migrations, and rising multi-modality procedure complexity collectively lift demand for advanced visualization platforms. Regulatory clarity, such as the FDA’s re-classification of computer-assisted detection software into Class II, has shortened innovation lead times and lowered entry barriers.[1] Vendors now prioritize AI-ready designs and cloud-hosted delivery models that cut on-premises hardware costs, an approach that also helps hospitals cope with workforce shortages. North America keeps a performance edge through early AI adoption and mature reimbursement pathways, yet Asia Pacific records the fastest usage expansion on the back of large-scale digitization projects. Meanwhile, semiconductor supply constraints continue to throttle GPU availability, stretching lead times for high-end configurations and forcing some buyers toward thin-client alternatives.
Key Report Takeaways
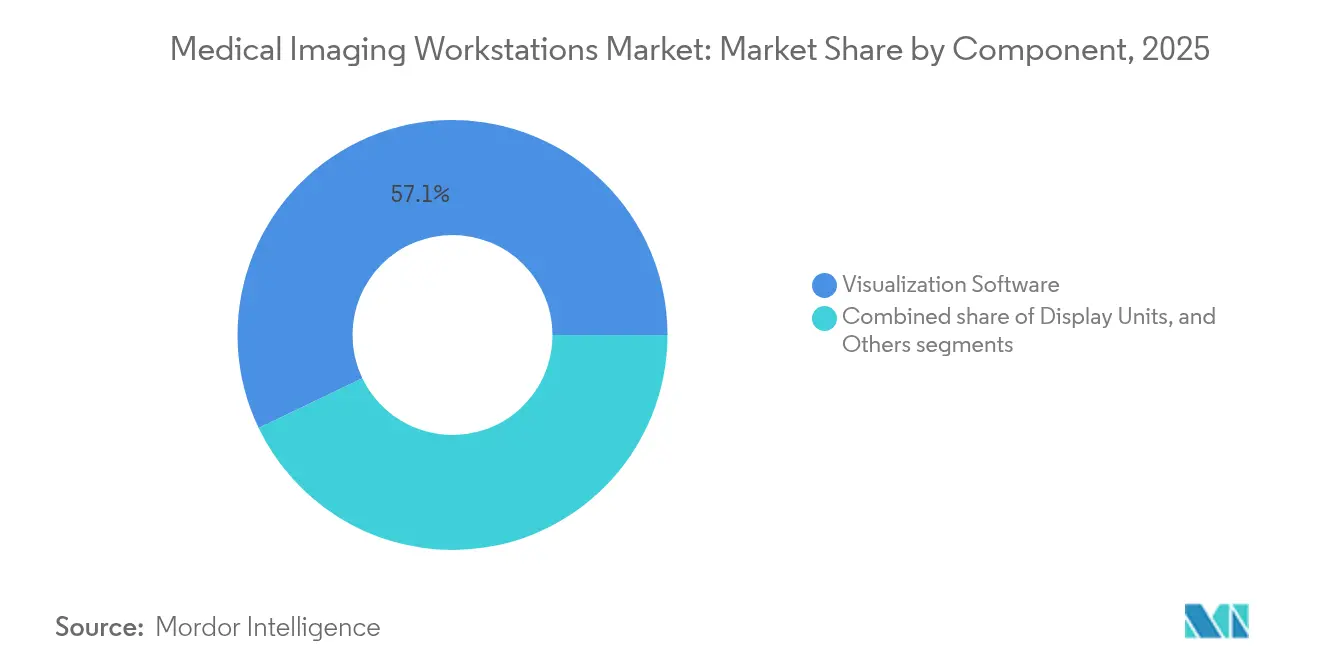
- By component, visualization software led with 57.12% revenue share in 2025, while display units are projected to advance at a 7.54% CAGR through 2031.
- By modality, Computed Tomography (CT) held 30.28% of the medical imaging workstations market share in 2025; mammography is positioned to grow at an 7.82% CAGR to 2031.
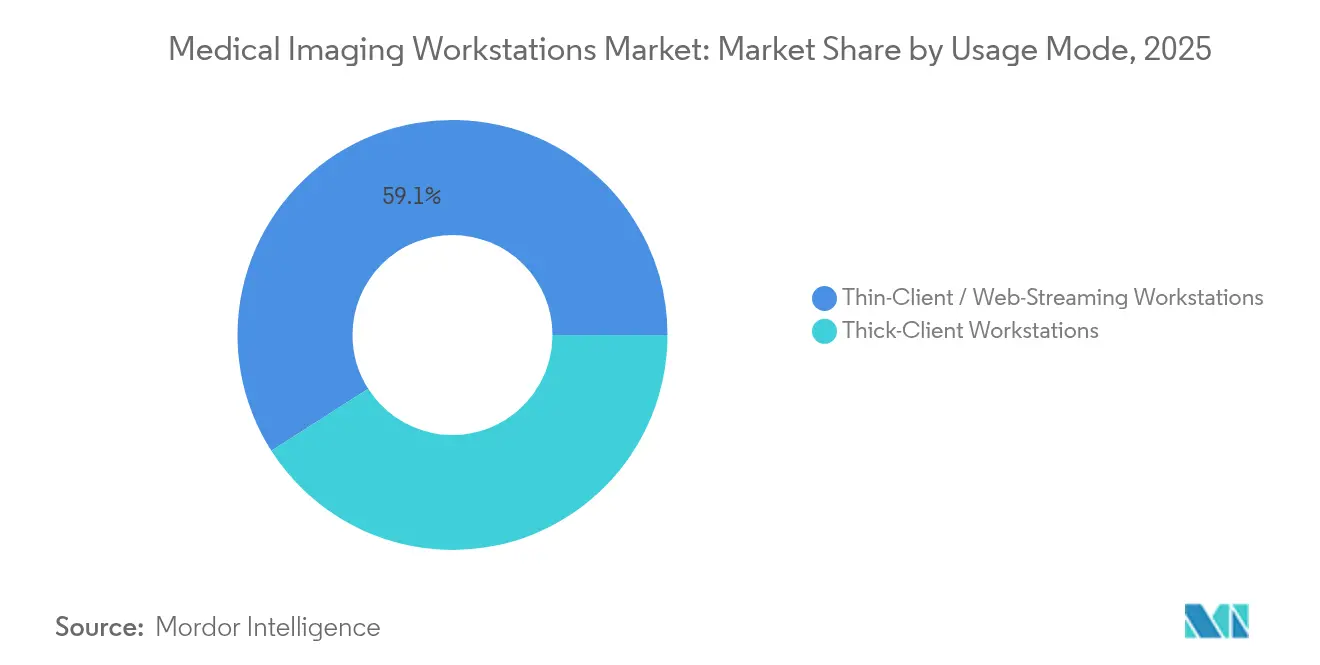
- By usage mode, thin-client/web-streaming platforms captured 59.05% of the medical imaging workstations market size in 2025; thick-client systems show a 6.93% CAGR outlook.
- By end-user, hospitals accounted for 61.40% of 2025 revenue, whereas diagnostic imaging centers are set to expand at an 7.62% CAGR over the forecast period.
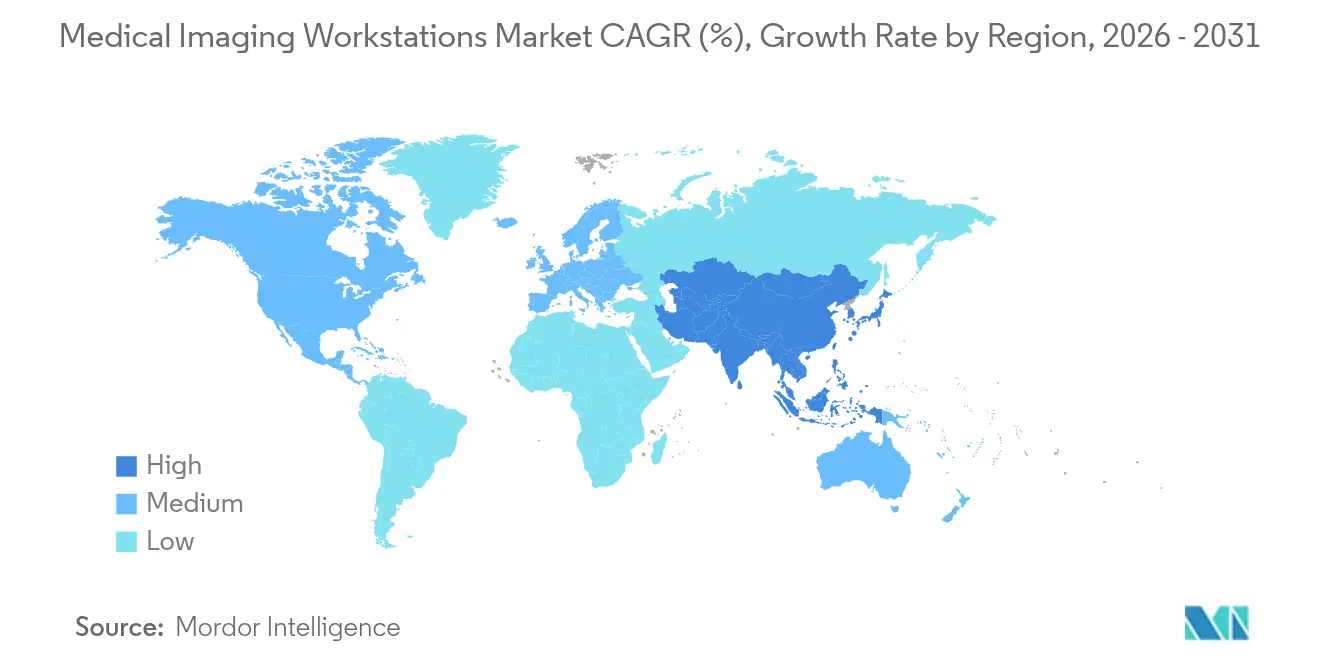
- By geography, North America commanded 37.32% of 2025 revenue; Asia Pacific exhibits the fastest regional CAGR at 8.02% through 2031.
Note: Market size and forecast figures in this report are generated using Mordor Intelligence’s proprietary estimation framework, updated with the latest available data and insights as of 2026.
Global Medical Imaging Workstations Market Trends and Insights
Drivers Impact Analysis*
| Driver | (~) % Impact on CAGR Forecast | Geographic Relevance | Impact Timeline |
|---|---|---|---|
| Rapid technological evolution in imaging modalities | +1.8% | Global, with early adoption in North America & EU | Medium term (2-4 years) |
| Growing imaging procedure volumes in emerging markets | +1.5% | APAC core, spill-over to MEA and Latin America | Long term (≥ 4 years) |
| Rising healthcare expenditure coupled with rising disease burden | +1.2% | Global, particularly pronounced in aging populations | Long term (≥ 4 years) |
| Accelerated healthcare digitization—enterprise PACS/VNA migrations | +1.0% | North America & EU leading, APAC following | Medium term (2-4 years) |
| Ongoing innovations in hospital and diagnostic center infrastructure in emerging economies | +0.8% | APAC, MEA, Latin America | Long term (≥ 4 years) |
| Vendor-neutral API ecosystems enabling SaaS visualization plug-ins | +0.6% | Global, with technology leaders in North America | Short term (≤ 2 years) |
| Source: Mordor Intelligence | |||
Rapid technological evolution in imaging modalities
Photon-counting CT, whole-body MRI screening, cone-beam breast CT, and autonomous ultrasound together raise the computational ceiling for every workstation refresh cycle. Photon-counting scanners cut radiation exposure by as much as 80% while quadrupling raw data volume, demanding GPUs that support real-time 3-D reconstructions. GE HealthCare and NVIDIA’s collaboration shows how vendors are embedding AI inference at the image-acquisition layer, which in turn obliges workstation software to orchestrate automated segmentation, triage, and quality control. Prenuvo’s AI-enabled whole-body MRI platform reinforces the shift toward multi-organ analysis, compelling vendors to design workstations with higher throughput, larger cache, and multi-monitor ergonomics.[2]
Growing imaging procedure volumes in emerging markets
Continual CT and MRI installation programs across Asia Pacific generate follow-on demand for visualization upgrades. Demographic aging lifts per-capita scan rates, particularly for oncology and cardiac imaging, which rely on sophisticated post-processing. Canon Medical’s India strategy signals manufacturers’ broader pivot to mid-income countries whose health ministries are funding picture-archiving rollouts alongside hardware refresh cycles. Ethiopia’s 71% reduction in patient waiting time after teleradiology deployment underscores how thin-client workstations connect remote hospitals to scarce radiologists.[3] Scalable cloud access therefore becomes a core purchasing criterion for facilities that lack on-site IT teams.
Rising healthcare expenditure coupled with disease burden
Cardiovascular disease prevalence propels adoption of cardiac-focused CT workstations such as GE HealthCare’s Revolution Vibe that performs one-beat coronary scans and auto-extracts functional data. Expanding breast and lung cancer screening programs require platforms tuned for 3-D mammography and low-dose CT navigation. Precision-medicine initiatives integrate genomic dossiers with radiology findings, prompting vendors to embed multimodal viewers capable of fusing omics and imaging. Point-of-care ultrasound adoption in emergency care raises the need for compact carts that offer diagnostic-grade displays and AI-driven annotation. Every dollar that health systems allocate to outcome-based reimbursement incentivizes investments in software that trims repeat exams.
Accelerated healthcare digitization—enterprise PACS/VNA migrations
Hospitals increasingly migrate from siloed PACS toward cloud-native, vendor-neutral archives that consolidate imaging across radiology, cardiology, and pathology. Recent FDA guidance exempting certain imaging-management functions from clearance has simplified upgrades to modular software stacks. Cloud PACS providers remove the need for on-premises servers and enable zero-footprint viewers, letting radiologists read from any web browser while maintaining diagnostic fidelity. AI-powered work-list orchestration plugs directly into these archives, automatically flagging critical cases and routing studies to subspecialists, which lifts throughput without adding headcount.
Restraints Impact Analysis*
| Restraint | (~) % Impact on CAGR Forecast | Geographic Relevance | Impact Timeline |
|---|---|---|---|
| High upfront & lifecycle costs of premium workstations | -1.4% | Global, particularly acute in price-sensitive emerging markets | Medium term (2-4 years) |
| Shortage of radiologists / advanced visualization specialists | -1.1% | Global, most severe in North America and EU | Long term (≥ 4 years) |
| Escalating zero-trust cybersecurity & HIPAA compliance expenses | -0.8% | North America & EU primarily, expanding globally | Short term (≤ 2 years) |
| GPU foundry capacity constraints & supply-chain shocks | -0.7% | Global, with particular impact on high-performance workstations | Medium term (2-4 years) |
| Source: Mordor Intelligence | |||
High upfront and lifecycle costs of premium workstations
Capital budgets still favor direct patient-care devices over support infrastructure. Total cost of ownership often doubles initial price once multiyear service contracts and software renewals are included. Smaller facilities look at certified refurbished hardware, yet those bargains often lack modern GPUs, throttling AI performance. Subscription software can smooth out capital spikes; however, cumulative fees sometimes exceed perpetual licenses over a seven-year horizon. Reimbursement erosion in radiology magnifies financial scrutiny, stretching procurement cycles.
Shortage of radiologists / advanced visualization specialists
More than 1,400 U.S. radiology positions remained vacant in 2024, a gap that technology alone cannot close. Advanced workstations ship with AI modules that promise efficiency; however, they still need trained users who understand nuanced parameters. Burnout accelerates early retirements, shrinking effective workforce capacity. Subspecialty shortages in cardiac and interventional imaging highlight how skill gaps directly limit workstation utilization.
*Our forecasts treat driver/restraint impacts as directional, not additive. The impact forecasts reflect baseline growth, mix effects, and variable interactions.
Segment Analysis
By Component: Software Dominance Drives Innovation
Visualization software generated 57.12% of 2025 revenue, illustrating how functionality now sits in code rather than bespoke hardware. That dominance will widen as vendors decouple algorithm licenses from display purchases, allowing rapid over-the-air updates. Subscription AI-segmentation plug-ins create recurring revenue streams and shorten feature lead times. Display units, in contrast, post the fastest 7.54% CAGR because 4 K and 8 K resolutions reduce diagnostic uncertainty in microcalcification and lung-nodule review. EIZO’s RadiForce RX670 with six-megapixel resolution and USB-C docking typifies ergonomic gains that minimize cable clutter.
Component convergence also guides procurement: thin-client setups shift value from local GPUs into centralized processing nodes, while auto-calibration and comfort-lighting features lift display ASPs. As more facilities aim for remote reading, zero-footprint viewers embedded in the hospital information system remove the last dependency on proprietary graphics cards. Consequently, software’s proportion of the medical imaging workstations market will continue to grow more rapidly than any hardware line item.

By Modality: CT Leadership Faces Mammography Disruption
Computed tomography workstations controlled 30.28% of 2025 revenue on the back of multi-organ utility and photon-counting upgrades. The segment benefits from enterprise standardization, as a single CT viewer can serve trauma, oncology, and cardiac cases. Mammography platforms, however, register the fastest 7.82% CAGR as national screening programs expand and 3-D tomosynthesis becomes common. Cone-beam breast CT’s elimination of breast compression will further raise data loads and justify workstation refresh investments.
MRI workstations gain momentum from helium-free magnet launches that ease siting constraints. Ultrasound, historically attached to hardware consoles, now leverages cloud-based post-processing that extracts automated measurements from raw cine loops. Nuclear-medicine workstation innovation hinges on digital detectors, which reduce recon time and cut dose while enabling total-body PET acquisitions.
By Usage Mode: Thin-Client Architecture Transforms Deployment
Thin-client and web-streaming configurations captured 59.05% of the medical imaging workstations market size in 2025. Hospitals accelerated remote-reading setups during the pandemic, realizing lasting productivity gains when radiologists could log in from home with the same credentials used on-site. Centralized compute pools simplify maintenance because GPU updates roll out once to a data center rather than to dozens of desks. Thick-client rigs remain essential for niche tasks such as cinematic-rendering and large-volume AI model training, which justifies their 6.93% CAGR.
Hybrid edge strategies now blend local SSD cache with cloud object storage, balancing latency and resiliency. Zero-footprint viewers embedded in EHR portals remove all installation barriers and open new possibilities for mobile reading. Encryption standards like TLS 1.3 ensure that web-streamed studies remain HIPAA-compliant without VPN overhead, an increasingly important point as ransomware risks climb.
By End-User: Hospital Consolidation Drives Procurement Patterns
Hospitals accounted for 61.40% of 2025 revenue due to multi-department imaging demand and sizable capital budgets. Consolidation among U.S. hospital groups creates bulk purchasing leverage, encouraging single-vendor framework agreements that bundle workstation, PACS, and service contracts. Meanwhile, diagnostic imaging centers demonstrate a 7.62% CAGR because payers steer non-urgent CT and MRI out of inpatient facilities to lower costs. These centers value fast image upload, one-click reporting, and pay-per-use AI that sidesteps upfront licenses.
Specialty clinics seek role-specific platforms, such as cardiovascular visualization suites that fuse CT angiography with intravascular ultrasound. Research institutions require open-API access for algorithm prototyping, whereas veterinary facilities prioritize ruggedized hardware that tolerates dust and variable temperature. Teleradiology service providers opt for cloud-native workstations, sharing compute across global reading teams while maintaining regional data-sovereignty compliance.
Geography Analysis
North America contributed 37.32% of 2025 revenue as U.S. and Canadian providers remained early adopters of AI triage tools and autonomous image acquisition. The region benefits from well-defined CPT codes that reimburse advanced procedures, allowing hospitals to recoup workstation investments quickly. A mature vendor ecosystem accelerates innovation cycles, with 300+ FDA-cleared AI algorithms already available for integration.
Asia Pacific recorded an 8.02% CAGR outlook driven by ongoing hospital build-outs, government cloud-health programs, and rapidly aging populations. China continues to scale provincial teleradiology hubs that connect county hospitals to tertiary centers, while India’s Ayushman Bharat scheme boosts diagnostic volumes in secondary cities. Many new facilities bypass legacy PACS and deploy cloud-native archives from day one, favoring thin-client architectures that minimize local IT staffing.
Europe shows steady expansion as the European Health Data Space initiative encourages cross-border image exchange, nudging hospitals toward interoperable viewers. National breast-screening extensions in Germany and France stimulate adoption of 3-D mammography workstations, while UK NHS modernization funds support AI-assisted CT lung-screening pilots.
In the Middle East and Africa, public-private partnerships fund flagship imaging centers, yet political volatility and exchange-rate swings can delay procurement.
Latin America gains traction through regional trade agreements that cut import duties on diagnostic hardware, though inconsistent broadband coverage limits thin-client rollouts in rural sites.
Regulatory Landscape
Medical imaging workstations that support picture archiving and communication functions commonly fall under medical-device frameworks such as U.S. FDA radiology device regulations, including PACS-related classifications under 21 CFR 892. These products generally use Class II controls and 510(k) pathways when applicable. Compliance obligations extend beyond premarket submissions to lifecycle requirements, including Quality Management System Regulation (QMSR) under 21 CFR Part 820 and postmarket reporting under 21 CFR Part 803, which drives ongoing documentation and validation for workstation software updates and integrations.
For global coverage, the EU Medical Device Regulation (MDR 2017/745) reinforces risk-based classification and post-market surveillance for imaging software and connected components, with added emphasis on clinical evaluation, cybersecurity, and change control. Interoperability and display performance expectations are tied to consensus standards and profiles that buyers and vendors use for integration and acceptance, including DICOM (NEMA PS3) through product-specific DICOM Conformance Statements. For example, Philips published a DICOM Conformance Statement for Advanced Visualization Workspace v15.1.3 in June 2026. Other anchors include IEC 60601-1 for safety and essential performance, and IEC 62563-1 for medical image display evaluation methods used in diagnostic interpretation environments.
Competitive Landscape
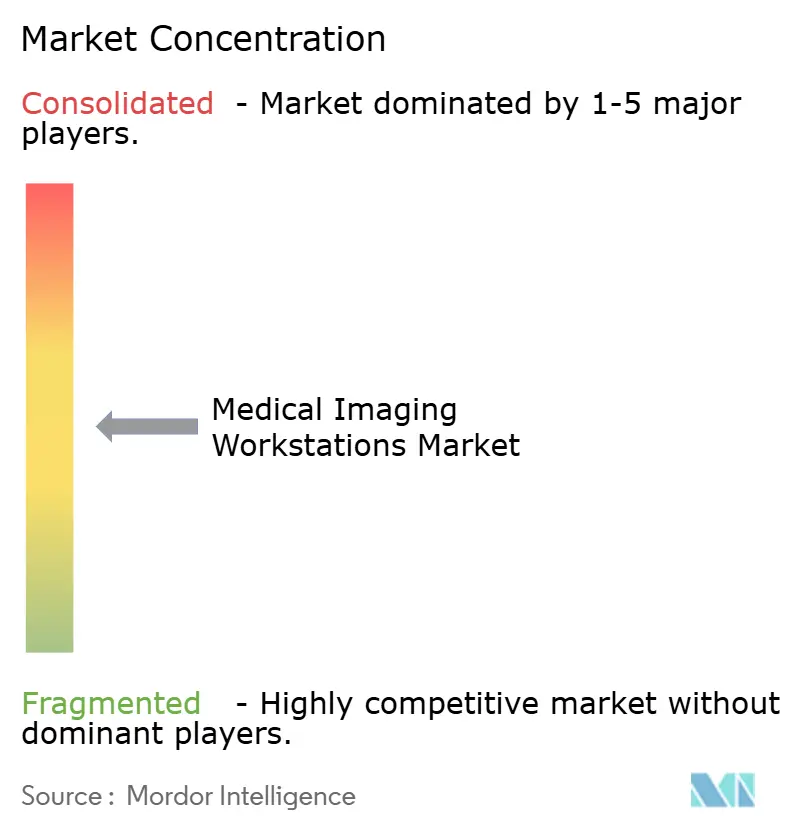
The medical imaging workstations market remains moderately consolidated. GE HealthCare’s USD 51 million purchase of Intelligent Ultrasound and its agreement to take over MIM Software illustrate the race to fold specialty AI into mainstream platforms. Siemens Healthineers counters by embedding OpenRecon AI across its syngo.via viewers, while Philips deepens Spectral CT post-processing inside IntelliSpace. Hardware-display specialists such as EIZO partner with PACS vendors to certify color calibration for remote reading.
GPU shortages elevate supply-chain agility into a competitive differentiator because vendors that lock early allocations can ship premium thick-client rigs on schedule. FDA re-classification of CAD software into Class II decreased time-to-market for AI features, rewarding firms with agile R&D pipelines.
Interoperability remains a purchase-deciding factor: hospitals prefer vendors that embrace DICOMweb and FHIR to future-proof integrations. Overall, the competitive frontier is shifting toward platform breadth—hardware, cloud services, and native AI—rather than isolated point solutions.
Medical Imaging Workstations Industry Leaders
-
Koninklijke Philips N.V.
-
GE HealthCare
-
Siemens Healthineers AG
-
Canon Medical Systems Corporation
-
PaxeraHealth
- *Disclaimer: Major Players sorted in no particular order
Market Opportunities and Future Outlook
Cloud-native, zero-footprint diagnostic viewing and enterprise imaging consolidation are creating whitespace for workstation platforms that reduce reliance on dedicated thick-client hardware while keeping diagnostic-grade performance. This shift is reinforced by multiple FDA-cleared viewer moves in 2026, including GE HealthCare receiving U.S. FDA 510(k) clearance in March 2026 for View, positioned as the core of its Genesis Radiology Workspace, and CliniComp receiving U.S. FDA 510(k) clearance in July 2026 for a PACS Viewer (MIMPS) that integrates diagnostic imaging and native AI within its EHR platform. For buyers, these deployments broaden procurement options around SaaS licensing, centralized GPU compute, and browser-based access across hospitals and diagnostic imaging centers, aligning with the market reality that thin-client and web-streaming accounted for 59.05% of 2025 revenue.
AI-native workflow integration and standards-based interoperability also expand opportunity for vendors that embed prioritization, overlays, and structured outputs directly into the diagnostic viewer, rather than as separate applications. These systems need to support DICOMweb-based pipelines alongside legacy DIMSE connectivity. The shift toward PACS 3.0 architectures, discussed in 2026 academic and industry forums, points to demand for workflow-centered intelligence and bidirectional interaction between AI services and viewers. Vendor actions around hardware-agnostic reading environments further widen the addressable settings for workstation software, illustrated by Visage Imaging highlighting AI-optimized innovations for Visage 7 CloudPACS in June 2026 and demonstrating diagnostic interpretation on Apple hardware, which supports IT simplification strategies in facilities managing GPU supply constraints and remote reading needs.
Recent Industry Developments
- July 2026: CliniComp received US FDA 510(k) clearance for its PACS Viewer (MIMPS), positioning diagnostic-quality viewing and native AI within its EHR platform. The clearance supports enterprise imaging deployments that favor integrated clinical workflows over stand-alone viewing stations. It also raises competitive pressure on workstation vendors to offer tighter EHR-context integration and governed AI experiences inside the primary viewer.
- March 2026: GE HealthCare received US FDA 510(k) clearance for View, a zero-footprint diagnostic viewer that serves as a core component of the Genesis Radiology Workspace. The clearance strengthens cloud-first delivery models for diagnostic viewing and supports broader adoption of thin-client reading patterns across hospitals and imaging centers. It also signals continued vendor investment in regulated, web-based viewers that can be updated faster than conventional workstation footprints.
- November 2025: Philips received US FDA 510(k) clearance for the latest release of Cardiovascular Workspace (IntelliSpace Cardiovascular), including cloud-hosted and SaaS deployment options. The update expands regulated pathways for cloud-delivered advanced visualization in cardiology workflows, an area with high post-processing intensity. It also reinforces the market shift toward subscription-capable workstations that combine imaging review, quantification, and reporting in a single environment.
Research Methodology Framework and Report Scope
Market Definition and Coverage
For this methodology, the market covers dedicated medical imaging workstations used to process, visualize, and manage diagnostic images generated by imaging modalities in clinical workflows, including both thick-client and thin-client access where used for diagnostic viewing.
Scope exclusions: Generic office PCs, PACS archive servers, and service-only contracts are excluded from the market totals.
Segmentation Overview
- By Component
- Visualization Software
- Display Units
- Others
- By Modality
- Computed Tomography (CT)
- Magnetic Resonance Imaging (MRI)
- Ultrasound
- Mammography
- Others
- By Usage Mode
- Thick-Client Workstations
- Thin-Client / Web-Streaming Workstations
- By End-User
- Hospitals
- Diagnostic Imaging Centers
- Specialty Clinics
- Others
- By Geography
- North America
- United States
- Canada
- Mexico
- Europe
- Germany
- United Kingdom
- France
- Italy
- Spain
- Rest of Europe
- Asia Pacific
- China
- Japan
- India
- Australia
- South Korea
- Rest of Asia Pacific
- Middle East and Africa
- GCC
- South Africa
- Rest of Middle East and Africa
- South America
- Brazil
- Argentina
- Rest of South America
- North America
Data Sources, Market Sizing, and Validation
Desk Research
Desk work starts with collecting stable reference data that sets boundaries for the market model, and then it is supplemented with industry signals that explain demand. Public sources such as the World Health Organization, OECD health statistics, and government health departments are used for imaging activity and capacity context. For device clearances and intended-use language, we rely on US FDA sources to separate workstation classes.
To keep assumptions grounded, we also review radiology journals for workflow trends, hospital association publications for capital-spending direction, and public company filings and investor presentations for revenue mix and geographic exposure cues. Where useful, paid subscriptions are used for company financials and intelligence, along with patent databases and shipment-level import and export data to cross-check supply chain movement and pricing signals. These sources are not exhaustive, and other public documents and datasets were also used for data collection, validation, and clarification.
Primary Interviews and Surveys
Primary inputs were built through expert interviews and structured surveys with workstation manufacturers and distributors, plus hospital and imaging-center stakeholders who influence procurement and day-to-day usage. Because this is a global market, we used calls across APAC, EMEA, and the Americas to test key assumptions such as replacement timing, thin-client adoption, and typical pricing by configuration. Any large variances were then rechecked through follow-up discussions.
Distribution of primary research fieldwork respondents
| Company type | Respondent position | Region |
|---|---|---|
| Top tier: 28% | CXOs: 14% | APAC: 50% |
| Mid tier: 57% | Functional/Unit leaders: 34% | EMEA: 31% |
| Smaller Players: 15% | Managers: 52% | Americas: 19% |
Market-Sizing & Forecasting
Our sizing logic starts with a top-down build where imaging procedure volumes, the installed base of imaging modalities, and facility counts are used to reconstruct the addressable demand pool for diagnostic viewing and advanced visualization workstations. After that, we corroborate totals with selective bottom-up approximations, using sampled ASP times unit volumes by workstation class and channel checks on shipment mix, which helps adjust for configuration differences and purchasing routes.
Key inputs include the pace of CT and MRI installations, radiology reading volumes and reporting backlogs, workstation hardware replacement cycles, the share of thin-client deployment versus thick-client setups, and ASP movement linked to GPU requirements and high-resolution display needs. When a geography lacks clean public signals, we handle the gap using proxy indicators like hospital imaging capacity and income-adjusted healthcare spend, then correct through primary feedback. For forecasting, scenario analysis is used so growth reflects different adoption speeds for visualization capabilities delivered through AI-enabled workflows and web-based access, and these scenarios are aligned to what interviewees report in procurement plans and IT refresh schedules.
Data Validation & Update Cycle
Validation is done by checking whether model outputs align with independent signals such as modality shipment trends, hospital capital spending direction, and reasonable workstation-to-modality or workstation-to-reader ratios. Outliers are reviewed step-by-step, first by rechecking unit definitions and currency timing, and then by having another analyst review the logic and key inputs before sign-off.
When a major variance shows up, for example an abrupt pricing shift or a change in thin-client penetration, respondents are re-contacted to confirm what is changing and whether it is temporary or structural. Reports are refreshed annually, with interim updates when material events occur, such as policy changes, supply constraints, or notable workflow shifts. Before delivery, a final pass is completed so clients receive the most current view that matches the latest public releases and primary feedback.
Mordor Intelligence's Medical Imaging Workstation Market Size Versus Other Published Estimates
Published market sizes for medical imaging workstations often differ because the scope boundary is drawn differently, and because pricing and deployment assumptions are handled in different ways. Variations can also come from the year used for sizing, currency conversion timing, and how much primary checking is applied when public data is limited.
The table shows a noticeable spread across reported values. In Mordor Intelligence's model, the total reflects dedicated diagnostic imaging workstations (including thin-client access used for diagnostic viewing) while leaving out generic PCs, PACS archive servers, and service-only contracts, which can shift the counted revenue base. Another common gap is whether advanced visualization software is treated as part of the workstation bundle or counted in adjacent software markets, and whether ASPs are progressed using component cost signals versus broader inflation.
Benchmark comparison
| Source | Market Size | Gaps in Research Methodology |
|---|---|---|
| Mordor Intelligence | USD 8.72 B (2026) | |
| Global Consultancy A | USD 9.31 B (2024) | Uses an earlier sizing year and does not clearly separate workstation revenue from adjacent imaging IT items, so bundled software and broader workflow tools can lift the total. |
| Industry Publisher B | USD 4.46 B (2024) | Leans on a narrower revenue definition and lower implied ASPs, and it may exclude parts of diagnostic viewing and advanced visualization counted when systems are used as full imaging workstations. |
Overall, the differences are mostly explained by what is counted as a workstation sale, how thin-client and software value are treated, and which year anchors the estimate. By keeping the scope tied to diagnostic workstation use and rechecking key ratios and pricing with primary respondents, the resulting market size stays linked to clear variables and repeatable steps.
Key Questions Answered in the Report
What is the current value of the medical imaging workstations market?
The medical imaging workstations market size stands at USD 8.72 billion in 2026 and is projected to climb to USD 11.89 billion by 2031.
Which component segment leads the market in revenue?
Visualization software dominates with 57.12% of 2025 revenue, underscoring the shift to software-defined imaging platforms.
Why are thin-client workstations gaining popularity?
Thin-client architectures centralize processing, support remote reading, and cut on-site IT costs, which helped them secure 59.05% of 2025 revenue.
Which region shows the fastest growth?
Asia Pacific is forecast to expand at an 8.02% CAGR through 2031 due to extensive hospital build-outs and national digitization programs.
How are AI integrations influencing workstation purchases?
FDA re-classification of CAD software and vendor acquisitions of AI firms are accelerating embedded analytics, making AI-ready platforms a top buying criterion.
What key restraint could slow market expansion?
High upfront and lifecycle costs, especially in price-sensitive markets, reduce procurement momentum despite evident clinical benefits.