
Medical Imaging Phantoms Market Size and Share
Market Overview
| Study Period | 2020 - 2031 |
|---|---|
| Market Size (2026) | USD 215.32 Million |
| Market Size (2031) | USD 268.02 Million |
| Growth Rate (2026 - 2031) | 4.49 % |
| Fastest Growing Market | Asia Pacific |
| Largest Market | North America |
| Market Concentration | Medium |
Major Players *Disclaimer: Major Players sorted in no particular order Image © Mordor Intelligence. Reuse requires attribution under CC BY 4.0. | |
Medical Imaging Phantoms Market Analysis by Mordor Intelligence
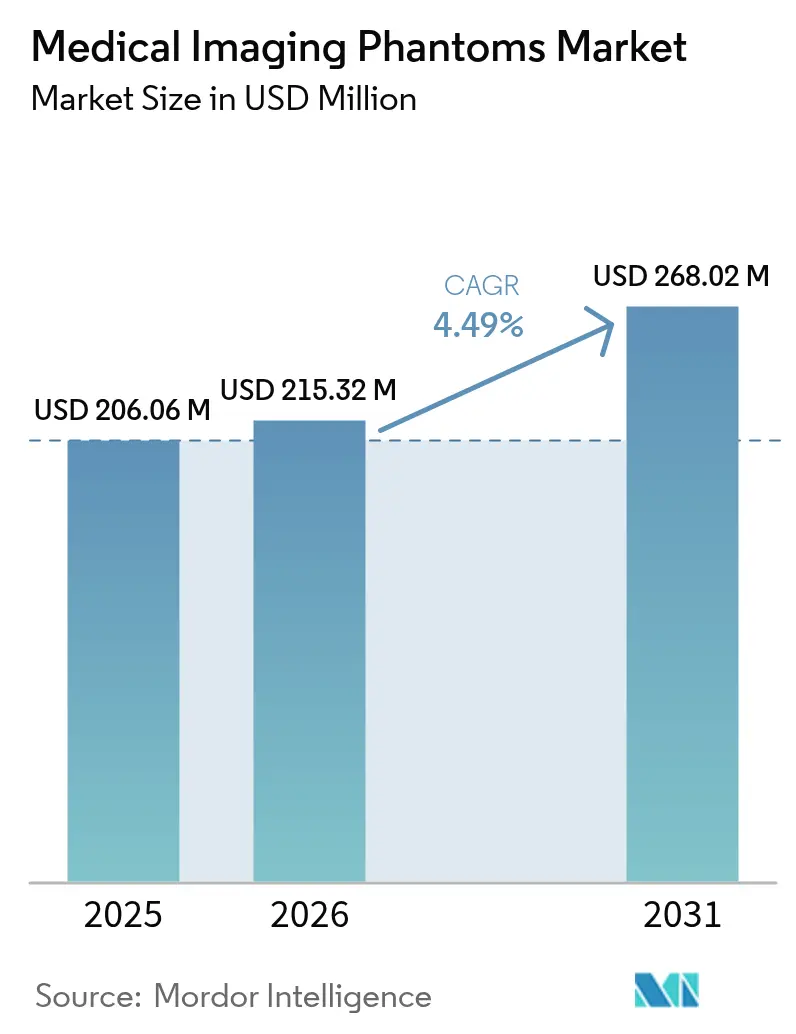
The Medical Imaging Phantoms market size is expected to grow from USD 206.06 million in 2025 to USD 215.32 million in 2026 and is forecast to reach USD 268.02 million by 2031 at 4.49% CAGR over 2026-2031. Growing accreditation requirements that link reimbursement to documented image quality keep procurement budgets stable, while 3D printing and smart polymers expand the technical reach of manufacturers. Hospitals still account for most purchases, yet quality-focused ambulatory imaging providers are quickly scaling orders as value-based care shifts volumes away from inpatient settings. Rapid adoption of AI-enabled auto-QA software shortens test cycles and encourages more frequent phantom checks, raising replacement rates. Material innovation that spans CT, MRI, and ultrasound in a single object cuts inventory costs for radiology departments, spurring multimodality phantom demand. Supply-chain tightness for elastography-grade polymers and radioactive gels continues to push lead times higher, but 3D-printed alternatives partly offset the gap.
Key Report Takeaways
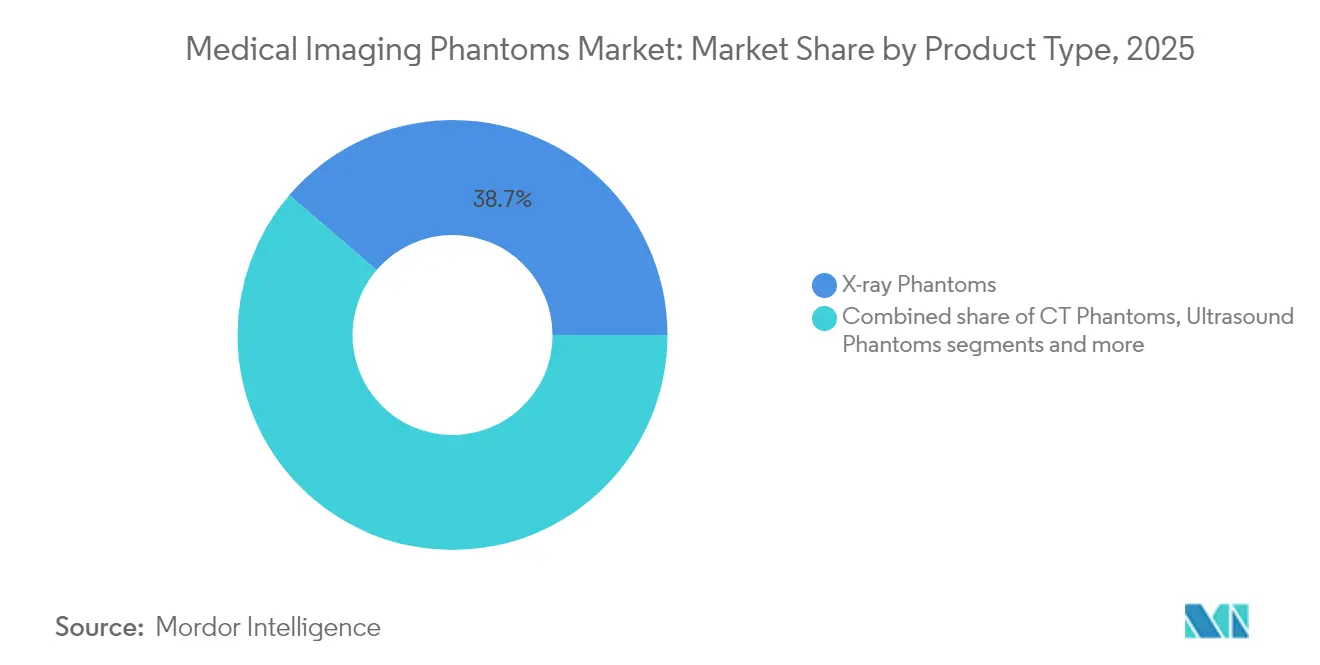
- By product type, X-ray phantoms led with 38.72% of the medical imaging phantoms market share in 2025, while CT phantoms are advancing at a 6.14% CAGR through 2031.
- By material, stimulating devices accounted for 56.14% of the medical imaging phantoms market size in 2025; false organs (anthropomorphic) phantoms post the fastest growth at 5.17% CAGR.
- By end user, hospitals captured 53.62% revenue share in 2025, whereas diagnostic imaging centers are expanding at a 5.86% CAGR to 2031.
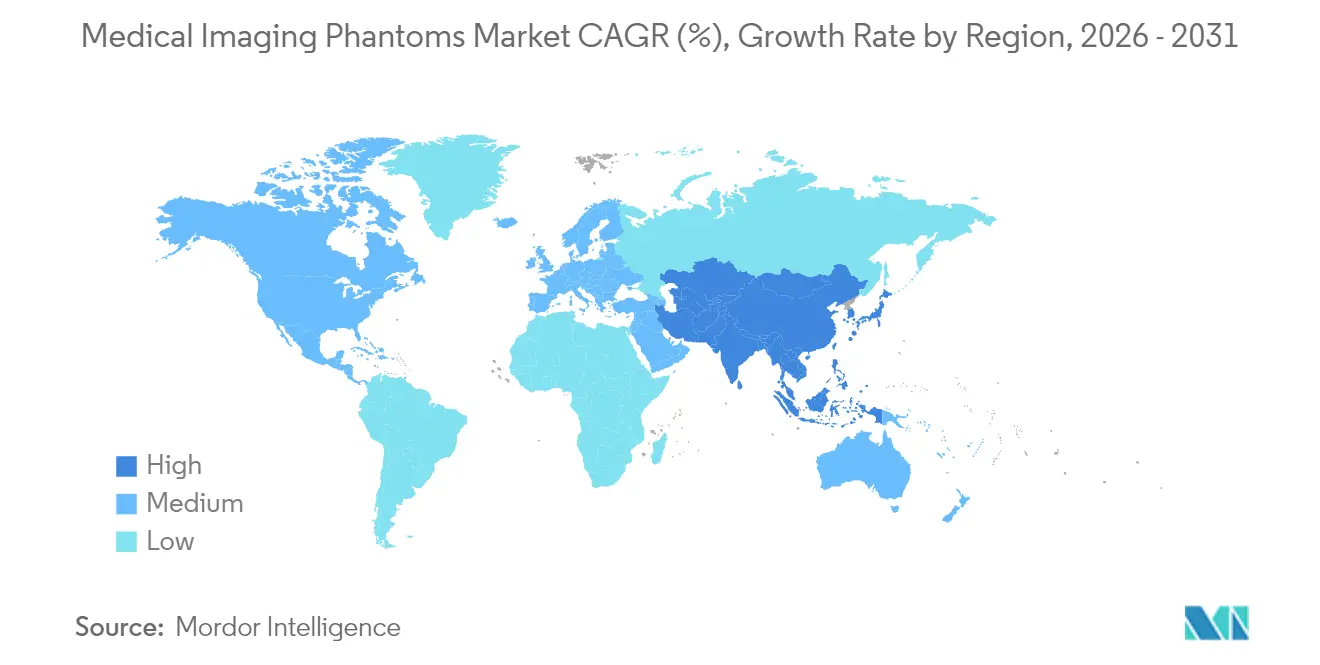
- By geography, North America dominated with 36.74% of the medical imaging phantoms market share in 2025; Asia Pacific records the highest projected CAGR at 6.05% through 2031.
Note: Market size and forecast figures in this report are generated using Mordor Intelligence’s proprietary estimation framework, updated with the latest available data and insights as of 2026.
Market Trends and Insights
Drivers Impact Analysis of Medical Imaging Phantoms Market*
| Driver | (~) % Impact on CAGR Forecast | Geographic Relevance | Impact Timeline |
|---|---|---|---|
| Escalating QA-stringency of value-based reimbursement programs | +1.2% | North America & EU | Medium term (2-4 years) |
| Surging adoption of 3-D printed, modality-agnostic phantoms | +0.8% | Global | Long term (≥ 4 years) |
| Rising installation of hybrid PET/CT & PET/MR scanners | +0.6% | APAC core, spill-over to MEA | Medium term (2-4 years) |
| Expanding radiology capacity in ambulatory imaging centers | +0.5% | North America & APAC | Short term (≤ 2 years) |
| AI-enabled auto-QA workflows cutting test-cycle time | +0.4% | Global | Long term (≥ 4 years) |
| Growing grant funding for photo-acoustic tomography validation | +0.3% | North America & EU | Long term (≥ 4 years) |
| Source: Mordor Intelligence | |||
Escalating QA-Stringency of Value-Based Reimbursement Programs
Mandatory CT phantom assessments that the Centers for Medicare & Medicaid Services will enforce from 2027 convert test objects from best-practice accessories into core compliance tools. The American College of Radiology ARCH-AI framework further embeds standardized phantom runs into AI validation workflows, tying algorithm reliability to phantom-verified metrics. Health systems now regard phantom purchases as revenue-protection spend, not discretionary outlays, anchoring the medical imaging phantoms market. Quality-based bonus pools in Medicare Advantage plans intensify uptake by rewarding documented imaging consistency.
Surging Adoption of 3-D Printed, Modality-Agnostic Phantoms
Additive manufacturing delivers patient-specific replicas within 0.1 mm geometric tolerance, while new PLA-PCL blends maintain CT, MRI, and ultrasound contrast in a single build.[1] NIH support for an Industry-University Cooperative Research Center focused on optical imaging phantoms signals sustained federal backing. Production of complex anthropomorphic units now costs under USD 250 and finishes in days instead of months.[2] Hybrid PET/MR and photoacoustic systems that need multi-energy calibration spur developers to design modality-agnostic phantoms, broadening the global medical imaging phantoms market footprint. The lower entry price of desktop stereolithography printers also empowers mid-tier radiology groups to fabricate on-site, shortening procurement cycles.
Rising Installation of Hybrid PET/CT & PET/MR Scanners
Asia Pacific hospital networks accelerate rollouts of PET/CT and PET/MR units in oncology and cardiology suites, increasing cross-calibration complexity. These integrated scanners require phantoms that align radiotracer distribution and MR signal uniformity within 2 mm spatial error across the full field of view.[3] Suppliers that combine low-attenuation plastics with MR-compatible shielding capture premium pricing. Regulators now reference phantoms in acceptance testing protocols for hybrid systems, making them a prerequisite for modality commissioning. The trend widens margins in the medical imaging phantoms market because hybrid systems carry larger service contracts that bundle QA consumables.
AI-Enabled Auto-QA Workflows Cutting Test-Cycle Time
Machine-vision algorithms now locate phantom markers and compute distortion metrics with sub-millimeter accuracy, reducing physicist review from hours to minutes. Continuous QA embedded in scanner firmware turns each patient scan into a quality check, lifting phantom wear rates and boosting reorder frequency. Early adopters report 40% fewer emergency maintenance calls because predictive analytics flag gradual performance drift. As AI becomes a standard feature, next-generation phantoms will ship with encrypted reference datasets that sync to AI dashboards, ensuring lock-step hardware-software validation.
Restraints Impact Analysis of Medical Imaging Phantoms Market*
| Restraint | (~) % Impact on CAGR Forecast | Geographic Relevance | Impact Timeline |
|---|---|---|---|
| Capital-intensive custom phantom prototyping | -0.7% | Global | Medium term (2-4 years) |
| Scarcity of elastography-grade tissue-mimicking polymers | -0.5% | Global | Long term (≥ 4 years) |
| Limited physicist bandwidth for advanced QA protocols | -0.4% | North America & EU | Short term (≤ 2 years) |
| Supply-chain volatility for high-purity radioactive gels | -0.3% | Global | Medium term (2-4 years) |
| Source: Mordor Intelligence | |||
Capital-Intensive Custom Phantom Prototyping
Developing a patient-specific anthropomorphic phantom can exceed USD 50,000 due to imaging, segmentation, multi-material printing, and validation costs.[4] Small suppliers find it difficult to recoup expenses in niche modalities, leading to consolidation and slower innovation. Academic teams often improvise do-it-yourself kits that vary in performance, undermining cross-site comparability. This capital barrier curbs the medical imaging phantoms market expansion in subspecialty domains.
Scarcity of Elastography-Grade Tissue-Mimicking Polymers
Replicating tissue stiffness from 1–200 kPa demands custom polymer blends, yet only a few vendors supply consistent batches at medical-grade purity. Disruptions in precursor chemicals compel manufacturers to stockpile, tying up working capital and extending delivery times. Research labs experiment with homemade silicones, but these variants often lack stable acoustic attenuation, limiting clinical acceptance. Growth in ultrasound and MR elastography therefore outpaces phantom availability, creating a drag on market volume.
*Our forecasts treat driver/restraint impacts as directional, not additive. The impact forecasts reflect baseline growth, mix effects, and variable interactions.
Medical Imaging Phantoms Market Segment Analysis
By Product Type:
X-ray Phantoms Lead Despite CT Growth AccelerationX-ray phantoms held 38.72% of the medical imaging phantoms market in 2025, a testament to mammography regulations that mandate routine test object scanning. Demand remains stable because the global installed base of digital radiography rooms vastly exceeds that of other modalities. The CT segment is picking up at a 6.14% CAGR as new dose-monitoring rules take effect, reflecting how evolving regulatory frameworks continuously reshape the medical imaging phantoms market size for slice-based imaging.
Manufacturers innovate with combination phantoms that house X-ray and CT inserts in one shell, lowering inventory requirements for smaller clinics. Ultrasound phantom makers focus on elastography features to match clinical expansion into liver, thyroid, and musculoskeletal assessments. MRI phantom demand remains uneven as helium supply challenges stall scanner installations, although quantitative imaging biomarkers spur interest in diffusion and T1/T2 calibration sets. Nuclear medicine phantoms chart steady orders tied to theranostic growth, where precise dosimetry becomes standard of care.

By Material:
Stimulating Devices Dominate While Anthropomorphic Solutions AccelerateStimulating devices commanded 56.14% medical imaging phantoms market share in 2025 because they satisfy daily QA checklists with simple geometric targets that are easy to position and interpret. These phantoms are cost-effective and durable, which appeals to high-volume centers. Anthropomorphic solutions, buoyed by rapid 3D printing advances, are expanding at 5.17% CAGR as surgeons and interventional radiologists require lifelike simulations.
Hybrid filament formulations now blend PLA with soft thermoplastic elastomers, creating dual-durometer parts that mimic bone and soft tissue in a single print run. Academic-industry consortia fast-track standard test protocols so data collected with new materials remains comparable across sites. Niche materials such as graphite-doped silicones for photoacoustic imaging are entering pilot production, widening choice but adding qualification burdens for quality managers.
By End User:
Hospitals Maintain Leadership as Diagnostic Centers SurgeHospitals captured 53.62% of the medical imaging phantoms market size in 2025, owing to wide modality mix and in-house physicist teams that execute weekly QA routines. Their equipment breadth—from fluoroscopy to PET/CT—necessitates broad phantom inventories. Diagnostic imaging centers are growing at 5.86% CAGR because payers steer non-acute exams to lower-cost settings, and such facilities adopt phantoms early to secure ACR accreditation needed for payer contracts.
Bundled service models, where phantom providers include cloud analytics and periodic calibration, appeal to outpatient chains that prefer predictable operating costs. Research institutes and original-equipment manufacturers comprise a smaller slice yet drive high-spec orders, such as deep-brain stimulation MRI phantoms for device compatibility tests.

Geography Analysis
North America Medical Imaging Phantoms Market
North America dominated with 36.74% of the medical imaging phantoms market in 2025, reflecting stringent FDA equipment performance rules and a dense imaging center network that completes frequent QA cycles. Hospitals invest in AI-linked phantoms to align with the ARCH-AI program, anchoring replacement demand. Government quality incentives compensate for higher labor costs, preserving healthy margins for suppliers.
APAC Medical Imaging Phantoms Market
Asia Pacific is the fastest-growing region at a 6.05% CAGR, supported by large-scale hospital build-outs and the transition of provincial centers to digital imaging. China funds hybrid PET/MR rollouts that need complex multimodality phantoms, while India’s National Accreditation Board for Testing mandates documented QA before licensure. Local manufacturing clusters in Shenzhen and Osaka lower import duties, yet premium inserts still rely on U.S. and European sources, sustaining international trade flows in the medical imaging phantoms market.
EMEA and South America Medical Imaging Phantoms Market
Europe posts steady gains as the Medical Device Regulation enforces traceability for QA accessories. Germany and the United Kingdom lead R&D partnerships that develop bio-resorbable phantom materials, while Scandinavian clinics pioneer remote phantom monitoring linked to centralized physics hubs. Middle East and Africa register emerging demand as Gulf hospitals position themselves as regional medical tourism centers, raising imaging quality benchmarks. South America grows more slowly due to fiscal constraints, although niche orders rise in Brazil’s private oncology sector.
Regulatory Landscape
Medical imaging phantoms sit within a compliance framework where regulators and accreditation bodies use phantom-based testing to demonstrate image quality and performance. In the United States, FDA expectations for device performance characterization and QA documentation support standardized phantom use alongside modality-specific quality programs, while the American College of Radiology (ACR) embeds phantom scans into accreditation workflows for modalities such as nuclear medicine. ACR updated its nuclear medicine phantom testing requirements and approved the phantom list effective April 30, 2026, reinforcing the need for centers to use specified phantom models and to keep protocols current as technical criteria change.
In Europe, Regulation (EU) 2017/745 (EU MDR) governs accessories and device-related QA tools, with classification determined by intended purpose and any active diagnostic components referenced under Annex VIII (including Rule 10 considerations). Traceability and measurement consistency also shape procurement requirements, with bodies such as NIST supporting national measurement traceability for phantom-based calibration and quantitative imaging consistency across modalities. Differences in how radiation acceptability and quality criteria are implemented across EU member states add complexity for suppliers supporting multi-country deployments, increasing the importance of documentation, batch traceability, and standardized test methods.
Competitive Landscape
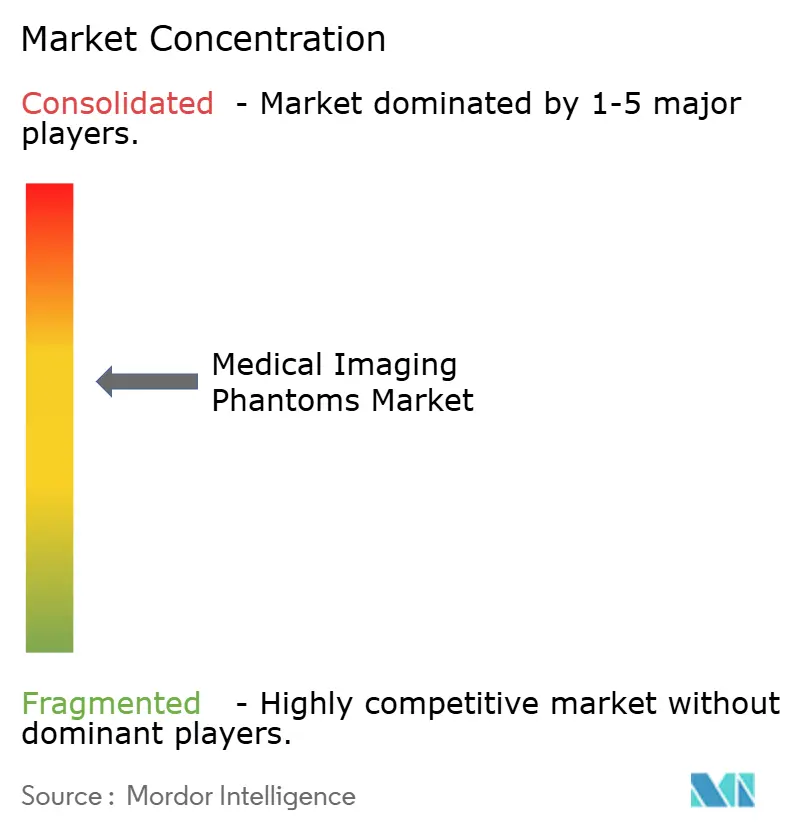
The market shows moderate fragmentation. Incumbents like CIRS, PTW Freiburg, Biodex Medical Systems, and Kyoto Kagaku specialize in discrete niches. Players differentiate through proprietary materials, software integration, and regulatory track record. Computerized phantoms bundled with AI analytics allow firms to command service premiums.
3D printing opens entry points for agile startups that deliver patient-specific products within 72 hours. Consolidation surfaces when radiation-therapy QA specialists acquire niche phantom assets to round out portfolios. Pricing pressure remains manageable because regulatory complexity and validation costs create natural moats, yet suppliers must invest continually in material science and software or face commoditization.
Supply-chain resilience becomes a differentiator. Companies securing elastography polymers through multi-year contracts or developing silicone alternatives avoid production delays that hurt smaller rivals. Strategic bottlenecks in radioactive gel sourcing prompt some vendors to pivot toward non-radioactive surrogates, positioning them for nuclear pharmacy shortages. Overall, competition favors firms that combine materials innovation, regulatory savvy, and data-centric software.
Medical Imaging Phantoms Industry Leaders
-
Gold Standard Phantoms
-
Biodex Medical Systems
-
Computerized Imaging Reference Systems (CIRS)
-
PTW Freiburg
-
Kyoto Kagaku
- *Disclaimer: Major Players sorted in no particular order
Medical Imaging Phantoms Market Companies Covered in this Report
- Bartec Technologies
- Biodex Medical Systems
- Carville
- Computerized Imaging Reference Systems (CIRS)
- Gold Standard Phantoms
- Kyoto Kagaku
- Leeds Test Objects
- Modus Medical Devices
- PTW Freiburg
- Pure Imaging Phantoms
- QUART
- True Phantom Solutions
- Dielectric Corporation
- The Phantom Laboratory
- QRM GmbH
- Capintec
- Radcal
- PhantomX
Market Opportunities and Future Outlook
Standardization initiatives that expand access to calibrated reference objects create opportunities for suppliers offering library-aligned, reproducible phantom solutions. The National Medical Phantom Library (NMPL), a joint initiative involving NIBIB, NIST, and the FDA, supports centralized access to calibrated phantoms, which aligns with the broader move toward phantom-based ground truth in device evaluation and quantitative imaging workflows. This setting supports value-add packages that pair phantoms with traceable documentation, digital reference datasets, and services aimed at helping imaging sites and developers demonstrate consistent performance across scanners and locations.
Technology-driven requirements are also extending beyond legacy geometric designs into modular, heterogeneous, and patient-specific formats that better reflect real clinical conditions. FDA work on method and phantom design for evaluating material quantification accuracy in contrast-enhanced spectral CT (June 2025) points to a concrete, modality-specific need for fit-for-purpose phantom designs in advanced CT. As multimodality and algorithm development workflows expand, manufacturers that can deliver 3D-printed, modality-agnostic or application-specific phantoms at shorter lead times, while managing polymer and gel supply constraints, can differentiate on turnaround time, reproducibility, and compatibility with automated QA and validation pipelines.
Recent Industry Developments in Medical Imaging Phantoms Market
- April 2026: The American College of Radiology (ACR) revised its nuclear medicine phantom testing guidance and updated the list of approved phantom models for accreditation, with the update dated April 30, 2026. The change tightens model-specific compliance and pushes imaging providers to refresh phantom inventories and QC workflows to remain aligned with accreditation requirements. This also raises the value of vendor documentation, traceability, and availability for phantoms referenced in accreditation checklists.
- December 2025: Stratasys expanded full commercial availability of its RadioMatrix radiopaque 3D printing material to the United States, targeting CT phantom creation and related imaging research workflows. Wider access to a purpose-built radiopaque material reduces friction for labs and imaging teams that fabricate phantoms in-house or through service bureaus. The move supports faster iteration of patient-specific and protocol-specific CT phantoms compared with traditional manufacturing cycles.
- November 2025: IBA announced the acquisition of PhantomX GmbH, adding anthropomorphic phantom capabilities to its quality assurance portfolio and strengthening its positioning in imaging QA and validation use cases. Bringing phantom design and manufacturing closer to QA solution delivery supports bundled offerings that connect physical test objects with analytics and workflow tools. The transaction also signals continued consolidation around specialized phantom know-how and differentiated materials in performance-driven segments.
Medical Imaging Phantoms Market Report Scope and Research Methodology
Market Definition and Coverage
This market covers the sales value of medical imaging phantoms that are used to test, calibrate, and verify diagnostic imaging performance, including routine quality checks, training, and research uses across common imaging modalities.
Scope exclusions: We exclude phantoms meant only for high-energy radiotherapy dose verification.
Segments Covered in This Report
- By Product Type
- X-ray Phantoms
- CT Phantoms
- Ultrasound Phantoms
- MRI Phantoms
- Nuclear Imaging Phantoms
- Others
- By Material
- Stimulating Devices
- False Organs (Anthropomorphic)
- Other Materials
- By End User
- Hospitals
- Diagnostic Imaging Centers
- Other End Users
- By Geography
- North America
- United States
- Canada
- Mexico
- Europe
- Germany
- United Kingdom
- France
- Italy
- Spain
- Rest of Europe
- Asia Pacific
- China
- Japan
- India
- Australia
- South Korea
- Rest of Asia Pacific
- Middle East and Africa
- GCC
- South Africa
- Rest of Middle East and Africa
- South America
- Brazil
- Argentina
- Rest of South America
- North America
Data Sources, Market Sizing, and Validation
Desk Research
Desk work starts by mapping the installed base of imaging systems and the specific quality requirements that drive phantom demand across sites. We use public sources such as the US Food and Drug Administration device databases, the US Centers for Medicare and Medicaid Services quality and reimbursement documentation, IAEA publications on imaging quality and safety, OECD health statistics, and peer reviewed papers indexed on PubMed that discuss QA frequency and phantom use.
We then validate how phantoms are bought and used through supplier catalogs, public tenders when available, import export statistics for relevant medical devices, and company filings and investor decks that describe imaging QA tools. Select paid subscriptions are used only for company financials and news, patent searches to track material and 3D printing trends, and shipment level trade visibility when the country customs coding is clear. This desk list is not exhaustive, and additional public sources were reviewed to fill gaps and confirm assumptions.
Primary Interviews and Surveys
Primary inputs come from interviews and short surveys with imaging QA specialists, radiology department managers, medical physics teams, distributors, and manufacturers that supply phantom products. For a global view, coverage is balanced across APAC, EMEA, and the Americas so the modality mix, QA cadence, and procurement cycles reflect local practice, and then we adjust the assumptions before final sign off.
Distribution of primary research fieldwork respondents
| Company type | Respondent position | Region |
|---|---|---|
| Top tier: 33% | CXOs: 19% | APAC: 45% |
| Mid tier: 48% | Functional/Unit leaders: 29% | EMEA: 36% |
| Smaller Players: 19% | Managers: 52% | Americas: 19% |
Market-Sizing & Forecasting
The main model uses a top-down build that reconstructs the demand pool from imaging system installations and usage, then converts that into phantom purchases through replacement and QA schedules. To keep the totals realistic, we corroborate the results with selective bottom-up checks, such as sampled price points by phantom category and a roll up of visible supplier revenues where reporting is clear, and then we adjust for channels that are not fully observable.
Key inputs include the imaging device installed base and procedure intensity, accreditation and QA requirements that set test frequency, replacement cycles by phantom material and wear, the mix of modalities (CT, MRI, ultrasound, nuclear imaging) in each region, and average selling price progression for standard versus specialized phantoms. Where bottom-up visibility is incomplete, the gap is handled through channel share assumptions validated by distributors and end users, then stress tested against import patterns and patent activity signals.
For forecasting, we use scenario analysis supported by short trend models so the outlook reflects changes in imaging volumes, hospital capex behavior, and adoption of newer phantom designs, including 3D printed products. Assumptions are reviewed with experts so the growth path does not hinge on a single year of procurement swings.
Data Validation & Update Cycle
Outputs are checked in more than one step so obvious overcounts and undercounts are caught early. We compare final market totals against independent signals such as imaging equipment base growth, procedure trends, and expected QA testing frequency, then any large variance is traced back to the input that caused it.
Before sign off, anomalies are reviewed by a second analyst and key assumptions are revisited with selected respondents when numbers move outside a reasonable range. The report is refreshed annually, and interim updates are triggered when material events occur, including major regulatory shifts, supply constraints, or abrupt capex changes. Right before delivery, a fresh data pass is completed so clients receive the latest updated view.
Mordor Intelligence's Medical Imaging Phantom Market Sizing Compared With Other Published Estimates
It is normal to see different market values published for medical imaging phantoms because firms do not always count the same products, years, and purchasing channels. Differences also come from how prices are averaged across standard phantoms versus specialized designs, and how often the model is updated when procurement patterns change.
Some estimates group in adjacent QA tools or broader training and simulation items, which pushes the total up, and they may also use faster price growth assumptions without checking modality level replacement behavior. In Mordor Intelligence, the count is limited to diagnostic imaging phantoms tied to calibration and quality assurance use, and radiotherapy only phantoms are kept out, which changes the addressable value even before growth math is applied.
Benchmark comparison
| Source | Market Size | Gaps in Research Methodology |
|---|---|---|
| Mordor Intelligence | USD 206.06 M (2025) | |
| Global Consultancy A | USD 191.60 M (2025) | Uses a different base series and growth window, and does not clearly state exclusions around radiotherapy-only phantoms or the pricing split between routine QA and specialized designs, which can compress the 2025 total. |
| Industry Data Publisher B | USD 163.22 M (2025) | Applies a narrower captured revenue view that appears to undercount distributor-led sales and smaller manufacturer volumes, and the scope notes are limited, so modality mix and replacement cadence assumptions are harder to validate. |
The comparison shows that the spread is mainly explained by what gets included alongside core phantoms and how channel coverage is treated in the current year. By keeping scope rules explicit and tying volumes to installed base and QA cadence, we end up with a number that can be traced back to clear demand drivers and repeated each year with the same steps.
Key Questions Answered in the Report
Why are 3D-printed phantoms increasingly preferred over conventional models?
They can be produced in-house within days, closely replicate patient anatomy, and work across CT, MRI, and ultrasound, which improves quality checks and operator training while lowering logistics hurdles.
How is artificial intelligence changing phantom-based quality assurance?
AI software now automates image analysis of phantom scans, detecting subtle distortions in seconds and freeing physicists to focus on more complex performance issues.
What role do multi-modal phantoms play in the adoption of hybrid PET/CT and PET/MR scanners?
These phantoms validate spatial alignment and contrast consistency across integrated modalities, helping facilities maintain accreditation as hybrid imaging expands.
Why are outpatient imaging centers investing heavily in phantom testing?
Value-based reimbursement ties payment to documented image quality, so ambulatory facilities rely on routine phantom scans to secure favorable payer contracts.
Which supply-chain challenges most impact phantom availability?
Limited sources for elastography-grade polymers and high-purity radioactive gels can extend lead times and push manufacturers to explore alternative materials.
How do anthropomorphic phantoms enhance clinician training?
Their lifelike textures and anatomically accurate structures allow radiologists and surgeons to practice complex procedures in a controlled environment, reducing learning curves and improving patient safety.