
Medical Furniture Market Size and Share
Market Overview
| Study Period | 2020 - 2031 |
|---|---|
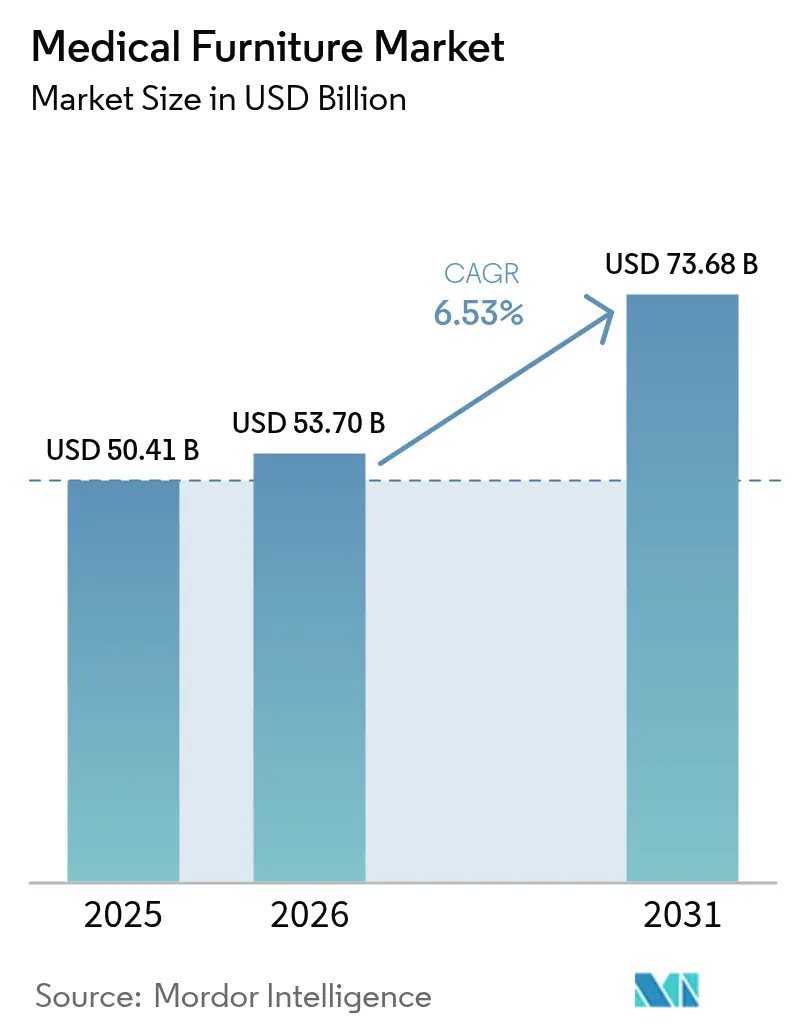
| Market Size (2026) | USD 53.70 Billion |
| Market Size (2031) | USD 73.68 Billion |
| Growth Rate (2026 - 2031) | 6.53 % |
| Fastest Growing Market | Asia-Pacific |
| Largest Market | North America |
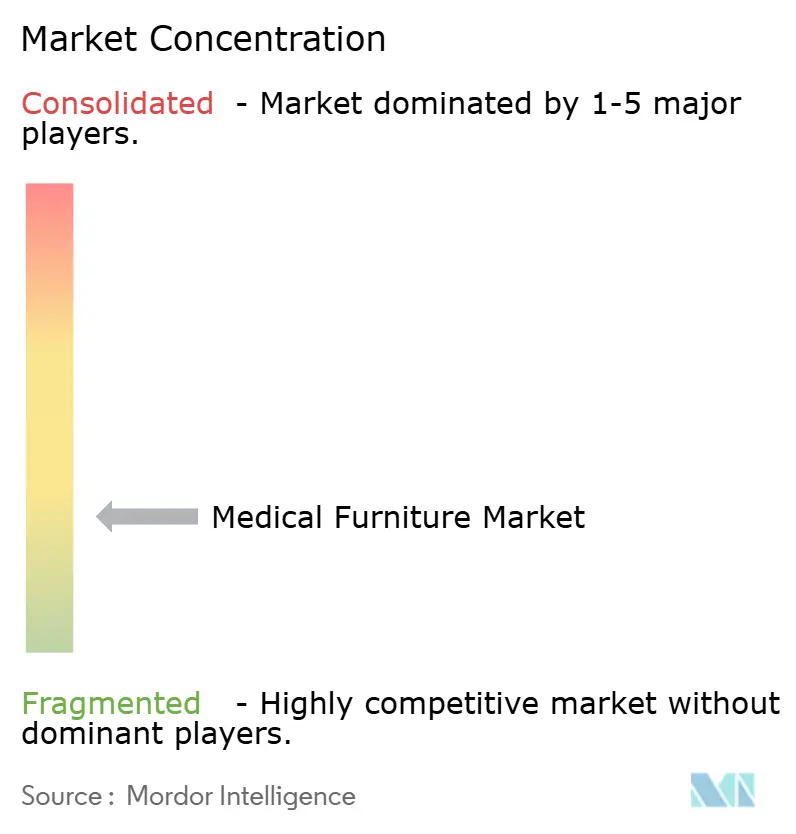
| Market Concentration | Low |
Major Players *Disclaimer: Major Players sorted in no particular order Image © Mordor Intelligence. Reuse requires attribution under CC BY 4.0. | |
Medical Furniture Market Analysis by Mordor Intelligence
The Medical Furniture Market size is expected to grow from USD 50.41 billion in 2025 to USD 53.70 billion in 2026 and is forecast to reach USD 73.68 billion by 2031 at 6.53% CAGR over 2026-2031.
Aging populations, rising chronic-disease prevalence, and shorter replacement cycles sustain baseline demand, while hospital-build programs in Asia, the Middle East, and South America add greenfield volumes that bypass manual systems. Acute-care providers in North America and Europe replace legacy beds with electric and smart models to cut caregiver injuries and feed bed-status data into electronic health records, and reimbursement expansions for tele-rehabilitation shift a slice of capital budgets toward lighter, modular lines suitable for home settings. Semiconductor shortages, sustainability-compliance costs, and patchy long-term-care reimbursement create headwinds, yet vendors blunt these pressures by bundling software subscriptions and usage-based financing that convert up-front capital expenditure into operating expense. Competitive intensity remains moderate because the top five suppliers control less than 40% of global revenue, leaving room for regional specialists that add antimicrobial coatings or lease-to-own financing.
Key Report Takeaways
- By product type, beds led with 33.55% of the medical furniture market share in 2025, while modular and specialized lines are on track to advance at a 9.85% CAGR through 2031.
- By power and connectivity, semi-electric models accounted for 34.53% of the medical furniture market size in 2025, yet fully smart and IoT-enabled ranges are projected to post an 11.75% CAGR over 2026-2031.
- By transaction model, capital purchases dominated with 70.15% of 2025 revenue, although surge and short-term rentals are expanding at a 10.82% CAGR on the back of pandemic-preparedness mandates.
- By end user, hospitals consumed 64.52% of 2025 shipments, whereas home-health and long-term-care channels are forecast to grow at an 8.12% CAGR to 2031.
- By distribution channel, direct tender and institutional sales delivered 58.55% of 2025 turnover, yet e-commerce & digital catalog are advancing at a 11.72% CAGR to 2031.
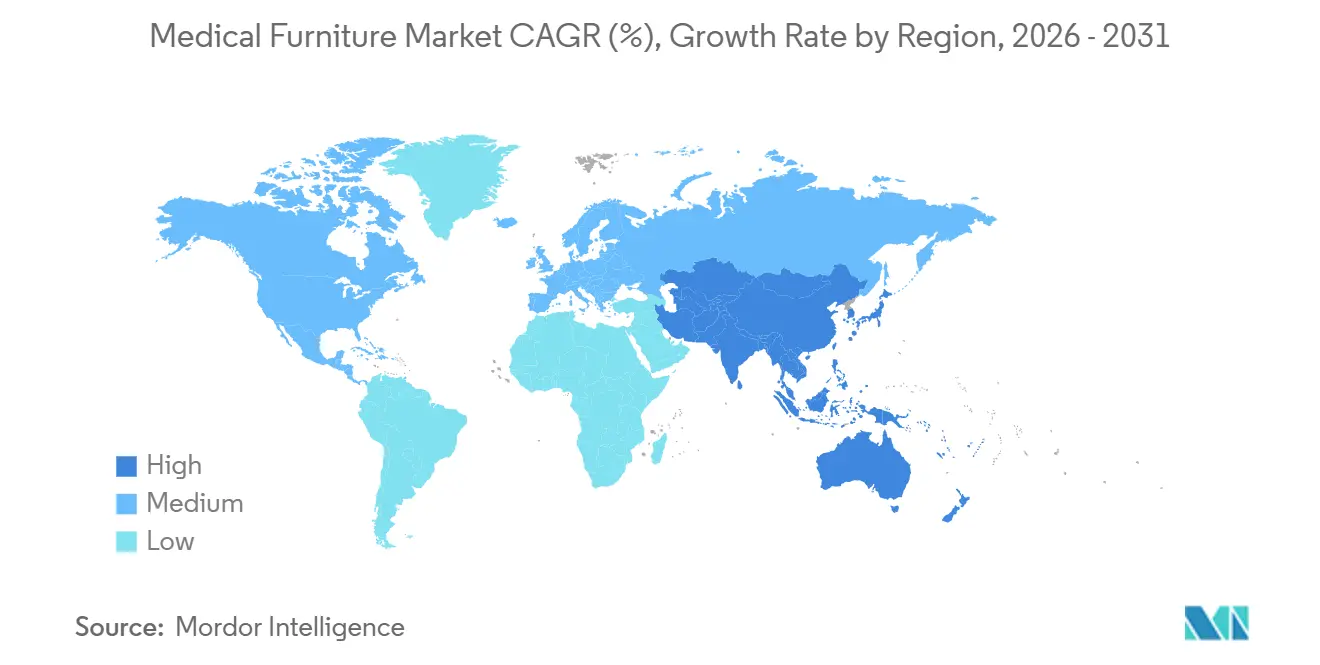
- By geography, North America captured 36.55% revenue in 2025, but Asia-Pacific is anticipated to log the fastest regional growth at 7.72% CAGR through 2031.
Note: Market size and forecast figures in this report are generated using Mordor Intelligence’s proprietary estimation framework, updated with the latest available data and insights as of 2026.
Market Trends and Insights
Drivers Impact Analysis of Medical Furniture Market*
| Driver | (~) % Impact on CAGR Forecast | Geographic Relevance | Impact Timeline |
|---|---|---|---|
| Aging population & chronic-care surge | +1.2% | Global, with acute impact in Japan, Europe, North America | Long term (≥ 4 years) |
| Expansion of hospital-build pipelines | +1.5% | APAC core (China, India), spill-over to MEA and South America | Medium term (2-4 years) |
| Rapid shift to home-health & tele-rehab | +0.9% | North America & EU, emerging in urban APAC | Medium term (2-4 years) |
| Global pivot to electric & smart beds | +1.3% | Global, led by North America and Western Europe | Medium term (2-4 years) |
| AI-driven fleet-optimization contracts | +0.7% | North America, pilot deployments in EU and Australia | Short term (≤ 2 years) |
| Antimicrobial-surface mandates | +0.6% | Global, regulatory push in EU and North America | Short term (≤ 2 years) |
| Source: Mordor Intelligence | |||
Aging Population and Chronic-Care Surge
People aged 65 and older now outpace hospital bed additions, stretching general-purpose inventories and raising demand for bariatric frames, pressure-redistribution surfaces, and side-rails compliant with fall-risk protocols. Non-communicable diseases account for 74% of global deaths, pushing average length of stay well beyond historical norms, so providers upgrade to electric articulation that minimizes caregiver musculoskeletal injuries. In Japan, citizens aged 75+ will represent 20% of the total population by 2030, prompting prefectural programs that subsidize adjustable home-care beds meeting JIS T 9254 safety codes[1]. Vendors therefore design easy-to-use pendant controls, large-format displays, and voice commands to serve older users with limited technical literacy.
Expansion of Hospital-Build Pipelines
Government capital programs in India, China, and Brazil are funding hundreds of new district or tertiary hospitals, driving procurement volumes that eclipse traditional tender cycles and secure large framework deals. India’s health ministry has broken ground on 157 new medical colleges, each demanding 300–500 beds, equivalent to more than 50,000 units of medical furniture through 2028[2]. China will add about 1.2 million county-level beds by 2027, with provincial tenders specifying semi-electric furniture as the default baseline. Such scale encourages global vendors to set up local assembly lines, while smaller domestic suppliers benefit from preferential procurement rules.
Rapid Shift to Home-Health and Tele-Rehab
Reimbursement expansions for remote monitoring now allow adjustable beds that stream vital-sign and occupancy data to qualify for U.S. Medicare payments. A 2025 EU directive further compels member states to cover short-term rental of home-care furniture for patients discharged within 72 hours, catalyzing demand for compact lift chairs and over-bed tables with embedded fall-detection sensors. Manufacturers answer with modular frames that separate clinical mechanics from aesthetic headboards, permitting the same chassis to serve both hospitals and living rooms without breaching residential safety codes.
Global Pivot to Electric and Smart Beds
Hospitals are replacing manual and semi-electric units with fully motorized, IoT-enabled frames that feed weight, position, and side-rail data into electronic health records. The U.S. FDA cleared 37 new electric bed models in 2024, a 22% year-on-year jump that underlines supplier focus on smart functionality. Updated IEC 60601-2-52 standards published in 2025 impose stricter electromagnetic-compatibility tests on networked beds, raising development costs but ensuring hospital IT security. Falling actuator prices and field-upgrade kits now allow hospitals to convert semi-electric frames to full electric operation without replacing the base structure.
Restraints Impact Analysis of Medical Furniture Market*
| Restraint | (~) % Impact on CAGR Forecast | Geographic Relevance | Impact Timeline |
|---|---|---|---|
| High capex for advanced furniture | -0.8% | Global, acute in low- and middle-income regions | Medium term (2-4 years) |
| Patchy reimbursement in long-term care | -0.5% | North America, fragmented across U.S. state Medicaid programs | Long term (≥ 4 years) |
| Sustainability-compliance cost spikes | -0.4% | EU and North America, emerging in APAC | Short term (≤ 2 years) |
| PCB-chip shortages for smart furniture | -0.6% | Global, supply-chain bottlenecks in APAC manufacturing hubs | Short term (≤ 2 years) |
| Source: Mordor Intelligence | |||
High Capex for Advanced Furniture
Fully electric or smart beds can cost 150%–300% more than manual alternatives, so budget-constrained rural hospitals and critical-access facilities defer purchases when operating margins fall below 2%. Vendors counter with lease-to-own plans and usage-based pricing, but many providers lack the credit ratings these models demand. Capital scarcity also limits adoption in ambulatory surgical centers that face seasonal case swings.
Patchy Reimbursement in Long-Term Care
Medicaid programs in several U.S. states exclude beds and lift chairs from durable-medical-equipment lists unless prescribed for specific respiratory or cardiac conditions. European schemes reimburse home-care beds below inflation, leaving long-term-care operators to cover smart upgrades out of pocket. This funding gap slows penetration of electric and IoT units in nursing homes, which instead focus budgets on staffing and pharmaceuticals.
*Our forecasts treat driver/restraint impacts as directional, not additive. The impact forecasts reflect baseline growth, mix effects, and variable interactions.
Medical Furniture Market Segment Analysis
By Product Type:
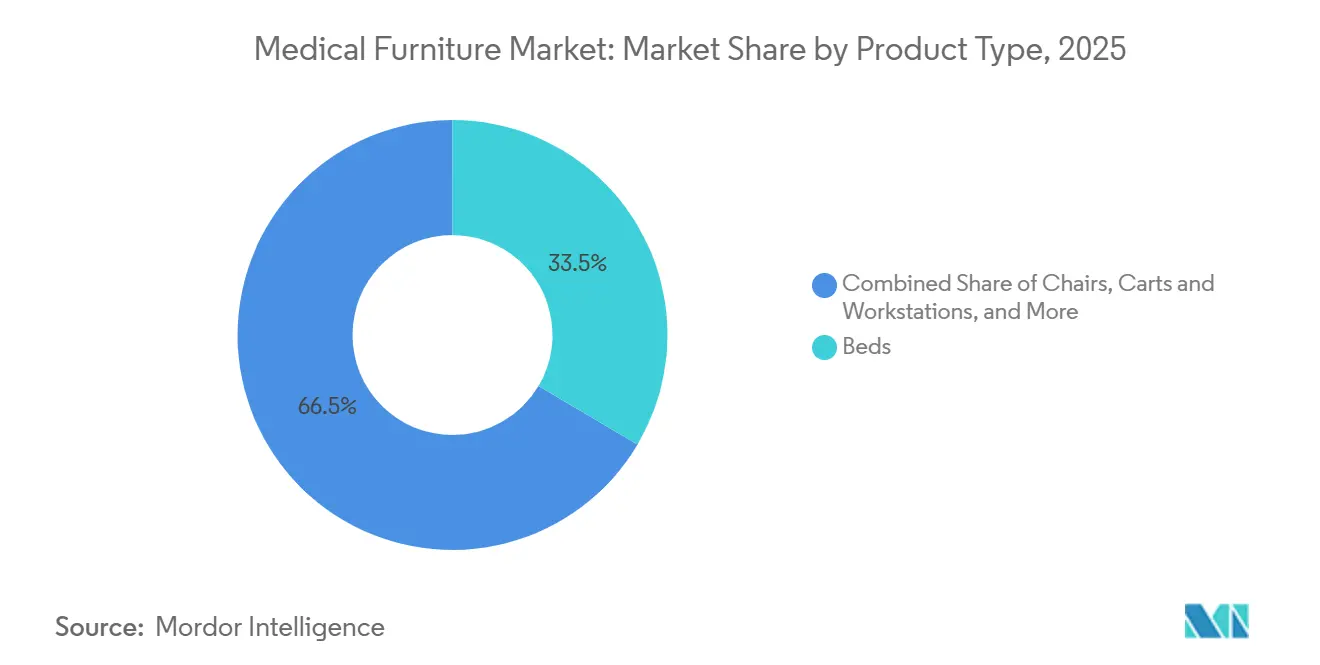
Specialized and Modular Lines Close the GapBeds underpinned 33.55% of 2025 revenue, making them the largest slice of the medical furniture market. Intensive-care variants feature auto-rotation and integrated scales that command prices roughly three times those of general-purpose frames. Modular psychiatric and pediatric units, however, are forecast to grow at a 9.85% CAGR as behavioral-health and children’s hospitals open dedicated wards. Ligature-resistant furniture complies with Joint Commission rules for psychiatric safety, while pediatric models integrate playful headboards and modular storage that facilitate family overnight stays[3].
Chairs, carts, cabinets, and mobility aids round out portfolios. Examination and dialysis chairs dominate outpatient clinics where space is tight. Mobile carts with embedded barcode scanners ride the wave of medication-administration-safety programs. Bariatric beds meet rising obesity prevalence—16% of adults in 2024—by offering reinforced actuators and wider frames. Accessories such as over-bed tables and patient lifts enjoy stable growth thanks to home-health adoption.

By Power and Connectivity:
Smart Upgrades Outpace Semi-Electric LeadersSemi-electric models delivered 34.53% of revenue in 2025, yet smart ranges will climb at an 11.75% CAGR once hospital IT teams complete HL7 FHIR integration roadmaps. Smart units transmit real-time data needed for AI fleet-management platforms, reducing patient wait times by 18% according to a 12-hospital U.S. study. Manual furniture persists in markets with intermittent electricity but will concede share as battery backup modules become cheaper.
Electric and IoT models are increasingly mandatory in intensive-care beds because predictive pressure-mapping helps avert hospital-acquired ulcers, a metric tied to U.S. value-based purchasing penalties. The medical furniture market size attached to fully smart beds is expected to multiply as cybersecurity certifications—now required by new FDA guidance—become default bid requirements. Vendors with dedicated security teams and software partners are best positioned to capture this premium.
By Transaction Model:
Rental Momentum ContinuesCapital ownership comprised 70.15% of 2025 transactions, though surge and short-term rentals will accelerate at 10.82% CAGR through the forecast window. U.S. federal funding earmarked USD 500 million for state medical-surge capacity, explicitly permitting short-term equipment leasing. For hospitals facing flu season spikes or unforeseen outbreaks, 30- to 90-day rentals avoid unused assets in low-occupancy months.
Long-term leases fit ambulatory surgical centers with variable case‐mix while preserving cash for working capital. Conversely, large integrated-delivery networks still favor outright purchase because in-house biomedical teams can amortize maintenance over a decade, keeping lifetime cost per bed lower than rental. The medical furniture market continues to balance flexibility versus ownership economics as pandemic lessons shape procurement policy.
By End User:
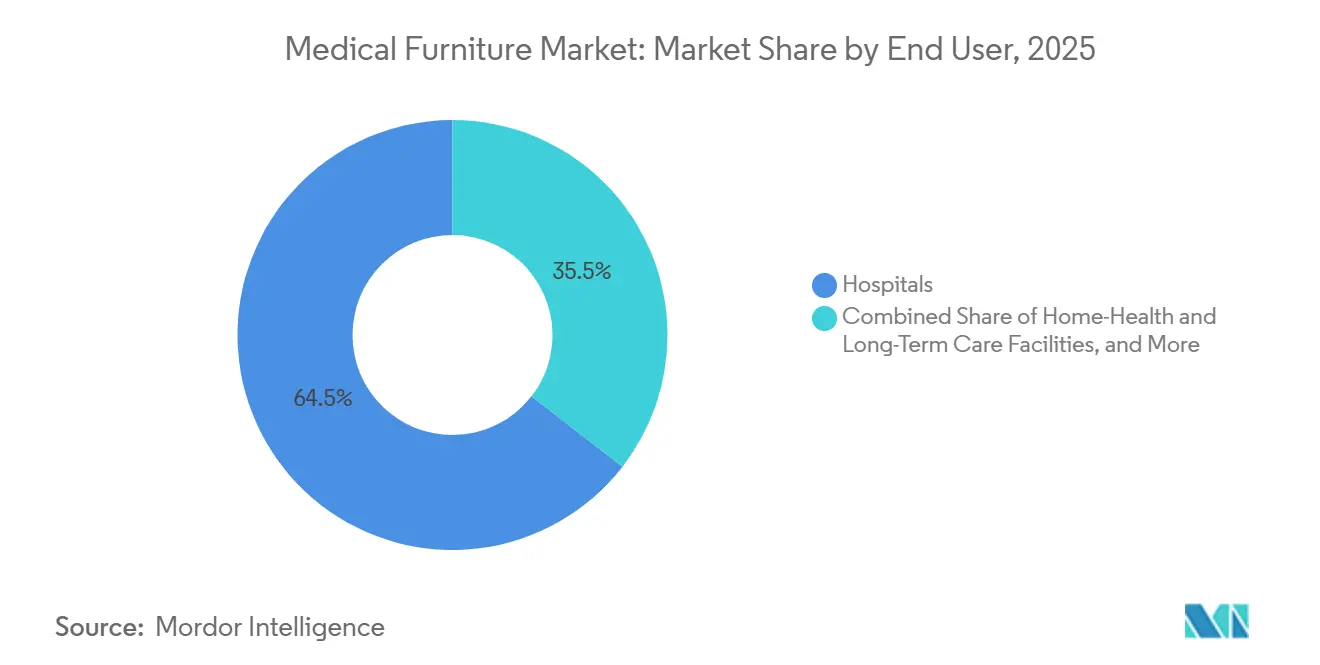
Home-Health Facilities Post Highest GrowthHospitals commanded 64.52% of global shipments in 2025, reflecting sheer bed counts and replacement cycles. Yet home-health and long-term-care channels are slated for an 8.12% CAGR to 2031, outpacing institutional growth as aging-in-place policies gain traction. U.S. home-health agencies can now bill Medicare for remote-monitoring bundles that include adjustable beds, a regulatory change that inserts clinical-grade furniture into living rooms.
Rehabilitation centers and physiotherapy units emphasize tilt tables and parallel bars for progressive mobility. Military field hospitals procure ruggedized frames that comply with NATO transport tests, a niche where aluminum alloys and quick-fold legs cut deployment time. The medical furniture market therefore splits across care settings, and suppliers that can tailor one chassis to multiple environments capture scale advantages.
By Distribution Channel:
E-Commerce Chisels Into Tender DominanceDirect tender and institutional agreements still made up 58.55% of 2025 revenue, supported by multi-year service bundles. However, e-commerce and digital catalogs are forecast to post an 11.72% CAGR as procurement officers increasingly shortlist vendors online before issuing formal RFPs. The U.S. General Services Administration now hosts an online catalog under its MAS schedules, letting federal buyers compare ISO 60601 certificates with a few clicks.
Dealer networks remain vital in rural regions where internet penetration lags and face-to-face demos matter. Nevertheless, as younger purchasing managers rise, digital research habits will continue eroding middle-man margins. The medical furniture market rewards suppliers that maintain omnichannel strategies—tender playbooks for big systems and web storefronts for smaller clinics and international buyers.
Geography Analysis
North America Medical Furniture Market
North America accounted for 36.55% of 2025 revenue thanks to Medicare Advantage plans that reimburse connected beds and strong replacement demand; roughly 60% of U.S. hospital beds now exceed 10 years of service. Canadian provinces use group-purchasing agreements to secure extended warranties, while Mexican plants established by U.S. vendors shorten lead times and sidestep freight surcharges.
APAC Medical Furniture Market
Asia-Pacific is projected to log the fastest regional CAGR at 7.72% through 2031. China alone plans to add 1.2 million county-level hospital beds by 2027. India’s medical-college expansion funnels demand exceeding 50,000 beds a year. Japan’s prefectural subsidies for home-care beds that meet JIS standards illustrate how aging demographics lift residential demand. Australia and South Korea anchor smart-hospital pilots that require HL7-ready furniture, reinforcing long-run electrification.
EMEA and South America Medical Furniture Market
Europe displays moderate growth driven by regulatory refresh cycles. The 2025 EU MDR re-certification deadline forces hospitals to retire pre-2017 inventory lacking updated technical files. Germany and the U.K. leverage centralized tenders that favor vendors with multi-country support teams. In the Middle East, GCC states spec flight smart ICU beds for medical-tourism flagships, whereas Sub-Saharan health ministries stick to manual and semi-electric lines for budget reasons. Brazil earmarked BRL 4.2 billion (USD 840 million) in 2024 for hospital equipment in underserved regions, with local-assembly stipulations that help manufacturers dodge import tariffs.
Regulatory Landscape
Medical furniture suppliers work within medical-device and facility-safety frameworks that increasingly reference harmonized quality and bed-safety standards. In the United States, the FDA Quality Management System Regulation (QMSR) became effective on February 2, 2026, incorporating ISO 13485:2016 and lifting the compliance baseline for manufacturers selling regulated beds, stretchers, and connected furniture into hospital systems.
Standards updates are also tightening product design and validation requirements across major markets. IEC 80601-2-52:2026 (published May 5, 2026) updates particular requirements for the basic safety and essential performance of adult medical beds, while the United Kingdom's Department of Health and Social Care issued Notice of Publication 0129/26 on January 17, 2026 to designate updated standards supporting the Medical Devices Regulations 2002. In China, GB/T 46489-2025 (published October 5, 2025) sets general technical requirements for hospital furniture and entered implementation on May 1, 2026, shaping local tender specifications and supplier qualification for institutional procurement.
Competitive Landscape
The medical furniture market sits at a moderate concentration level; the top five suppliers command a significant share of global revenue, while a long tail of regional firms address niche needs. Tier-one vendors operate vertically integrated facilities with in-house actuator assembly and powder-coating that hedge against semiconductor or finish shortages. They add software layers—bed-status dashboards, predictive-maintenance alerts, and AI-based allocation algorithms—to transform beds into data generators. Stryker filed 12 U.S. patent applications in 2024 for pressure-mapping sensors and fall-prediction software. Getinge secured European patents on modular ICU frames that accept interchangeable side rails and patient-lift add-ons.
Disruptors exploit white spaces. Behavioral-health specialists design ligature-resistant frames compliant with Joint Commission rules, while e-commerce-native brands sell direct, trading lower margins for global reach. Firms that obtain IEC 60601-2-52 certificates plus FDA cybersecurity clearance penetrate premium segments where hospitals refuse uncertified equipment. Low-cost entrants struggle because EU MDR and ISO 13485 quality-system audits raise the cost of entry.
Strategic moves in 2025 include Stryker’s launch of the ProCeed bed, which targets mid-tier hospitals by marrying simplicity with upgradable control modules, and Catholic Medical Center’s USD 100 million infrastructure program earmarking a slice of capital for IoT-ready beds. Vendors increasingly bundle hardware, software, and five-year maintenance into subscription contracts that stabilize cash flow and keep competitors out until renewal.
Medical Furniture Industry Leaders
-
Stryker Corporation
-
Getinge AB
-
Baxter International Inc. (Hill-Rom)
-
LINET Group SE
-
Paramount Bed Holdings
- *Disclaimer: Major Players sorted in no particular order
Medical Furniture Market Companies Covered in this Report
- Amico Corporation
- Arjo AB
- Baxter International Inc. (Hill-Rom)
- Capsa Healthcare
- Drive DeVilbiss Healthcare
- Getinge
- GF Health Products
- GPC Medical Ltd.
- Invacare
- Joerns Healthcare
- LINET Group
- Malvestio S.p.A.
- Medifa GmbH & Co. KG
- Medline Industries
- Merivaara Oy
- Midmark
- MillerKnoll Inc.
- Paramount Bed Holdings
- Savaria Corp. (Span-America)
- Steelcase Health
- Stiegelmeyer
- Stryker
- Sunrise Medical
- Wieland Healthcare
Market Opportunities and Future Outlook
Procurement and care-setting shifts are creating room for vendors that can combine clinical compliance, lifecycle support, and faster deployment. In home-health and short-stay discharge pathways, the reimbursement and rental provisions referenced in the report context support demand for compact, modular lines and short-term leasing models, and ISO/TS 5137:2026 (published February 2026) formalizes maintenance management requirements for reusable medical devices within healthcare delivery organizations. That framework encourages furniture providers to bundle preventive-maintenance programs and asset documentation into institutional contracts.
Institutional buying criteria are also changing in ways that reward differentiated materials, digital readiness, and integrated fit-out models. In June 2026, the UK Department of Health and Social Care issued national Value-Based Procurement guidance for medical technology, including a minimum 10% social value weighting in tender evaluations, which pushes suppliers to substantiate durability, infection-control performance, and serviceability rather than compete on price alone. On the supply side, Flokks' April 2026 acquisition of Spec Furniture strengthens healthcare-ready portfolios in North America, and EIR Healthcare's May 2026 partnership with MillerKnoll to integrate furniture and casework into factory-built modular clinics targets earlier, standardized procurement with shorter interior fit-out cycles. This supports opportunities for vendors that can design for repeatable modular installations and rapid commissioning.
Recent Industry Developments in Medical Furniture Market
- June 2026: Getinge opened a Digital OR Hub in Hamburg, Germany, to accelerate development and adoption of digital perioperative workflow solutions. The initiative ties operating-room modernization to connected equipment and data flows, reinforcing demand for integration-ready clinical furnishings and adjacent infrastructure that can support digitalized care pathways.
- January 2026: Baxter introduced the Dynamo Series smart stretcher for an upcoming U.S. launch, targeting emergency and perioperative transport challenges in hospitals. The rollout expands smart, motor-assisted patient handling offerings that address caregiver strain and supports procurement shifts toward connected, workflow-oriented mobility platforms.
- June 2025: Paramount Bed launched ParaDrive, a motorized drive option for its ALiUS electric ICU bed lineup in Japan. Adding powered mobility and handling functionality increases ICU-bed differentiation and supports provider efforts to improve in-ward transport efficiency while managing staff workload constraints.
Medical Furniture Market Report Scope and Research Methodology
Market Definition and Coverage
For this methodology, the market covers furniture purpose-built for healthcare delivery and patient care across facilities, including items like beds, chairs, tables, carts, and storage that are designed for hygiene, safety, and clinical workflows.
Scope exclusions: We do not count general-purpose home or office furniture unless it is specifically sold and used as medical-grade furniture in healthcare settings.
Segments Covered in This Report
- By Product Type
- Beds
- General Purpose Beds
- ICU / Critical-care Beds
- Pediatric Beds
- Maternity Beds
- Bariatric Beds
- Electric / Smart Beds
- Chairs
- Examination Chairs
- Treatment & Dialysis Chairs
- Recliners & Lift Chairs
- Carts & Workstations
- Medication Carts
- Emergency / Crash Carts
- Anesthesia Carts
- Computing Workstations
- Cabinets & Storage
- Sterile Cabinets
- Bedside Cabinets
- Instrument Cabinets
- Secure Drug Cabinets
- Tables & Stools
- Examination Tables
- Operating Tables
- Imaging Tables
- Mobility, Support & Accessories
- Over-bed Tables
- IV Poles & Stands
- Patient Lifts & Transfer Aids
- Commodes & Walkers
- Modular & Specialized Furniture
- Behavioral-health Furniture
- Pediatric-specialty Furniture
- Antimicrobial-coated Lines
- Beds
- By Power & Connectivity
- Manual
- Semi-Electric
- Fully Electric
- Smart / IoT-Enabled
- By Rental vs Ownership
- Capital Purchase
- Long-Term Lease
- Surge / Short-Term Rental
- By End User
- Hospitals
- Ambulatory Surgical & Specialty Clinics
- Home-Health & Long-Term Care Facilities
- Rehabilitation & Physiotherapy Centers
- Military & Field Hospitals
- By Distribution Channel
- Direct Tender & Institutional Sales
- Dealer & Distributor Sales
- E-commerce & Digital Catalog
- By Geography
- North America
- United States
- Canada
- Mexico
- Europe
- Germany
- United Kingdom
- France
- Italy
- Spain
- Rest of Europe
- Asia-Pacific
- China
- India
- Japan
- Australia
- South Korea
- Rest of Asia-Pacific
- Middle East and Africa
- GCC
- South Africa
- Rest of Middle East and Africa
- South America
- Brazil
- Argentina
- Rest of South America
- North America
Data Sources, Market Sizing, and Validation
Desk Research
Desk work starts by mapping demand signals to where medical furniture is installed, and then connecting that to replacement and expansion activity. We use public health infrastructure indicators, such as hospital and bed statistics, drawing on sources like the OECD, the World Bank, and national health ministries, so the demand pool is not built in isolation.
Next, we bring in trade and supply-side indicators to sense-check what is being shipped, produced, and priced in major regions. Inputs from sources such as UN Comtrade and United States International Trade Commission data releases, plus standards and safety references from bodies like FDA (for device-adjacent classifications) and IEC or ISO publications, are used to set practical ranges for unit mix and upgrade cycles. We also review company annual reports, investor presentations, tender notices, and an import/export shipment-level database to confirm category direction and timing. These desk research sources are illustrative, and many other public references were used to collect data, verify inputs, and clarify assumptions.
Primary Interviews and Surveys
Primary discussions were used to validate how purchasing happens and what gets bundled into a furniture quote, so the inclusion rules stay consistent across countries. We spoke with participants across manufacturing, distribution, and institutional procurement, and we also checked views with facility managers and clinical staff to confirm real replacement cycles and adoption of electric and connected features across major regions.
Distribution of primary research fieldwork respondents
| Company type | Respondent position | Region |
|---|---|---|
| Top tier: 25% | CXOs: 13% | APAC: 44% |
| Mid tier: 57% | Functional/Unit leaders: 27% | EMEA: 32% |
| Smaller Players: 18% | Managers: 60% | Americas: 24% |
Market-Sizing & Forecasting
The sizing starts from a top-down build where healthcare infrastructure and utilization indicators are used to reconstruct the addressable demand pool for furniture refresh and new installs. Inputs that typically move the model include hospital bed counts and additions, procedure volume trends that influence exam and treatment room setups, aging population signals that affect long-term care capacity, outpatient shift indicators that change the mix of chairs and procedure tables, and observed import and shipment momentum for bulky furniture categories.
After the total is shaped at the country and regional level, we corroborate it with selective bottom-up checks so the number stays realistic. Those checks include sampled average selling prices by product family, channel markups for tender versus distributor routes, and a limited roll-up of supplier revenues where public disclosures are available, with gaps handled by applying interview-tested ranges rather than assuming full visibility. For forecasting, scenario analysis is used so we can vary key drivers like facility expansion pace, replacement timing, and electric feature penetration, then settle on a base case that aligns with what practitioners expect to see in budgets over the next few years.
Data Validation & Update Cycle
Validation is done through repeated cross-checks so one weak input does not distort the final output. We compare calculated totals against independent signals such as healthcare capital spending direction, trade flow changes, and country-level facility expansion announcements, and then investigate anomalies before sign-off.
A second analyst reviews the model logic, unit assumptions, and currency handling, followed by targeted re-contacts if a region shows unusual jumps that cannot be explained by known events. Reports are refreshed annually, and interim updates are made when material changes occur, such as policy-driven hospital buildouts or major supply disruptions. Before delivery, a final pass is completed so clients receive the latest view that matches current public signals.
Mordor Intelligence's Medical Furniture Market Sizing Compared With Other Published Estimates
Published market sizes for medical furniture can look far apart because the boundaries of what counts as furniture are not always the same, and the assumed buying cycle can also be different. Differences also come from whether analysts track installed base and replacements in addition to new builds, and how consistently they handle currency timing and inflation in pricing.
Trade flow direction, hospital bed infrastructure statistics, and procurement feedback are the checks that keep Mordor Intelligence's estimate aligned to furniture that is actually purchased for clinical use, instead of mixing in adjacent facility fit-out spending. When another publisher narrows the scope to hospital-only items or uses a different base year and growth curve, the outcome can shift even if the headline label sounds similar.
Benchmark comparison
| Source | Market Size | Gaps in Research Methodology |
|---|---|---|
| Mordor Intelligence | USD 53.70 B (2026) | |
| Industry Data Publisher A | USD 6.32 B (2025) | The estimate appears to represent a narrower revenue pool and a different base year, and it likely does not scale from healthcare capacity and replacement demand in the same way across countries. |
| Trade Data Publisher B | USD 8.89 B (2031) | This figure is labeled for hospital furniture and is presented as a 2031 value, which can exclude non-hospital end users and broader medical facility furniture categories that expand the total addressable spend. |
Looking across the table, most of the spread is explained by scope boundaries and timing, not by a single math step. When the counted items are limited to hospital furniture only, or when a different base year is used without a clear replacement-cycle anchor, the total tends to land lower and becomes harder to reconcile to real capacity and purchasing signals.
Key Questions Answered in the Report
How large is the medical furniture market in 2026?
The medical furniture market size stands at USD 53.70 billion in 2026, up from USD 50.41 billion in 2025.
What is the projected CAGR for medical furniture through 2031?
Global revenue is forecast to rise at a 6.53% CAGR between 2026 and 2031.
Which region is expected to grow the fastest?
Asia-Pacific is projected to register a 7.72% CAGR, driven by hospital-build programs in China and India.
Which product segment leads current revenue?
Beds hold the top position, capturing 33.55% of 2025 revenue in the medical furniture market.
Why are smart beds gaining traction?
Hospitals seek IoT-enabled frames that feed occupancy and weight data into electronic health records, cutting patient wait times and reducing caregiver injuries.