
Medical Equipment Calibration Market Size and Share
Market Overview
| Study Period | 2020 - 2031 |
|---|---|
| Market Size (2026) | USD 1.97 Billion |
| Market Size (2031) | USD 3.35 Billion |
| Growth Rate (2026 - 2031) | 11.22 % |
| Fastest Growing Market | Asia Pacific |
| Largest Market | North America |
| Market Concentration | Medium |
Major Players *Disclaimer: Major Players sorted in no particular order Image © Mordor Intelligence. Reuse requires attribution under CC BY 4.0. | |
Medical Equipment Calibration Market Analysis by Mordor Intelligence
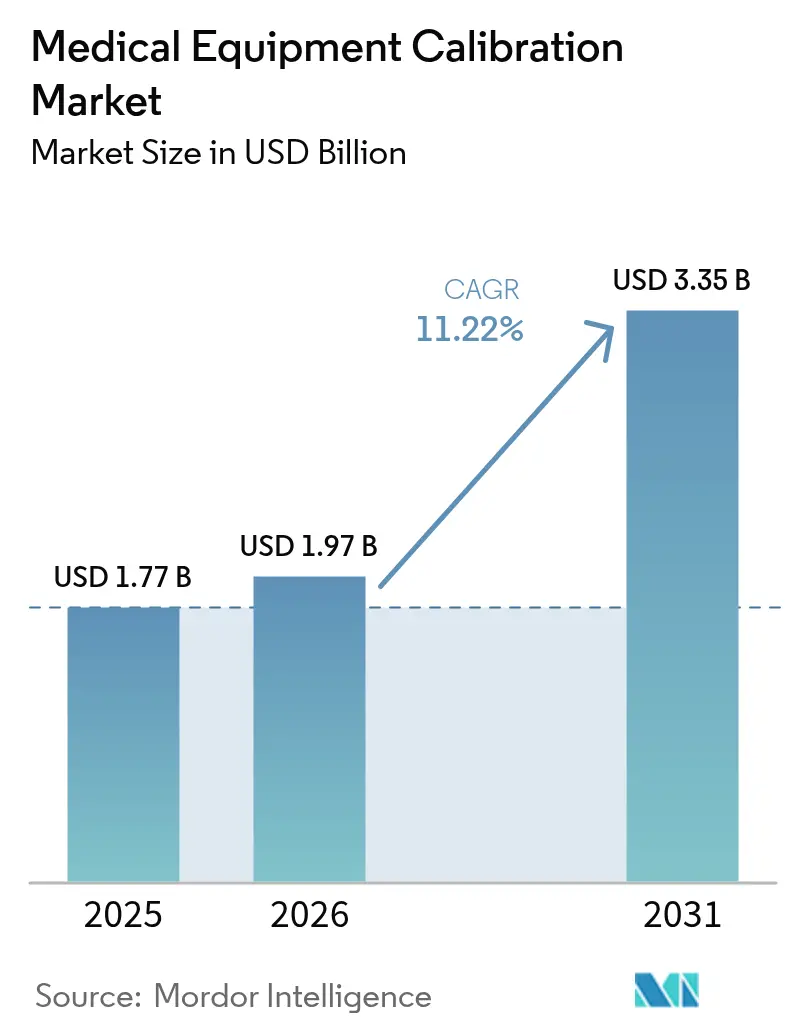
Medical Equipment Calibration Market size market size in 2026 is estimated at USD 1.97 billion, growing from 2025 value of USD 1.77 billion with 2031 projections showing USD 3.35 billion, growing at 11.22% CAGR over 2026-2031.
Demand tracks three converging forces: stricter global quality mandates, rapid technology replacement cycles, and the steady spread of advanced healthcare infrastructure. New FDA Quality Management System Regulation amendments taking effect in 2026 will harmonize United States rules with ISO 13485:2016 and reinforce the need for traceable calibration records. Capital spending on AI-enabled imaging, ventilators, and networked monitors expands the medical equipment calibration market because every new device shipped carries a downstream calibration requirement. Hospitals also link reimbursement to device accuracy metrics under value-based care, further embedding calibration into operating budgets.
Key Report Takeaways
- By equipment type, imaging equipment held 32.78% of the medical equipment calibration market share in 2025; vital-sign monitors are advancing at a 13.73% CAGR to 2031.
- By type of service, OEMs controlled 51.12% of the market in 2025 while third-party firms post the fastest 13.96% CAGR through 2031.
- By end user, hospitals accounted for a 43.95% share of the medical equipment calibration market size in 2025, while home-care and point-of-care settings expand at 15.71% CAGR to 2031.
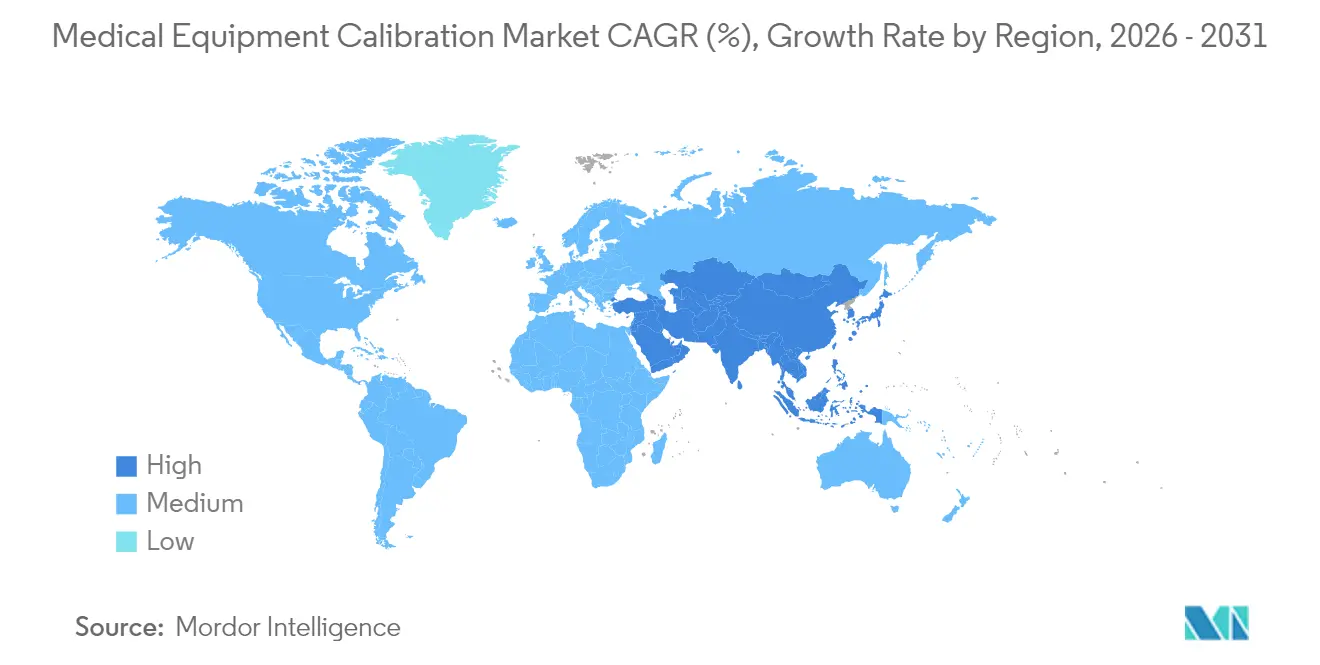
- By region, North America led with 39.12% revenue in 2025; Asia-Pacific is set to grow at 12.14% CAGR through 2031.
Note: Market size and forecast figures in this report are generated using Mordor Intelligence’s proprietary estimation framework, updated with the latest available data and insights as of 2026.
Market Trends and Insights
Drivers Impact Analysis of Medical Equipment Calibration Market*
| Driver | (~) % Impact on CAGR Forecast | Geographic Relevance | Impact Timeline |
|---|---|---|---|
| Stringent Global Regulations | +2.8% | Global, with early adoption in North America & EU | Medium term (2-4 years) |
| Growing Installed Base of High-Value Imaging & Life-Support Systems | +2.1% | Global, concentrated in developed markets | Long term (≥ 4 years) |
| Preventive-Maintenance Contracts to Cut Device Downtime | +1.9% | North America & EU primarily, expanding to APAC | Medium term (2-4 years) |
| IoT-Linked Self-Diagnostic Sensors Enabling Micro-Calibration | +1.7% | APAC core, spill-over to North America | Long term (≥ 4 years) |
| Value-Based Procurement Tying Reimbursement to Accuracy KPIs | +1.5% | North America & EU, pilot programs in APAC | Medium term (2-4 years) |
| Home/POC Devices Needing Field-Calibration Kits | +1.2% | Global, with fastest adoption in North America | Short term (≤ 2 years) |
| Source: Mordor Intelligence | |||
Stringent Global Regulations Drive Calibration Standardization
Regulatory harmonization elevates the medical equipment calibration market by embedding calibration traceability into quality audits and device approvals. The FDA QMSR now mirrors ISO 13485:2016, eliminating dual compliance silos and expanding documentation depth.[1] Europe’s MDR and IVDR impose comparable file-keeping obligations that reach far beyond basic safety checks and push suppliers to maintain chain-of-custody records for every calibration event. China’s NMPA reforms dovetail with the same standards while adding local clinical-trial demands, creating new accreditation work for domestic and multinational laboratories. Regulators also extend oversight to cybersecurity, with draft U.S. guidance requiring a software bill of materials for “cyber devices,” so calibration routines increasingly include security-verification steps.[2] Collectively, these intertwined rules reshape procurement, service contracting, and technician training.
Growing Installed Base of High-Value Imaging & Life-Support Systems
Hospital capital budgets now revolve around AI-ready CT, MRI, and ventilator platforms. Philips’ helium-free MRI architecture trims running costs yet requires new calibration protocols for a 7-liter magnet in place of traditional 1,500-liter vessels.[3] GE HealthCare’s alliance with NVIDIA for autonomous x-ray and ultrasound adds another calibration layer because software models need the same traceability as mechanical parts. These innovations multiply device variants and expand the medical equipment calibration market by shifting the service mix toward algorithm validation, IoT sensor checks, and multi-modal performance tests. Emerging life-support systems embed real-time feedback loops that demand more frequent micro-calibrations to guard patient safety and maintain uptime guarantees negotiated in value-based service contracts.
Preventive-Maintenance Contracts to Cut Device Downtime
Hospitals move away from ad-hoc fixes toward multi-year value partnerships that wrap calibration, software updates, and parts replacement into a flat-rate budget. Siemens Healthineers’ 12-year agreement with University Hospital Nantes (USD 59.9 million equivalent) typifies deals that guarantee uptime and tie penalties to unplanned downtime. Predictive analytics, often delivered through OEM dashboards or third-party platforms such as IBM Maximo, forecast drift weeks before it erodes accuracy. This approach saves labor, improves inventory planning, and locks calibration into a continuous data loop rather than an annual check. As a result, the medical equipment calibration market gains both scope and stickiness.
IoT-Linked Self-Diagnostic Sensors Enabling Micro-Calibration
Embedded sensors give care teams instant feedback on circuit temperatures, flow rates, and voltage stability. Philips e-Alerts for MRI, for instance, flag anomalies in real time and schedule service before faults disrupt patient schedules. Sensor telemetry enlarges the medical equipment calibration market because each alert triggers a targeted micro-calibration that splits the distance between preventive checks and full recalibration. Adoption remains fastest in Asia-Pacific, where new greenfield hospitals specify networked devices from day one, although North American providers follow closely amid staffing shortages. Cybersecurity still tempers full remote-control calibration, especially after reports of back-door access in certain imported monitors, but secure VPN tunnels and zero-trust architectures gradually mitigate risk.
Restraints Impact Analysis of Medical Equipment Calibration Market*
| Restraint | (~) % Impact on CAGR Forecast | Geographic Relevance | Impact Timeline |
|---|---|---|---|
| High Cost & Scheduling Complexity in Emerging Markets | -1.8% | APAC emerging markets, Latin America, MEA | Medium term (2-4 years) |
| Scarcity of ISO/IEC 17025-Accredited Technicians | -1.4% | Global, most acute in APAC and emerging markets | Long term (≥ 4 years) |
| Cyber-Security Rules Limiting Remote Calibration Access | -1.1% | Global, with strictest enforcement in North America & EU | Short term (≤ 2 years) |
| AI Autocalibration Data-Integrity Concerns | -0.9% | North America & EU primarily, expanding globally | Medium term (2-4 years) |
| Source: Mordor Intelligence | |||
High Cost & Scheduling Complexity in Emerging Markets
Healthcare systems in lower-income regions prioritize hardware acquisition over lifecycle services. Supply-chain disruptions raised logistics costs by up to 5% of manufacturer revenue in 2024, inflating calibration expenses for imported reference instruments. Geographic sprawl means a technician may spend two travel days for every service day, which deters routine visits and dampens the medical equipment calibration market. Currency swings further complicate multiyear contracts priced in hard currencies. Large providers respond by pooling demand or inviting global firms like Trescal to set up regional hubs, slowly easing cost burdens.
Scarcity of ISO/IEC 17025-Accredited Technicians
Training pipelines shrink while device complexity climbs. Vacancy rates nearing 20% stretch service lead times and force overtime premiums that lift pricing worldwide. Accreditation paths now require expertise in cybersecurity, risk-based thinking, and cloud analytics, raising the bar for new entrants. Providers fill gaps with automation—Tektronix CalWeb, for example, runs automated test benches and feeds results into compliance dashboards, cutting on-site time by half. Even so, the talent shortage places a ceiling on how fast the medical equipment calibration market can scale.
*Our forecasts treat driver/restraint impacts as directional, not additive. The impact forecasts reflect baseline growth, mix effects, and variable interactions.
Medical Equipment Calibration Market Segment Analysis
By Equipment Type:
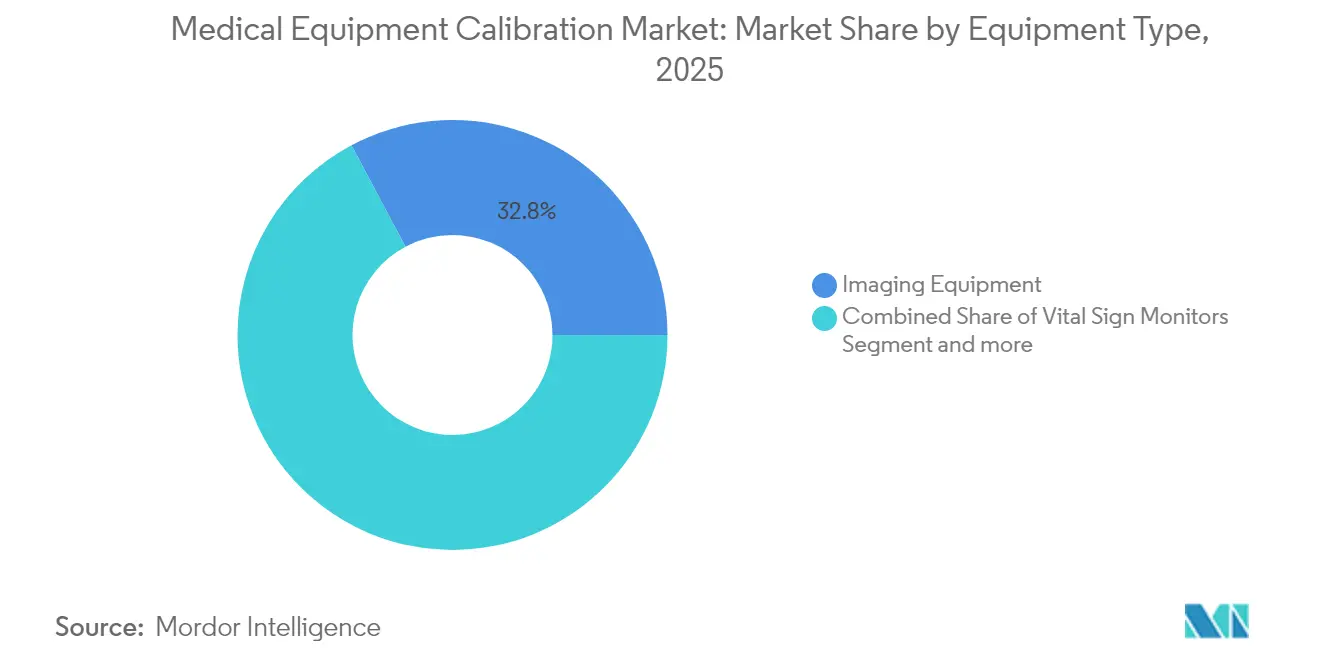
Imaging Systems Hold Ground While Monitors Race AheadImaging platforms accounted for 32.78% of the medical equipment calibration market in 2025, reflecting extensive calibration touchpoints from gantry alignment to dose calibration. Each software revision and hardware retrofit drives incremental service revenue and anchors long-term contracts. Algorithmic imaging methods add video-rate adjustments that go beyond classical geometric checks, enlarging scope. Vital-sign monitors, by contrast, post a 13.73% CAGR because home-care adoption multiplies unit volume. Every monitor shipped into a living room extends the medical equipment calibration market to non-institutional settings and triggers portable field-calibration kits. Gradient-free helium MRI, AI-enabled ultrasound, and connected infusion pumps all require bespoke procedures, locking in specialist demand.
Rapid uptake of networked devices means calibration now routinely covers sensors, embedded firmware, and cloud APIs. Infusion pumps rely on gravimetric calibration for flow accuracy, and any firmware patch resets the clock on compliance. Ventilator calibration gained visibility during the pandemic and remains a critical safety hedge in intensive-care units. Surgical tools and laboratory analyzers sustain steady growth, rounding out revenue diversity within the medical equipment calibration market.

By Type of Service:
OEM Leads, While Third-Party Niches ExpandOEMs controlled 51.12% of the medical equipment calibration market share in 2025, drawing strength from embedded diagnostics and proprietary software unlocks. Many OEM plans bundle firmware updates, cybersecurity patches, and minor repairs, making them one-stop solutions for hospitals focused on risk avoidance. Third-party providers grow 13.96% per year by pitching lower cost and multi-vendor coverage to independent clinics. They also develop niche expertise laser power calibration or electromedical safety that OEM competitors sometimes outsource.
In-house laboratories thrive inside very large hospital networks where equipment fleets justify dedicated benches. Hybrid arrangements emerge in which routine work stays onsite while complex modalities revert to OEMs or specialty firms, bringing flexibility and spreading risk. Digital portals run compliance documentation and service reminders across all three models, integrating them into a single audit trail and thus widening total spend in the medical equipment calibration market.
By End User:
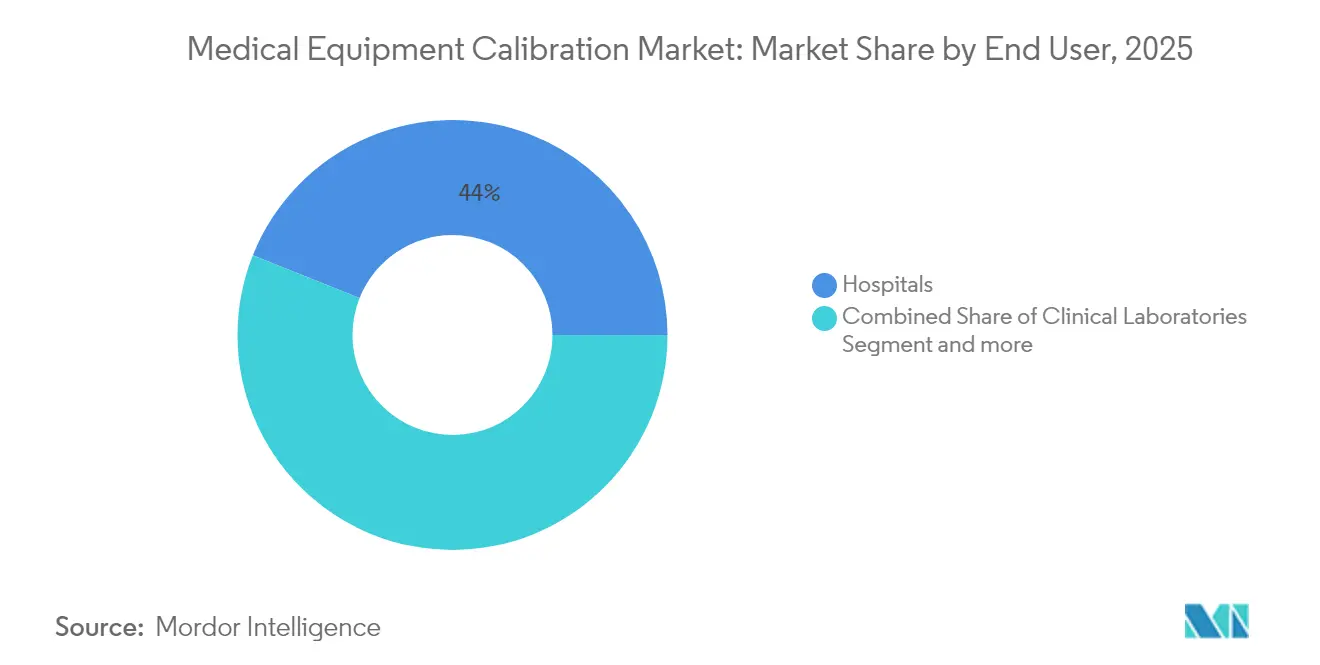
Hospital Core Faces Distributed-Care MomentumHospitals remain central with 43.95% revenue in 2025 because high-acuity devices such as cath-lab fluoroscopy and proton therapy machines stay inside bricks-and-mortar campuses. Value-partnership contracts guarantee uptime across hundreds of devices and generate predictable service windows. Laboratories add volume in the form of chemistry analyzers and hematology counters requiring frequent alignment to maintain test accuracy.
Home-care, ambulatory, and OEM labs rise 15.71% per year as payers push care closer to the patient. Portable dialysis, glucose meters, and fetal monitors move into residences or outpatient clinics, triggering new calibration workflows that emphasize lightweight fixtures and cloud-logged certificates. Point-of-care analyzers adopted by ambulance teams introduce calibration tasks in transit environments, broadening the medical equipment calibration industry landscape and demanding ruggedized calibration kits.
Geography Analysis
North America Medical Equipment Calibration Market
North America generated 39.12% of global revenue in 2025, supported by early alignment with ISO 13485 and routine FDA surveillance audits. Procurement teams embed service clauses that mandate ISO/IEC 17025 accreditation, cementing a high-entry barrier and rewarding scale operators. Canada’s regulatory modernization and Mexico’s export-oriented device production add regional tailwinds. The medical equipment calibration market size for North America is projected to advance in lockstep with imaging overhauls, tele-ICU rollouts, and cybersecurity mandates.
APAC Medical Equipment Calibration Market
Asia-Pacific grows at a brisk 12.14% CAGR, propelled by expanding manufacturer hubs in China, India, and South Korea and by fresh hospital construction across Southeast Asia. Government incentives to localize high-end production spur suppliers to build domestic calibration capability, stimulating cross-border joint ventures. Japan’s aging population drives heavy imaging utilization, while the ASEAN Medical Device Directive trims paperwork across 10 countries and speeds vendor onboarding. These factors converge to embed the medical equipment calibration market across the region.
EMEA and South America Medical Equipment Calibration Market
Europe commands a large installed base and a detailed regulatory playbook. MDR and IVDR updates extend calibration from radiology into in vitro diagnostics, inflating task lists and lengthening service contracts. Germany’s export pipeline, France’s hospital investments, and the United Kingdom’s post-Brexit alignment efforts collectively keep demand high. Sustainability preferences open space for newer calibration methods—for instance, helium-free MRI—and render traditional cooling and cryogen checks obsolete. Elsewhere, the Middle East, Africa, and South America register quicker relative growth as they retrofit outdated fleets and build new tertiary centers, though limited technician pools and currency risk temper uptake.
Regulatory Landscape
In the United States, the FDA Quality Management System Regulation (QMSR) took effect on February 2, 2026, incorporating ISO 13485:2016 by reference and raising calibration traceability and documentation expectations across device manufacturing and servicing quality systems. FDA inspection execution also shifted with the retirement of QSIT and use of the updated Compliance Program 7382.850, increasing focus on evidence such as maintenance history, out-of-tolerance impact assessment, and clear as-found/as-left calibration records where applicable.
Globally, ISO/IEC 17025 remains the key benchmark for calibration laboratory competence and traceability to national measurement institutes (for example, NIST), which shapes supplier qualification in many tenders and audits. In Europe, the EU Medical Device Regulation (MDR 2017/745) reinforces lifecycle obligations for devices with measuring functions, driving manufacturers and service providers to maintain auditable calibration and maintenance controls that align with notified-body scrutiny and post-market surveillance expectations.
Competitive Landscape
The medical equipment calibration market hosts a mix of diversified industrial groups, OEM service arms, and specialist metrology firms. Trescal, funded by private equity, completed USD 13.1 million in acquisitions across four continents in 2024 to knit a global network able to match multinational device makers’ footprints. OEMs such as GE HealthCare, Siemens Healthineers, and Philips bundle calibration into enterprise-wide imaging refreshes, locking customers for seven-to-twelve-year cycles. Technology firms including IBM and Beamex deploy AI to predict drift, trim turnaround times, and evidence ROI.
Fragmentation persists in emerging economies where dozens of local firms manage electrical safety tests and basic flow meters. Consolidators eye these targets to gain geographic breadth and workforce depth. Cybersecurity credentials now influence award decisions, elevating providers that can validate software hashes and encrypt calibration files.
Medical Equipment Calibration Industry Leaders
-
JM Test Systems Inc.
-
Tektronix, Inc.
-
Godrej.com
-
ISS Solutions, Inc (Biomed Technologies Inc.)
-
Fortive (Fluke)
- *Disclaimer: Major Players sorted in no particular order

Medical Equipment Calibration Market Companies Covered in this Report
- Fortive
- Trescal
- GE Healthcare
- Siemens Healthineers
- Koninklijke Philips
- Transcat
- Tektronix
- JM Test Systems
- TAG Medical
- BC Group International
- Beamex
- Keysight Technologies
- JPen Medical
- NS Medical Systems
- Medserve Ltd
- Godrej Biomed
- Biomed Technologies (ISS Solutions)
- TBS Group
- Aramark Services
- Pentax Medical Services
- Rigel Medical
Market Opportunities and Future Outlook
A practical whitespace area is helping providers operationalize the 2026 FDA QMSR shift by strengthening ISO 13485-aligned calibration controls, particularly around equipment control and calibration traceability, and by packaging audit-ready documentation as part of service delivery. As hospitals and device manufacturers prepare for more evidence-dense inspections, demand rises for ISO/IEC 17025-accredited coverage across more modalities and geographies, along with workflow tools that reduce manual record handling and close gaps in chain-of-custody, uncertainty reporting, and out-of-tolerance decisioning.
Technology-led opportunity centers on digitization and connected-service delivery: calibration management platforms are moving toward cloud workflows and digital calibration certificates, including integrity safeguards, to support multi-site healthcare networks and multi-vendor fleets. Condition-based strategies using analytics on drift and usage data, and remote calibration enabled by connected sensors for applicable instrument categories, broaden addressable service models beyond fixed-interval site visits, while also creating demand for cybersecurity-aware processes that protect access to device interfaces and calibration data.
Recent Industry Developments in Medical Equipment Calibration Market
- February 2026: The FDA Quality Management System Regulation (QMSR) took effect, incorporating ISO 13485:2016 by reference and changing how calibration and maintenance evidence is assessed during quality oversight. The transition increased the importance of traceable calibration records, systematic out-of-tolerance impact assessment, and tighter control of documentation that supports audit readiness across manufacturers and service providers.
- April 2025: JM Test Systems acquired Alabama Scale and Instrument, Inc. (ASI) to expand testing and calibration capabilities. The acquisition broadened service capacity and adds scale-centric competencies that can be leveraged across healthcare and life-sciences customers running high-throughput device fleets.
- March 2025: JM Test Systems expanded into Canada through the acquisition of BHD Instrumentation. The expansion extended geographic coverage for multi-site customers and strengthens cross-border support for regulated calibration workflows where consistent accreditation and documentation are central to service selection.
Medical Equipment Calibration Market Report Scope and Research Methodology
Market Definition and Coverage
This market covers paid calibration activities that verify and adjust medical devices so they stay within required accuracy limits during clinical use, including on-site and depot calibration work that supports compliance and patient safety.
Scope exclusions: It excludes calibration of purely industrial instruments and non-clinical consumer gadgets that are not regulated and used for medical diagnosis or therapy.
Segments Covered in This Report
- By Equipment Type
- Vital Sign Monitors
- Ventilators
- Fetal Monitors
- Cardiovascular Monitors
- Imaging Equipment
- Infusion Pumps
- Other Equipment
- By Type of Service
- In-house Calibration Services
- Third-party Calibration Services
- OEM Calibration Services
- By End User
- Clinical Laboratories
- Hospitals
- Others (Home-care, Ambulatory, OEM Labs)
- By Geography
- North America
- United States
- Canada
- Mexico
- Europe
- Germany
- United Kingdom
- France
- Italy
- Spain
- Rest of Europe
- Asia-Pacific
- China
- Japan
- India
- Australia
- South Korea
- Rest of Asia-Pacific
- Middle East & Africa
- GCC
- South Africa
- Rest of Middle East & Africa
- South America
- Brazil
- Argentina
- Rest of South America
- North America
Data Sources, Market Sizing, and Validation
Desk Research
Desk work starts with mapping where calibration demand comes from and what drives calibration frequency across healthcare providers. We used public sources such as FDA medical device and quality system guidance, ISO and IEC standards summaries, CMS and OECD health system statistics, WHO healthcare capacity indicators, and national health ministry publications to anchor terminology and compliance needs.
To turn that context into sizing inputs, we reviewed annual reports and investor presentations, calibration and metrology association materials, and peer-reviewed biomedical engineering articles, along with reputable press coverage on device uptime and quality audits. Where helpful, paid subscription tools for company financials and a patent database were used to confirm service mix signals and technology shifts. This desk source list is illustrative, and many additional public references were used for cross-checking and clarification.
Primary Interviews and Surveys
Primary discussions were held with calibration service providers, hospital and lab engineering teams, and quality and compliance leaders to confirm service scope, pricing behavior, and recalibration frequency for key device categories. Since this is a global market, we also reviewed how regulation pressure, outsourcing levels, and installed-base growth differ by region, so the assumptions remain realistic across major geographies.
Distribution of primary research fieldwork respondents
| Company type | Respondent position | Region |
|---|---|---|
| Top tier: 29% | CXOs: 16% | APAC: 44% |
| Mid tier: 52% | Functional/Unit leaders: 27% | EMEA: 32% |
| Smaller Players: 19% | Managers: 57% | Americas: 24% |
Market-Sizing & Forecasting
Sizing is built using a top-down approach where the healthcare equipment installed base and utilization signals are translated into an annual calibration demand pool, and then converted into revenue using service pricing logic. To keep the model manageable, we corroborated totals with selective bottom-up checks such as sampled average selling price by device class, channel feedback on service bundles, and roll-ups from a small set of service providers where public revenue splits were available.
Key inputs that shaped the model include the share of devices under mandatory periodic calibration, typical calibration intervals by equipment category, outsourcing penetration versus in-house work, average service ticket values for on-site versus depot calibration, and the pace of new device installations in hospitals and clinical labs. When some device groups lacked clear public data, we used adjacent categories and then narrowed the ranges through expert review.
For forecasting, scenario analysis was used, with base, conservative, and accelerated cases tied to expected regulatory enforcement intensity, hospital capex cycles, and labor availability for biomedical engineering teams. Assumptions were then aligned to expert consensus to ensure growth does not run ahead of observable capacity and adoption constraints.
Data Validation & Update Cycle
Outputs are checked against independent signals such as healthcare facility growth, medical device shipment momentum in key categories, and reported service revenue trends, and then reviewed for unusual jumps that do not match the input drivers. When variances appear, we re-check unit assumptions, currency conversions, and the point where service scope could have shifted into adjacent maintenance work.
A multi-step internal review is completed before sign-off, and clarifications are re-confirmed with selected interviewees when assumptions materially shift. The report is refreshed annually, and interim updates are made when major regulatory changes, macro events, or step-changes in hospital spending are observed. Right before delivery, a final pass is done so clients receive the latest updated view.
Mordor Intelligence's Medical Equipment Calibration Market Size Measured Against Other Published Estimates
It is common to see different market sizes for medical equipment calibration because publishers do not always use the same service boundary, end users, and timing of currency normalization. Differences also show up when one estimate treats bundled service contracts as calibration revenue, while another separates calibration from repair and preventive maintenance.
By tracking installed base growth, calibration interval norms, and a clear split between calibration-only revenue and adjacent service lines, Mordor Intelligence lands on a 2026 total that does not get inflated by broader maintenance bundles or non-clinical instrument work.
Benchmark comparison
| Source | Market Size | Gaps in Research Methodology |
|---|---|---|
| Mordor Intelligence | USD 1.97 B (2026) | |
| Global Consultancy A | USD 1.64 B (2024) | Uses a 2024 base and appears to emphasize calibration services as a bundled offering across OEM, third-party, and in-house models, where pricing and contract packaging can shift revenue timing versus a device-need-based demand build. |
| Industry Publisher B | USD 1.83 B (2025) | Uses a 2025 base and groups services by delivery model, which can widen scope if preventive maintenance and compliance testing are not consistently separated from calibration-only work across regions. |
The spread in values mainly reflects differences in base year selection and how strictly calibration is separated from nearby service activities. When the scope is kept consistent and the demand drivers are tied back to device needs and calibration frequency, the result becomes easier to trace and repeat across regions.
Key Questions Answered in the Report
What is the projected size of the Medical Equipment Calibration Market in 2031?
The Medical Equipment Calibration Market size is forecast to reach USD 3.35 billion by 2031 under an 11.22% CAGR during 2026-2031.
Which equipment category currently commands the largest share?
Imaging systems such as CT, MRI, and x-ray units held 32.78% of global revenue in 2025 within the Medical Equipment Calibration Market.
Why are third-party calibration providers growing faster than OEM service arms?
Hospitals and clinics adopt multi-vendor cost-optimization strategies, pushing third-party firms to a 13.96% CAGR through 2031 in the Medical Equipment Calibration Market.
How do new FDA regulations affect calibration demand?
The FDA QMSR aligns U.S. rules with ISO 13485 and mandates deeper traceability, expanding documentation and service requirements.
Which region will see the fastest calibration service growth?
Asia-Pacific is projected to record a 12.14% CAGR through 2031 in the Medical Equipment Calibration Market thanks to rapid hospital construction and local device manufacturing expansion.
What is the main bottleneck slowing service capacity worldwide?
A shortage of ISO/IEC 17025-accredited technicians vacancy rates near 20% in some regions limits how quickly providers can scale.