
Medical Electronics Market Size and Share
Market Overview
| Study Period | 2020 - 2031 |
|---|---|
| Market Size (2026) | USD 11.92 Billion |
| Market Size (2031) | USD 16.44 Billion |
| Growth Rate (2026 - 2031) | 6.65 % |
| Fastest Growing Market | Asia Pacific |
| Largest Market | North America |
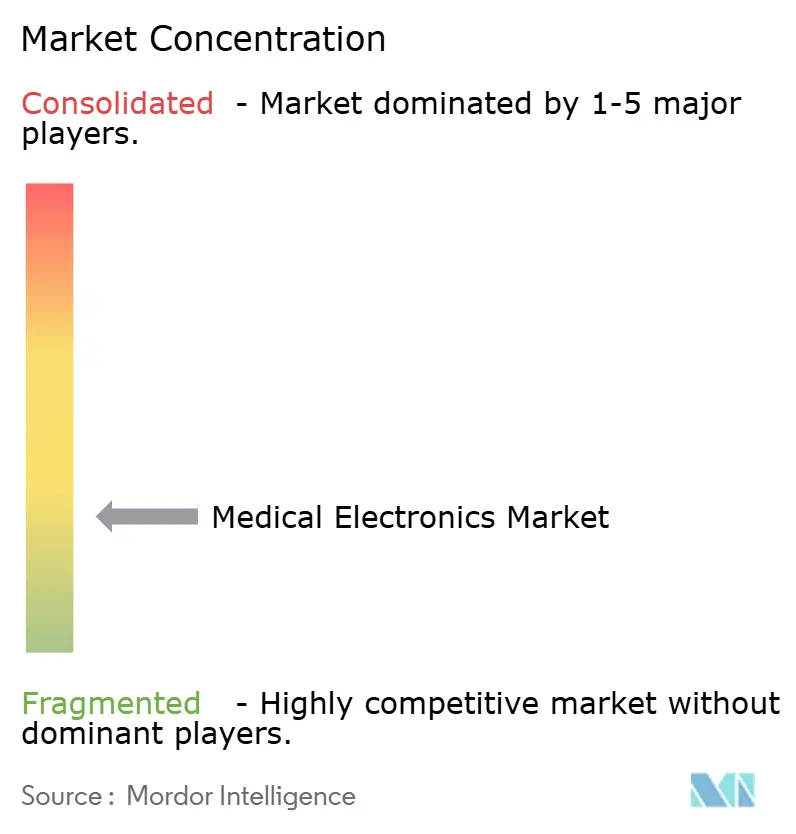
| Market Concentration | Low |
Major Players *Disclaimer: Major Players sorted in no particular order Image © Mordor Intelligence. Reuse requires attribution under CC BY 4.0. | |
Medical Electronics Market Analysis by Mordor Intelligence
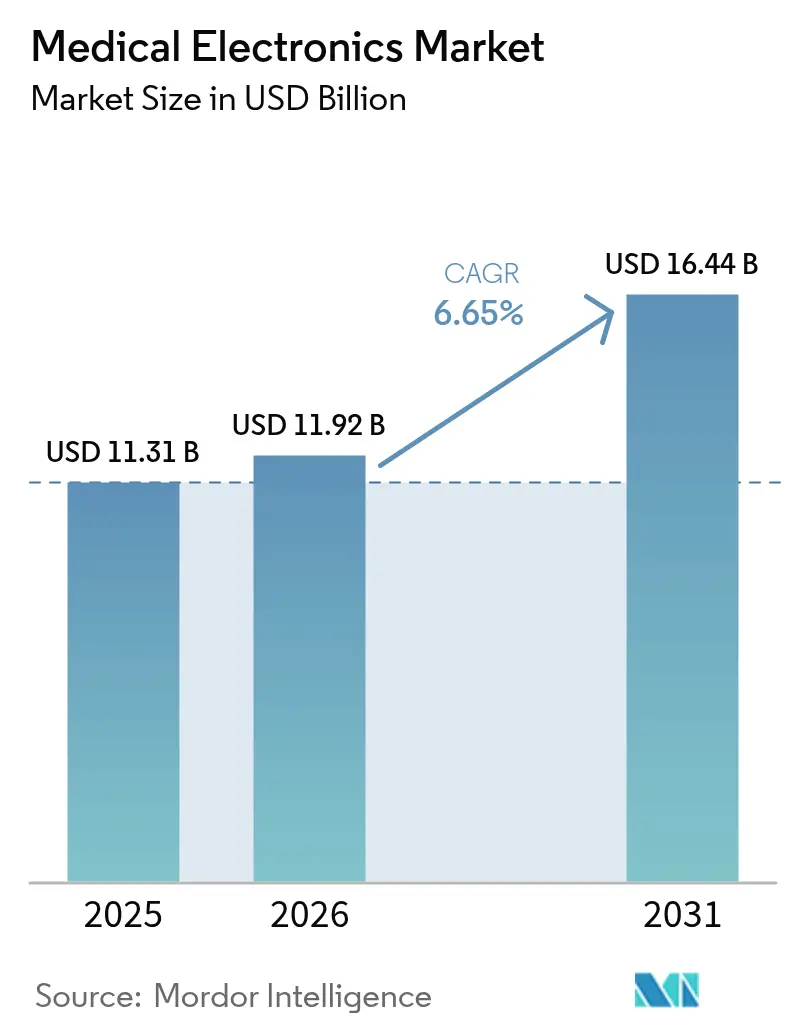
The Medical Electronics Market size is projected to be USD 11.31 billion in 2025, USD 11.92 billion in 2026, and reach USD 16.44 billion by 2031, growing at a CAGR of 6.65% from 2026 to 2031.
A reimbursement shift toward outcome-linked payments is steering capital from episodic imaging toward continuous monitoring, accelerating demand for AI-enabled wearables and implantables. Semiconductor shortages are easing, yet component dual-sourcing remains a standard design discipline as manufacturers hedge against any return of foundry bottlenecks. Cybersecurity compliance has become a front-end design criterion after the FDA’s 2024 guidance, prompting OEMs to build software bills of materials into every connected asset.[1] Meanwhile, helium scarcity is nudging radiology budgets toward low-cryogen MRI platforms, opening disruptive lanes for zero-boil-off magnet developers. Market leaders are pivoting from one-time hardware sales to recurring digital-service subscriptions, pairing equipment uptime guarantees with analytics that prove value under emerging value-based contracts.
Key Report Takeaways
- By product type, diagnostic imaging led with 39.68% of medical electronics market share in 2025 while wearables and implantables are advancing at a 10.73% CAGR through 2031.
- By component, sensors and MEMS commanded 32.33% share of the medical electronics market size in 2025 and are forecast to expand at 9.43% CAGR over 2026-2031.
- By end-user, hospitals and clinics held 44.72% of 2025 spending, whereas home-healthcare settings are projected to post a 9.01% CAGR to 2031.
- By clinical application, cardiology captured 29.44% share of the medical electronics market size in 2025; oncology is set to record a 10.33% CAGR during 2026-2031.
- By connectivity, wired LAN and field-bus links accounted for 51.29% of 2025 revenues, but Bluetooth Low Energy is rising at an 8.24% CAGR through 2031.
- By geography, North America led with 33.46% revenue share in 2025, whereas Asia-Pacific is forecast to advance at an 8.02% CAGR through 2031.
Note: Market size and forecast figures in this report are generated using Mordor Intelligence’s proprietary estimation framework, updated with the latest available data and insights as of 2026.
Market Trends and Insights
Drivers Impact Analysis of Medical Electronics Market*
| Driver | (~) % Impact on CAGR Forecast | Geographic Relevance | Impact Timeline |
|---|---|---|---|
| Rapid Adoption of AI-Enabled Imaging Modalities | +1.4% | North America, Europe | Medium term (2-4 years) |
| Shift Toward Home-Based and Wearable Diagnostics | +1.6% | North America, Europe, APAC | Short term (≤ 2 years) |
| Regulatory Push for IEC 60601-1 4th Edition Compliance | +0.8% | Global | Long term (≥ 4 years) |
| Emergence of Printable & Flexible Bioelectronics | +0.7% | North America, APAC | Long term (≥ 4 years) |
| Growing Demand for Radiation-Hard Semiconductors in Proton Therapy | +0.5% | North America, Europe, China | Medium term (2-4 years) |
| Expansion of Telehealth Reimbursement for Remote Monitoring | +1.3% | North America, Europe | Short term (≤ 2 years) |
| Source: Mordor Intelligence | |||
Rapid Adoption of AI-Enabled Imaging Modalities
More than 600 AI-enabled devices cleared by the FDA by mid-2024 have turned image-analysis tasks into near-real-time workflows, trimming MRI scan times by up to 50% and cutting interpretation backlogs.[2] Providers recoup investments swiftly because Medicare Advantage and several European payers reimburse AI-assisted reads at premium rates, enhancing ROI while creating defensible upgrade cycles.
Shift Toward Home-Based and Wearable Diagnostics
Expanded U.S. remote patient-monitoring codes that came into force in 2026 pay physicians for reviewing patient-generated data, turning connected wearables into reimbursable assets.[3] Continuous glucose monitors and cuff-less blood-pressure devices are embedding multi-parameter sensing and mobile links, allowing clinicians to titrate therapies without office visits.
Regulatory Push for IEC 60601-1 4th Edition Compliance
Draft revisions fortify cyber-safety and software lifecycle rigor, effectively raising design-verification workloads, yet offering market access advantages to firms with mature quality systems. Procurement teams in group-purchasing organizations increasingly stipulate 60601-1 compliance, turning certification into a sales gatekeeper.
Emergence of Printable & Flexible Bioelectronics
Stretchable, ultra-thin circuits demonstrated by Stanford and University of Tokyo labs in 2024 deliver artifact-free signals even under 50% strain, paving the way for skin-conformal ECG patches that could retail below USD 1 per sensor once roll-to-roll yields mature. First-wave commercial pilots focus on wound-healing monitors where disposability offsets higher unit cost.
Restraints Impact Analysis of Medical Electronics Market*
| Restraint | (~) % Impact on CAGR Forecast | Geographic Relevance | Impact Timeline |
|---|---|---|---|
| Silicon Supply-Chain Volatility Post-2025 | −0.9% | Global | Short term (≤ 2 years) |
| Stringent Post-Market Surveillance Under EU MDR | −0.7% | Europe | Medium term (2-4 years) |
| Cybersecurity Certification Bottlenecks for Connected Implants | −0.6% | North America, Europe | Medium term (2-4 years) |
| Helium Shortage Elevating MRI Magnet Costs | −0.4% | Global | Long term (≥ 4 years) |
| Source: Mordor Intelligence | |||
Silicon Supply-Chain Volatility Post-2025
Lead-times for power semiconductors peaked at 52 weeks in 2024, forcing many device OEMs into expensive redesigns or spot-market buys that eroded margins. New fabs funded by the CHIPS Acts will not ease constraints until after 2027.
Stringent Post-Market Surveillance Under EU MDR
Mandatory periodic safety-update reporting and clinical-evidence updates add USD 0.5-1 million in annual compliance overhead for mid-size firms, prompting some niche suppliers to exit the EU or merge with better-capitalized partners.
*Our forecasts treat driver/restraint impacts as directional, not additive. The impact forecasts reflect baseline growth, mix effects, and variable interactions.
Medical Electronics Market Segment Analysis
By Product Type:
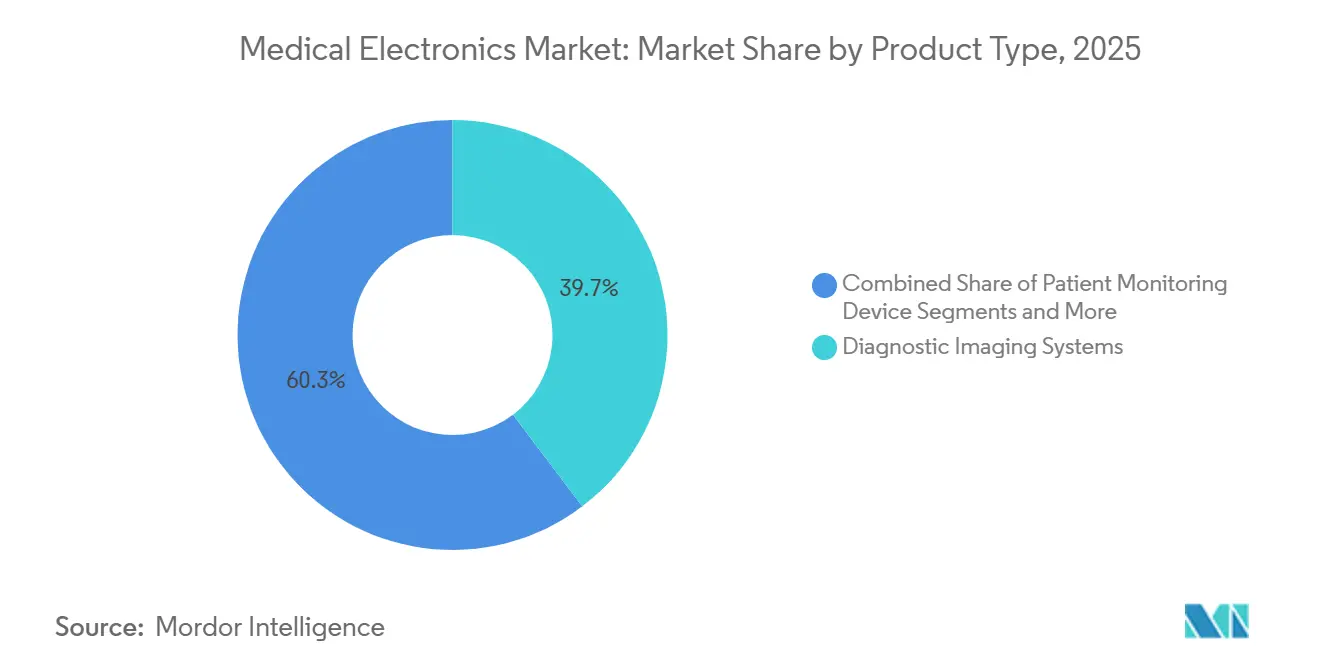
Imaging Anchors Revenue, Wearables Drive GrowthDiagnostic imaging platforms generated 39.68% of 2025 revenue, underpinning the medical electronics market through multiyear service contracts and upgrade bundles. Imaging OEMs now embed on-device AI to automate reconstruction and annotate scans, recapturing value that once flowed to stand-alone software vendors.
Wearables and implantables, while smaller in absolute revenue, are forecast to expand at a 10.73% CAGR through 2031. Reimbursement for continuous glucose and blood-pressure monitoring plus smartphone tethering is lifting average selling prices. This double-digit trajectory will steadily lift the medical electronics market as capital-light home devices supplement hospital imaging budgets.

By Component:
Sensors and MEMS Lead, Power ICs TrailSensors and MEMS accounted for 32.33% of 2025 sales and will rise at 9.43% per year, a pace that outstrips every other chip class. Miniaturized inertial and biochemical sensors allow single-use adhesive patches that stream multi-vital data over Bluetooth or Wi-Fi. Power-management ICs lag on growth yet remain essential for battery-operated form factors. Early adoption of solid-state batteries in cochlear and cardiac implants promises longer replacement cycles, reinforcing aftermarket parts revenue in the medical electronics market.
By End-User:
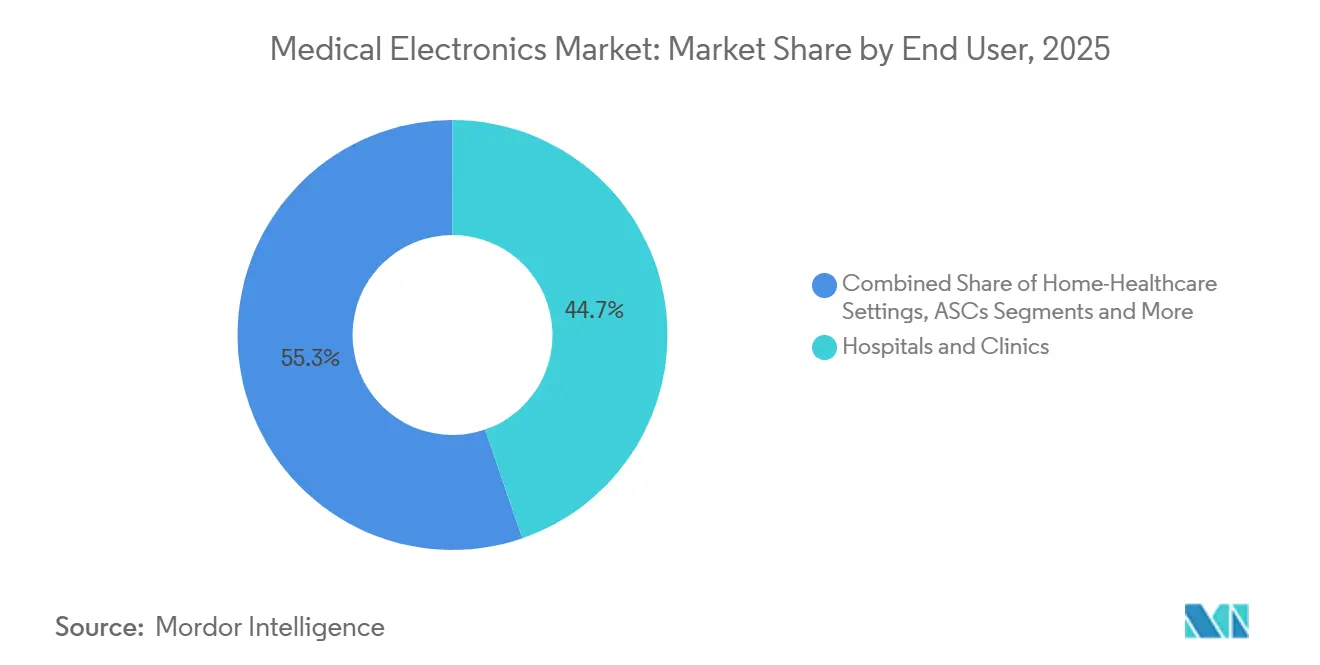
Hospitals Hold Share, Home Settings SurgeHospital procurement represented 44.72% of 2025 revenue, reflecting capital-equipment lifecycles and in-house biomedical engineering support. Home-healthcare, however, is climbing at a 9.01% CAGR, converting disease-management workflows into reimbursable RPM service lines. Retail pharmacies and e-commerce storefronts extend distribution reach, broadening the medical electronics market to an audience once served almost exclusively by institutional buyers.
By Clinical Application:
Cardiology Dominates, Oncology AcceleratesCardiology’s entrenched 29.44% revenue share is underpinned by chronic-disease prevalence and well-established reimbursement. Oncology platforms, growing at 10.33% CAGR, benefit from proton therapy’s higher payment rates and the push for adaptive radiation planning, expanding the overall medical electronics market size allocated to cancer care technologies.
By Connectivity:
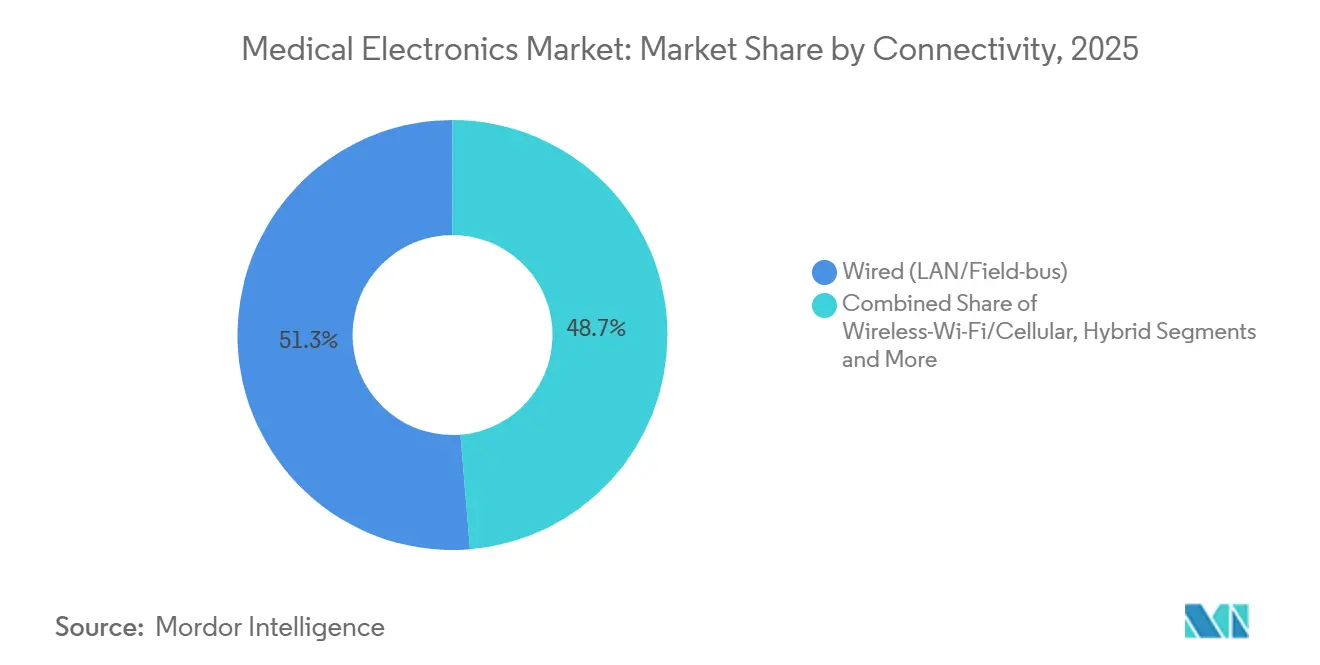
Wired Dominates, Wireless Gains TractionWired LAN and field-bus architectures still claimed 51.29% of 2025 connectivity revenue owing to deterministic performance in critical care. Bluetooth Low Energy and Wi-Fi nodes are advancing at 8.24% CAGR, especially in wearables. FDA-mandated SBOMs elevate the cost of wireless certification, yet interoperability gains and Wi-Fi 6E deployments are narrowing latency gaps, expanding wireless’s footprint inside the medical electronics market.
Geography Analysis
North America Medical Electronics Market
North America generated 33.46% of 2025 revenue, buoyed by CMS reimbursement expansion and the FDA’s fast-track pathways for AI-based devices. Robust venture funding channels accelerate commercialization, sealing the region’s leadership in both imaging and wearable pipelines.
Europe Medical Electronics Market
Europe trails in share but boasts harmonized market access under EU MDR, simplifying multi-country launches once conformity is achieved. Germany’s Digital Healthcare Act offers structured coding for digital therapeutics, turning the bloc into a proving ground for outcome-based payment models.
APAC Medical Electronics Market
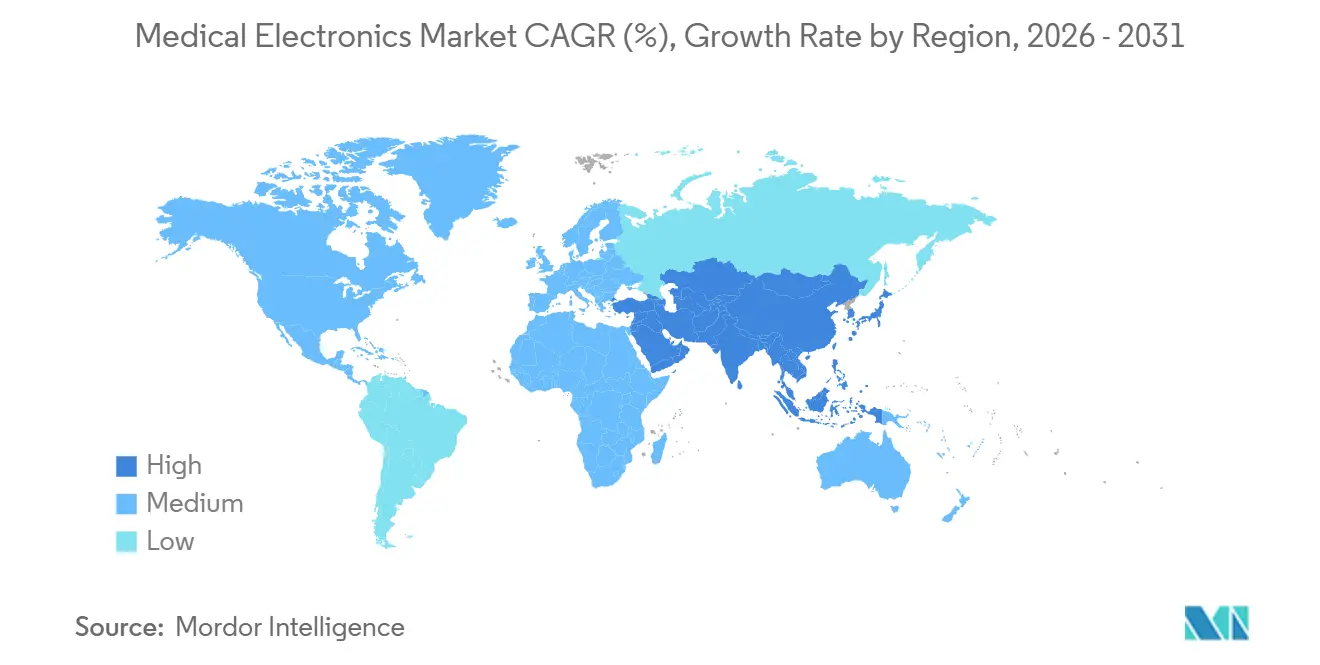
Asia-Pacific is the fastest-growing region at 8.02% CAGR. China’s localization push for high-end ultrasound and MRI components and India’s Production-Linked Incentive scheme draw OEM assembly and R&D footprints into the region, lifting the medical electronics market across APAC.
Regulatory Landscape
Regulation for medical electronics is tightening around cybersecurity, usability engineering, and traceability, raising the documentation burden for connected imaging, monitoring, and implantable platforms. In the United States, the FDA has reinforced front-end expectations for connected devices through its 2024 cybersecurity guidance, making software bills of materials and secure development practices a practical gate for premarket submissions, while May 2026 final FDA human factors guidance formalized a risk-based framework for usability information in marketing submissions.
In Europe, compliance under EU MDR continues to shape market access through more stringent post-market surveillance and conformity assessment capacity, and the European Commission moved EUDAMED into mandatory use for the first four modules (Actors, UDI/Devices, Notified Bodies and Certificates, and Market Surveillance) in May 2026, which elevates data readiness as a launch prerequisite. In China, the NMPA signaled a heavy 2026 workload with an industry standards development and revision plan covering over 80 standards (February 2026) and a guidelines revisions plan spanning 56 Class III and 219 Class II categories (April 2026), increasing the need for affected-product mapping and re-registration planning for manufacturers selling across regions.
Value Chain Analysis
The medical electronics value chain spans semiconductor and subcomponent inputs (sensors and MEMS, MCUs/MPUs and DSPs, power management ICs, batteries, displays, connectors, and PCBs), device OEM design and verification (including IEC 60601-1 safety and software lifecycle requirements), regulated manufacturing and final assembly, and downstream distribution through hospital procurement, imaging centers, and retail and e-commerce channels that support home monitoring. As devices add connectivity, cybersecurity and SBOM processes increasingly sit alongside traditional V and V as upstream gating steps that influence component choices and supplier qualification.
Supply chain strategy has shifted from cost-optimized global sourcing to resilience-led architectures, with persistent bottlenecks reported around PCBs, power supplies, connectors, and high-voltage/current components, and with OEMs leaning more on EMS/CDMO partners and integrated on-site support models. Outsourcing penetration in medical electronics reached about 38% by 2025 as OEMs redirect capital toward clinical validation and software, while dual-sourcing and regionalized production and distribution have become common responses to tariff and trade-policy uncertainty and to volatility in electronics lead times that peaked in 2024.
Competitive Landscape
Top-tier OEMs such as Siemens Healthineers, GE HealthCare, Philips, and Medtronic leverage installed bases and global service to defend high-ticket imaging and therapy franchises. Semiconductor specialists—Texas Instruments, Analog Devices, STMicroelectronics—differentiate on low-power performance and pre-certified wireless stacks, securing sockets inside next-generation wearables. Start-ups occupy remote-monitoring niches, selling direct to consumers or partnering with telehealth platforms to unlock reimbursement swiftly. Edge-AI capability, regulatory readiness, and cybersecurity posture define competitive advantage as the medical electronics market shifts from hardware margin capture to software-subscription annuities.
Medical Electronics Industry Leaders
-
Koninklijke Philips N.V.
-
Siemens Healthcare GmbH
-
Medtronic
-
GE Healthcare
-
Abbott Laboratories
- *Disclaimer: Major Players sorted in no particular order
Medical Electronics Market Companies Covered in this Report
- Abbott Laboratories
- Analog Devices
- Boston Scientific
- Canon
- Dexcom
- FUJIFILM
- GE Healthcare
- Koninklijke Philips
- Masimo
- Medtronic
- NXP Semiconductors
- OMRON
- Renesas Electronics
- Samsung Group
- Shimadzu
- Siemens Healthineers
- STMicroelectronics
- TDK Corporation
- TE Connectivity
- Texas Instruments
Market Opportunities and Future Outlook
Reimbursement and care-site shifts are creating whitespace for connected monitoring electronics, particularly in home-health workflows that can be billed and operationalized as remote patient monitoring service lines. The US CMS Calendar Year 2026 Physician Fee Schedule final rule expanded remote patient-monitoring reimbursement for reviewing patient-generated data, supporting higher attach rates for Bluetooth-enabled wearables and connected peripherals that integrate into clinician review systems.
On the manufacturing side, opportunities concentrate around regional capacity, quality-system readiness, and electronics outsourcing that can absorb compliance and traceability requirements under EU MDR and similar frameworks. Concrete capacity and capability moves in 2026 include ESCATEC obtaining ISO 13485:2016 certification at its UK facility (Lutterworth) to expand medtech electronics manufacturing, and Polymatech executing a long-tenure land lease at SIPCOT Medical Devices Park backed by a large investment to scale advanced medical device manufacturing in India. Product opportunities also expand where device categories merge hardware with software and AI at the edge, as seen in major OEM launches of AI-enabled imaging and workflow platforms and the continued pipeline of FDA-cleared AI-enabled devices that is reshaping upgrade cycles and service-led commercialization models.
Recent Industry Developments in Medical Electronics Market
- July 2026: Philips announced a major expansion of its AI-powered ultrasound platform with the Alturion system, backed by FDA 510(k) clearance and CE mark, signaling a strategic push into high-volume imaging workflows and software-enabled services.
- June 2026: Medtronic closed its USD 550 million acquisition of Scientia Vascular, broadening its neurovascular portfolio with integrated catheter-based navigation ecosystems and cross-selling across interventional platforms.
- April 2026: Medtronic received FDA clearance and launched the Mosaic Neo mitral bioprosthesis, enabling multiple access approaches and accelerating upgrade cycles for structural heart therapy systems that integrate device electronics and imaging guidance.
Medical Electronics Market Report Scope and Research Methodology
Market Definition and Coverage
For this study, the market covers the value of active electronic components and embedded circuits that enable medical devices used for diagnosis, monitoring, and therapy in human healthcare. The sizing is tracked in current USD at factory-gate level, and then consolidated at a global level.
Scope exclusions: We exclude non-electronic consumables, standalone software sold without bundled hardware, contract manufacturing revenues, and veterinary devices.
Segments Covered in This Report
- By Product Type
- Diagnostic Imaging Systems
- Patient Monitoring Devices
- Therapeutic & Surgical Devices
- Wearables & Implantables
- By Component
- Sensors & MEMS
- Power Management ICs & Batteries
- MCUs/MPUs & DSPs
- Displays & Optoelectronics
- By End-user
- Hospitals & Clinics
- Home-Healthcare Settings
- Ambulatory Surgical Centers
- Diagnostic Imaging Centers
- By Clinical Application
- Cardiology
- Neurology
- Oncology
- Orthopedics
- Others
- By Connectivity
- Wired (LAN/Field-bus)
- Wireless—Bluetooth/BLE
- Wireless—Wi-Fi/Cellular
- Hybrid (Wired + Wireless)
- By Geography
- North America
- United States
- Canada
- Mexico
- Europe
- Germany
- France
- United Kingdom
- Italy
- Spain
- Rest of Europe
- Asia-Pacific
- China
- Japan
- India
- South Korea
- Australia
- Rest of Asia-Pacific
- Middle East & Africa
- GCC
- South Africa
- Rest of Middle East & Africa
- South America
- Brazil
- Argentina
- Rest of South America
- North America
Data Sources, Market Sizing, and Validation
Desk Research
Desk research was used to set the market frame and to build consistent input series before any forecasting was attempted. We relied on public and official sources such as the World Health Organization for health system indicators, the World Bank for macro and health spend context, and the US FDA device databases to understand device categories and approval flows that shape electronics demand.
To make the inputs operational, we also reviewed sources such as OECD Health Statistics and United Nations Comtrade trade data for relevant electronics flows, alongside peer-reviewed journals on medical device technology adoption and component trends. Company filings, investor presentations, and association websites were used to cross-check changes in product mix, pricing direction, and manufacturing footprints. Where helpful, paid subscriptions for company financials and patent databases were referenced to validate revenue scale and innovation intensity. We used an import-export shipment-level database selectively for direction checks. This list is illustrative, and we also consulted other public sources to collect data, validate assumptions, and clarify open questions.
Primary Interviews and Surveys
Primary work was carried out through expert interviews and structured surveys across the value chain, including component suppliers, device manufacturers, and hospital-side stakeholders who influence procurement and specifications. We used these conversations to test adoption rates for monitoring and imaging electronics, typical replacement cycles, and realistic pricing movement by component type. Coverage was balanced across APAC, EMEA, and the Americas.
Distribution of primary research fieldwork respondents
| Company type | Respondent position | Region |
|---|---|---|
| Top tier: 38% | CXOs: 13% | APAC: 45% |
| Mid tier: 42% | Functional/Unit leaders: 36% | EMEA: 36% |
| Smaller Players: 20% | Managers: 51% | Americas: 19% |
Market-Sizing & Forecasting
Sizing starts with a top-down build where healthcare device demand is reconstructed from indicators such as installed base growth for diagnostic imaging and patient monitoring, procedure volumes that influence utilization, and the typical electronics content per device class. Once the model is built out, we corroborate the totals with selective bottom-up approximations, such as sampled average selling price ranges for key components multiplied by implied unit demand. We then run channel checks on replacement and upgrade cycles.
The inputs that mattered most include imaging system shipment trends, monitoring and wearable adoption in home care, hospital capex patterns, and component price movement across sensors, MCUs, displays, and power ICs. Connectivity also affects bill-of-material shifts. Where a variable was not consistently available by country, we used a stepped approach that starts with regional anchors and then applies penetration and mix adjustments validated by interviews. Forecasts were prepared using scenario analysis, with the main path shaped by consensus expectations on device replacement cycles, reimbursement pressure, and the pace of remote monitoring uptake. We stress-tested the outlook using faster and slower adoption cases.
Data Validation & Update Cycle
Outputs are checked through multiple passes so the final number is not dependent on a single assumption. We compare model totals against independent signals, including health expenditure growth, reported device shipment direction, and trade flow movement for relevant electronics categories. When large variances appear, we investigate them before sign-off.
Anomaly checks are performed at the regional level and again at the consolidated global level. Outliers are reviewed with a second analyst to confirm the logic and math. If a key input shifts materially, respondents are re-contacted to confirm what changed and whether the change is temporary or structural. Reports are refreshed annually, with interim updates when major regulatory, supply, or demand events occur, and a final pre-delivery pass is completed so clients receive the most current view.
Mordor Intelligence's Medical Electronics Market Size Compared Against Other Published Estimates
Published market numbers for medical electronics can look far apart even when they use similar growth rates, because the underlying scope is not always the same. Differences usually come from whether the estimate is counting components and embedded electronics only, or whether it expands into full device revenues and related services.
The main gap comes from scope expansion into complete medical device systems and broader healthcare equipment. Mordor Intelligence counts only active electronic components and embedded circuits at factory-gate value, and excludes non-electronic consumables, standalone software, contract manufacturing revenue, and veterinary use. Gaps also show up when one estimate uses a different base year, applies a single pricing uplift across all electronics, or converts currencies at a different point in time, which can move the reported USD value even if underlying demand does not change in the same way.
Benchmark comparison
| Source | Market Size | Gaps in Research Methodology |
|---|---|---|
| Mordor Intelligence | USD 11.31 B (2025) | |
| Industry Publisher A | USD 66.80 B (2024) | Uses a much wider interpretation that appears to include broader medical electronics device revenues used in healthcare facilities, which inflates totals versus a components and embedded-electronics view. The base year is also earlier, which adds currency timing and pricing-cycle differences. |
| Global Research Desk B | USD 8.25 B (2024) | Anchors the market at an application-level device-and-technology view with a different base year, which can lead to a narrower counted pool and a different way of treating replacement demand. The gap can also reflect a more conservative pricing path when component ASPs are not adjusted by product mix. |
The spread in the table is largely explained by what is being counted and when it is being counted, not by a disagreement that demand is rising. By keeping the scope tied to electronics content inside medical devices and checking assumptions with real-world adoption and replacement signals, we can provide a number that is easier to trace back to clear inputs and repeatable steps.
Key Questions Answered in the Report
What is the projected value of the medical electronics market in 2031?
Forecasts indicate USD 16.44 billion by 2031, reflecting a 6.65% CAGR over 2026-2031.
Which product category is expected to grow fastest toward 2031?
Wearables and implantables are on track for a 10.73% CAGR, outpacing all other categories as remote monitoring scales under new reimbursement codes.
How large is cardiology’s revenue contribution?
Cardiology devices accounted for 29.44% of 2025 sales and remain the largest clinical application slice.
Why is helium scarcity a concern for imaging centers?
Rising helium prices lengthen MRI magnet lead-times and push providers toward zero-boil-off or alternative imaging modalities.
Which region will expand quickest through 2031?
Asia-Pacific leads with an 8.02% CAGR, propelled by China’s localization drive and India’s PLI incentives for local manufacturing.
What compliance changes will most impact new device launches?
The forthcoming IEC 60601-1 4th Edition and tougher cybersecurity rules will demand deeper design verification and post-market surveillance.