Market Overview
| Study Period | 2020 - 2031 |
|---|---|
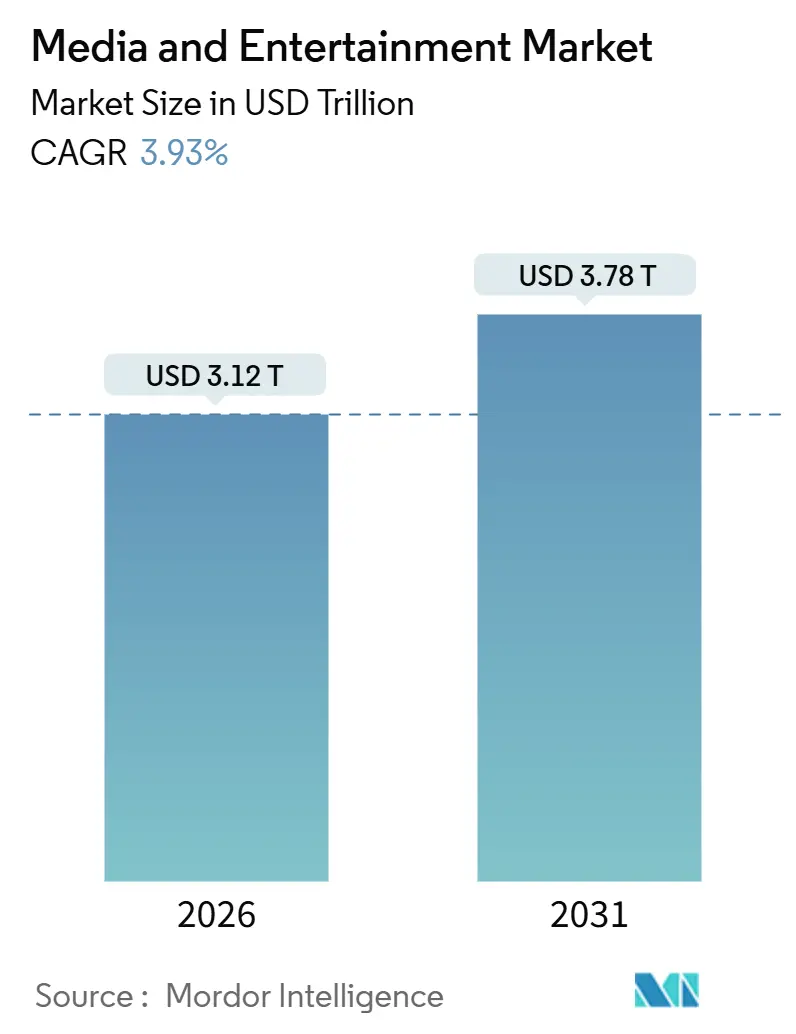
| Market Size (2026) | USD 3.12 Trillion |
| Market Size (2031) | USD 3.78 Trillion |
| Growth Rate (2026 - 2031) | 3.93% CAGR |
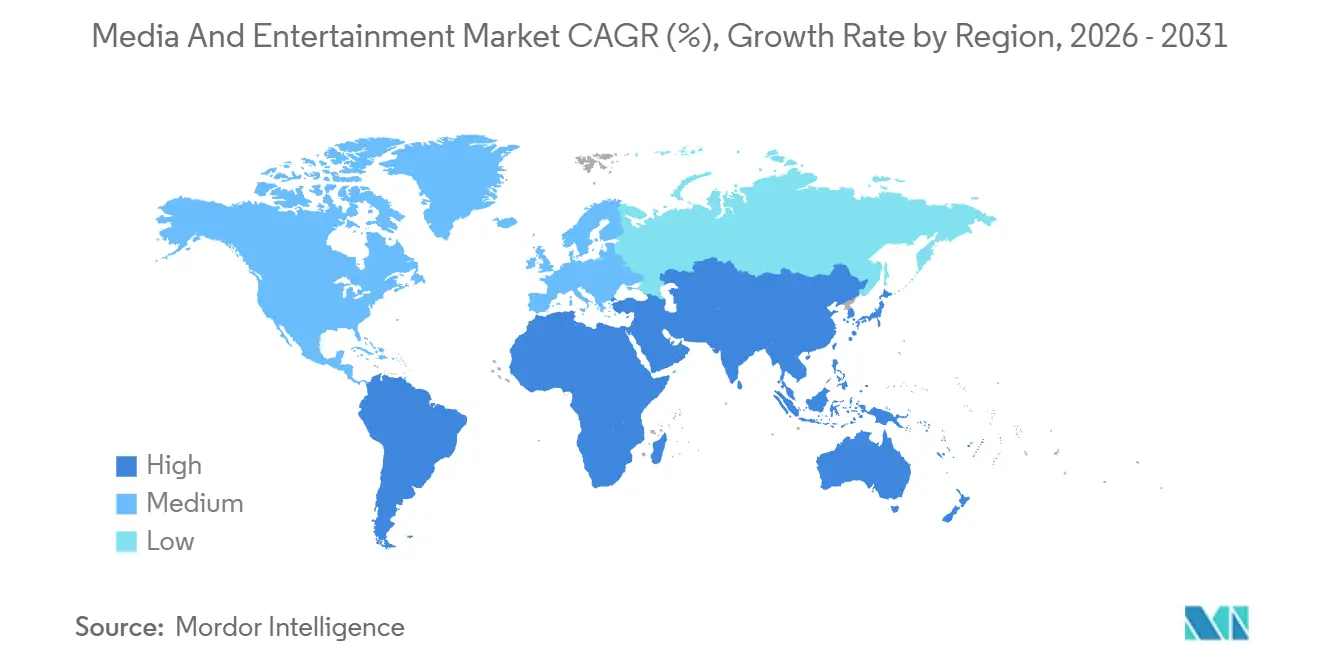
| Fastest Growing Market | Asia Pacific |
| Largest Market | North America |
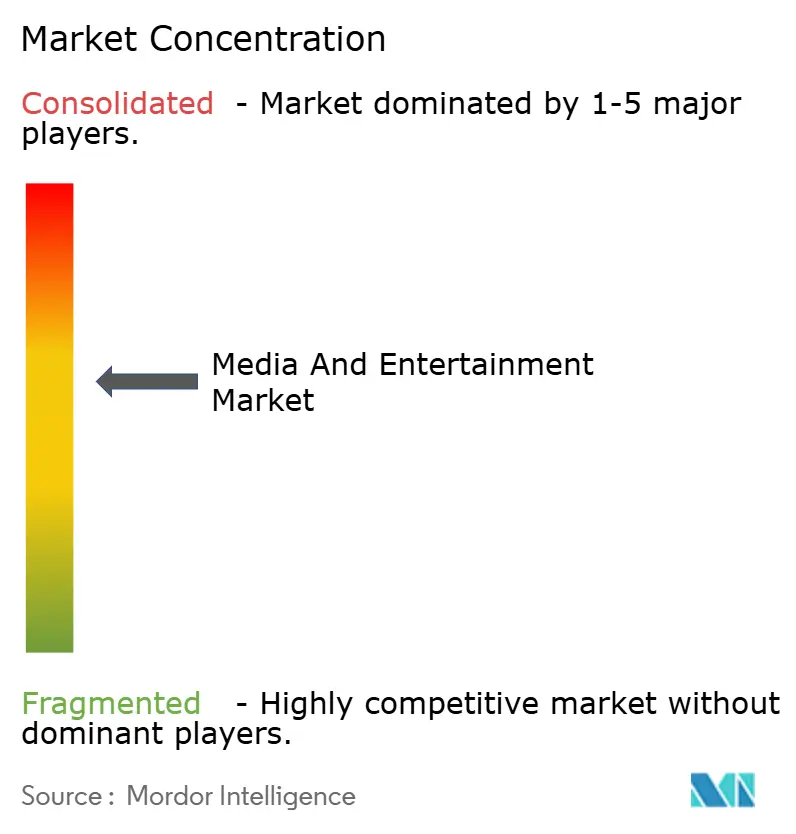
| Market Concentration | Medium |
Major Players *Disclaimer: Major Players sorted in no particular order Image © Mordor Intelligence. Reuse requires attribution under CC BY 4.0. | |
Media And Entertainment Market Analysis by Mordor Intelligence
The media and entertainment market size stood at USD 3.12 trillion in 2026 and is projected to reach USD 3.78 trillion by 2031, reflecting a 3.93% CAGR over the forecast period. Growth rests on the pivot from legacy print and linear broadcast to streaming, connected-TV advertising, and AI-driven personalization. Large advertisers are shifting budgets toward addressable video as smartphone saturation, 5G speeds, and smart-TV penetration expand audiences. Digital fatigue in North America is encouraging hybrid ad-supported tiers, while India, China, and Brazil add new users at a faster clip than mature regions. Meanwhile, software-defined production, reduced localization costs, and virtual sets allow smaller studios to match incumbent production values, intensifying competition across the value chain.
Key Report Takeaways
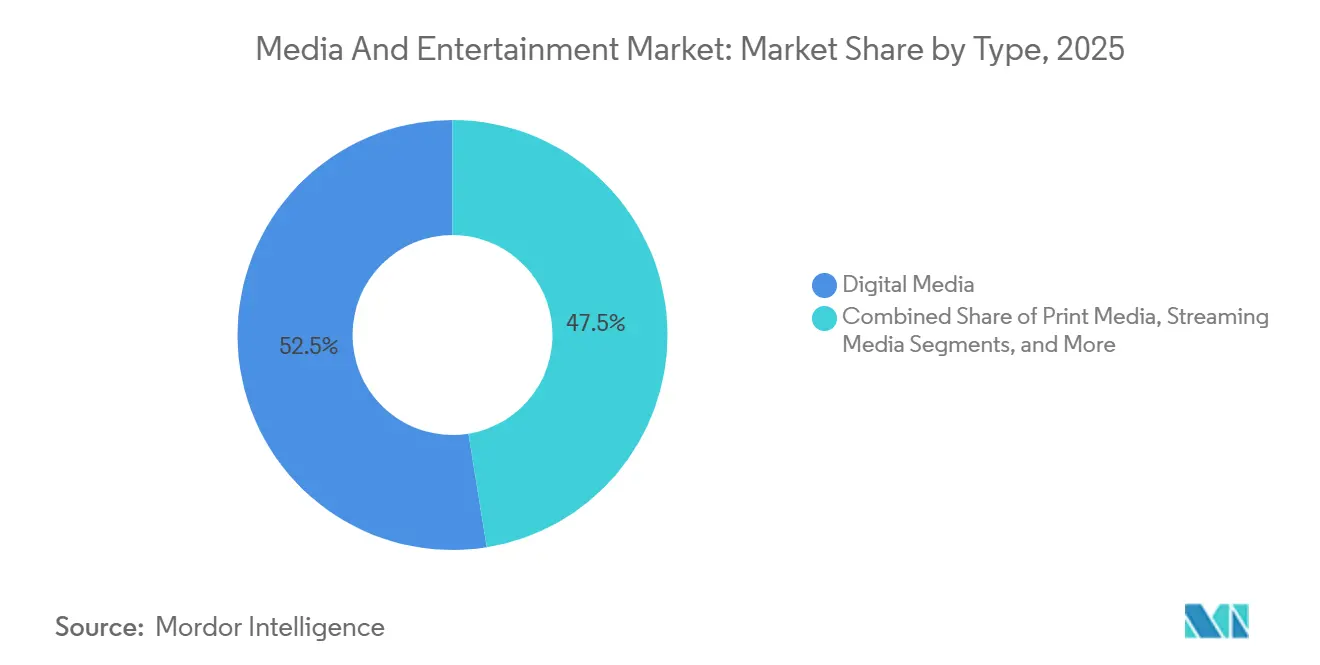
- By content type, digital media led with 52.54% revenue share in 2025, whereas streaming platforms are advancing at a 4.77% CAGR through 2031.
- By revenue model, advertising held 47.82% of 2025 turnover, yet subscriptions are posting the quickest rise at 4.81% CAGR to 2031.
- By device platform, smartphones and tablets commanded 51.43% of 2025 revenue, but smart TVs and set-top boxes are growing at a 4.69% CAGR.
- By geography, North America held 39.87% media and entertainment market share in 2025, while Asia-Pacific is set to log the fastest 5.03% CAGR through 2031.
Note: Market size and forecast figures in this report are generated using Mordor Intelligence’s proprietary estimation framework, updated with the latest available data and insights as of January 2026.
Global Media And Entertainment Market Trends and Insights
Drivers Impact Analysis*
| Driver | (~) % Impact on CAGR Forecast | Geographic Relevance | Impact Timeline |
|---|---|---|---|
| Proliferation of 5G-enabled mobile video consumption in Asia | +0.8% | Asia-Pacific core, spillover to Middle East | Medium term (2-4 years) |
| Surging connected-TV ad spend by U.S. retail and CPG brands | +0.7% | North America, early adoption in Europe | Short term (≤ 2 years) |
| Rapid uptake of FAST channels in Europe | +0.6% | Europe, expanding to South America | Medium term (2-4 years) |
| Generative AI-based local-language dubbing expanding OTT reach in Middle East | +0.5% | Middle East and Africa, Asia-Pacific secondary | Long term (≥ 4 years) |
| Emergence of virtual production studios reducing content creation costs | +0.4% | Global, concentrated in North America and Europe | Long term (≥ 4 years) |
| In-game advertising monetization in mobile esports titles | +0.3% | Asia-Pacific dominant, North America secondary | Medium term (2-4 years) |
| Source: Mordor Intelligence | |||
Proliferation Of 5G-Enabled Mobile Video Consumption In Asia
Asia-Pacific crossed 1.7 billion 5G connections in 2025, lowering latency below 20 milliseconds and turning mobile into the primary screen for video. Indian operators bundled unlimited streaming in low-cost data plans, lifting regional-language short-video apps to 40% of daily active users. Hyper-localized creators bypassed traditional gatekeepers, while programmatic mobile video ad spend reached USD 28 billion in 2025, a 35% jump year over year. Affordable 5G devices priced under USD 200 opened tier-2 and tier-3 cities where fixed broadband penetration lags, providing new runways for the media and entertainment market.
Surging Connected-TV Ad Spend By U.S. Retail And CPG Brands
United States connected-TV outlays hit USD 26.6 billion in 2025, with retail and CPG supplying 38% of incremental dollars as first-party purchase data drove conversion rates three to five times above linear TV.[1]“U.S. Podcast Advertising Revenue Surpasses USD 2.5 Billion,” Interactive Advertising Bureau, iab.com Netflix, Disney+, and Amazon launched ad tiers, adding 60% more premium inventory and letting brands reach cord-cutters at household level. Cross-platform measurement standards from the Joint Industry Committee calmed attribution concerns, shifting budgets structurally toward connected-TV.
Rapid Uptake Of FAST Channels In Europe
FAST channels claimed 35% of streaming hours in Spain by late 2025 as viewers battled subscription fatigue. Samsung TV Plus, Rakuten TV, and Pluto TV launched over 400 localized channels across Germany, France, and the United Kingdom, pushing European FAST ad revenue to EUR 1.8 billion (USD 2.0 billion) in 2025. Lighter EU content-quota rules and smart-TV household penetration above 60% enable FAST to keep siphoning spend from shrinking linear inventory.
Generative-AI Based Local-Language Dubbing Expanding OTT Reach In Middle East
Neural voice synthesis cut dubbing costs by 60–70% in 2025, letting Amazon Prime Video add Arabic tracks to 200 titles and see engagement equal to human dubs. In markets where English proficiency is below 40%, willingness to pay rises 25–30% when native audio is available. By scaling AI dubbing, platforms unlock growth in regions where content availability outweighs price sensitivity.
Restraints Impact Analysis*
| Restraint | (~) % Impact on CAGR Forecast | Geographic Relevance | Impact Timeline |
|---|---|---|---|
| Heightened EU regulatory scrutiny on targeted digital ads | -0.5% | Europe, spillover effects in North America | Short term (≤ 2 years) |
| Piracy and illegal restreaming curtailing premium OTT ARPUs in Asia-Pacific | -0.4% | Asia-Pacific dominant, emerging in Africa | Medium term (2-4 years) |
| Supply-chain shortages of next-gen graphics chips for immersive media | -0.3% | Global, acute in North America and Asia-Pacific | Short term (≤ 2 years) |
| Rising content acquisition costs eroding streaming profitability | -0.4% | Global, concentrated among subscription platforms | Long term (≥ 4 years) |
| Source: Mordor Intelligence | |||
Heightened EU Regulatory Scrutiny On Targeted Digital Ads
The Digital Services Act forced explicit opt-in consent, cutting addressable video audiences 15–20% and driving compliance costs such as Meta’s EUR 500 million (USD 565 million) annual spend. Lower consent rates in Germany and France dampen conversion efficiency, pushing advertisers toward contextual targeting that delivers weaker returns and slowing media and entertainment market revenue expansion in Europe.
Piracy And Illegal Restreaming Curtailing Premium OTT ARPUs In Asia-Pacific
Unauthorized streams robbed legitimate platforms of USD 9 billion in potential 2025 revenue, with 40–50% of consumers in India, Indonesia, and the Philippines accessing illicit content every month. Low ARPUs of USD 2–4 constrain content investment, and site-blocking orders are routinely bypassed via VPNs, trapping platforms in a low-margin equilibrium and restraining the media and entertainment market’s monetization upside.
*Our forecasts treat driver/restraint impacts as directional, not additive. The impact forecasts reflect baseline growth, mix effects, and variable interactions.
Segment Analysis
By Type: Streaming Platforms Overtake Legacy Digital
Streaming posted the fastest 4.77% CAGR, while digital media retained 52.54% of revenue share in 2025. Print continued its slide as mobile-first news apps ate into circulation, while video games and esports delivered double-digit mobile revenue in Asia-Pacific. Virtual reality accounted for less than 2% of the media and entertainment market despite USD 15 billion in investments from Meta, Apple, and Sony. Podcast ad revenue exceeded USD 2.5 billion in 2025, underscoring advertiser appetite for high-engagement audio.
The media and entertainment market for streaming is poised to expand as on-demand formats align with younger audiences, while legacy television grapples with an aging audience. Subscription fatigue is steering cost-conscious households toward ad-supported tiers, and high-end franchises migrate from pay-per-view to bundled offerings, pressuring transactional models but bolstering stickiness for hybrid platforms.


By Revenue Model: Hybrid Tiers Balance Growth And Risk
Advertising accounted for 47.82% of revenue in 2025, yet subscriptions are expanding fastest at a 4.81% CAGR. The media and entertainment market size linked to hybrid tiers is swelling as Netflix’s ad plan reached 40 million monthly users. Giants are packaging gaming, merchandise, and live events around marquee IP. Disney earned USD 5 billion in 2025 licensing fees.
Ad-only players face cyclical risk when macro conditions soften, whereas subscription-only services battle churn when content pipelines thin. A balanced portfolio shields cash flows, with advertising subsidizing entry-level tiers and IP extensions deepening monetization. Future regulation on algorithmic transparency, especially in Europe, could tilt the scales again by limiting ad yield optimization. [2]Disney Licensing Revenue Fiscal 2025,” The Walt Disney Company, thewaltdisneycompany.com
By Device Platform: Smart TVs Climb As Mobile Levels Off
Smartphones and tablets backed 51.43% of 2025 revenue, yet smart TVs and set-top boxes are rising at a 4.69% CAGR as connected-TV ad demand accelerates and 4K sets become affordable. Smart-TV household penetration exceeded 60% in North America, [3]Smart TV Household Penetration Exceeds 60% in North America,” Consumer Technology Association, cta.tech cementing the large screen as a prime ad canvas. The media and entertainment market share shifting toward smart TVs also raises average CPMs for premium video.
PC relevance is sliding for pure entertainment, though esports viewing and e-learning sustain niche demand. Gaming consoles serve double duty as content hubs, with over half of owners streaming video weekly. VR and AR hardware shipped 5 million units in 2025, hinting at gradual mainstreaming, yet the installed base is still too small to redirect significant wallet share from established devices.

Geography Analysis
North America retained 39.87% media and entertainment market share in 2025, buoyed by USD 26.6 billion connected-TV ads and subscription penetration exceeding three-quarters of broadband homes. However, saturation is constraining net additions, and regulators are scrutinizing data-privacy practices. Mexico is a bright spot as 5G expands, while password-sharing crackdowns lifted U.S. paid subscriber counts.
Asia-Pacific is on a 5.03% CAGR path, driven by India’s 300 million 5G users, China’s USD 45 billion mobile-gaming haul, and Southeast Asia’s rising middle class. Domestic Chinese platforms dominate via localized content and social integration, whereas foreign entrants face ownership caps. Japan and South Korea boast high per-capita spend, and Australia mirrors U.S. dynamics but on a smaller scale.
Europe posts steady progress powered by FAST channel uptake, yet the Digital Services Act and Digital Markets Act weigh on targeted ad returns. The United Kingdom, Germany, and France top revenue ranks, though Poland and Romania deliver faster growth from lower bases. South America, led by Brazil’s 80 million OTT subscribers, benefits from telco bundles and local originals. The Middle East and Africa lag in payment infrastructure, yet AI dubbing and mobile money are lowering barriers, with Saudi Arabia’s Vision 2030 accelerating digital entertainment investment.

Competitive Landscape
Roughly 45% of 2025 global revenue was held by the top 10 firms, pointing to moderate concentration. Technology giants weaponize cloud scale and AI recommendations to erode studio moats, while regional specialists thrive on language and cultural proximity. ByteDance’s TikTok surpassed 1 billion daily users, monetizing via in-feed ads and commerce.
Virtual production, AI dubbing, and dynamic ad insertion are key differentiators, driving double-digit increases in engagement and retention. Regulatory complexity, especially in Europe, favors larger incumbents able to absorb compliance overheads, while smaller entrants navigate fragmented rules at a higher relative cost.
Business-model agility now sets resilient leaders apart from scale-focused peers. Netflix's FIFA Women's World Cup deal highlights its shift to premium live sports, driving ad and subscription growth. Amazon's ad-supported Prime Video tier uses first-party commerce data to attract brand budgets. Disney's Hulu integration reduces marketing costs and churn, demonstrating the benefits of bundling. Paramount's Skydance merger and Sony's Crunchyroll consolidation emphasize vertical integration to monetize intellectual property and highlight the importance of balance-sheet scale in funding blockbuster content.
Media And Entertainment Industry Leaders
News Corporation
Comcast Corporation
Walt Disney Company
Warner Bros. Discovery, Inc.
Paramount Global
- *Disclaimer: Major Players sorted in no particular order

Recent Industry Developments
- January 2026: A major music service enabled video-podcast monetisation, letting creators use dynamic ad insertion while keeping a majority share of revenue.
- December 2025: Warner-owned networks embedded transactional sports-betting APIs in basketball broadcasts, lifting in-game ad yield by double digits over 2024 fixtures.
- November 2025: A global streamer rolled out AI dubbing across 25 languages, cutting cost per track by roughly 60% and enabling near-simultaneous global premieres.
- October 2025: An e-commerce titan acquired worldwide streaming rights to an international motorsport series for five seasons, deepening its live-events slate.


Research Methodology Framework and Report Scope
Market Definitions and Key Coverage
Our study defines the media and entertainment market as the total global spending that reaches consumers through advertising-funded, subscription, or transactional models across filmed entertainment, television, music, video games and e-sports, print and digital publishing, live events, and immersive XR experiences, delivered on devices ranging from smartphones to smart TVs and head-mounted displays. According to Mordor Intelligence, this sphere will be worth about USD 3.04 trillion in 2025 and is projected to expand steadily through 2030.
Scope exclusion: Hardware sales, telecom carriage fees, and pure infrastructure revenues lie outside this boundary.
Segmentation Overview
- By Type
- Print Media
- Newspaper
- Magazines
- Billboards
- Banners, Leaflets and Flyers
- Other Print Media
- Digital Media
- Television
- Music and Radio
- Electronic Signage
- Mobile Advertising
- Podcasts
- Other Digital Media
- Streaming Media
- OTT Streaming
- Live Streaming
- Video Games and eSports
- Virtual / Augmented Reality Content
- Print Media
- By Revenue Model
- Advertising
- Subscription
- Pay-Per-View / Transactional
- Licensing and Merchandising
- By Device Platform
- Smartphones and Tablets
- Smart TVs and Set-top Boxes
- PCs and Laptops
- Gaming Consoles
- VR / AR Headsets
- By Geography
- North America
- United States
- Canada
- Mexico
- South America
- Brazil
- Argentina
- Rest of South America
- Europe
- Germany
- United Kingdom
- France
- Spain
- Rest of Europe
- Asia-Pacific
- China
- Japan
- India
- South Korea
- Australia and New Zealand
- Rest of Asia-Pacific
- Middle East and Africa
- Middle East
- Saudi Arabia
- United Arab Emirates
- Turkey
- Rest of Middle East
- Africa
- South Africa
- Egypt
- Nigeria
- Rest of Africa
- Middle East
- North America
Detailed Research Methodology and Data Validation
Primary Research
Mordor analysts interview broadcasters, OTT platforms, record-label executives, regional ad-buyers, venue operators, and rights-management bodies across North America, Europe, Asia-Pacific, Latin America, and the Middle East. These conversations validate secondary findings, surface pricing nuances such as blended ARPU shifts, and clarify emerging revenue streams like free ad-supported streaming TV.
Desk Research
We begin by gathering macro indicators and historical revenue totals from non-paywalled tier-1 sources such as the International Trade Administration, OECD consumer-spend tables, UNESCO cinema statistics, IFPI Global Music Report, and IAB internet advertising studies. Company filings, investor presentations, and copyright royalty agency disclosures then help us map revenue flow across formats and regions.
Next, proprietary databases strengthen the picture. D&B Hoovers provides revenue splits for listed and private broadcasters, while Dow Jones Factiva offers curated news that flags material events. Marklines and Questel supply automotive and patent cues for adjacent tech trends influencing content delivery. The sources cited above are illustrative only; our analysts review many others while cross-checking facts.
Market-Sizing & Forecasting
A top-down construct converts national media-spend series, ad receipts, and consumer outlay into a unified 2024 baseline, which is then rolled forward to 2030. Supplier roll-ups, sampled average selling price-times-volume checks, and channel audits provide bottom-up reasonableness tests, allowing us to adjust for double counting. Key variables include population-weighted screen time, broadband penetration, per-capita ad spend, box-office recovery curves, content cost inflation, and smartphone installed base. Multivariate regression, combined with scenario analysis around GDP and discretionary income, produces our five-year forecast band. Gaps in segment data are bridged by conservative interpolation that is vetted in follow-up calls.
Data Validation & Update Cycle
Outputs pass anomaly and variance checks, after which a senior analyst reviews every assumption. The model refreshes annually; interim updates are triggered by material events such as regulatory shifts or major mergers. A final sense-check occurs just before we publish, ensuring clients receive the freshest perspective.
Why Mordor's Media & Entertainment Baseline Is Dependable
Published estimates often diverge because firms apply different service scopes, revenue recognition rules, and refresh cadences. We acknowledge these gaps upfront so that users can trace each figure back to clear variables.
Key differences arise when others exclude indirect advertising channels, double count adjacent cloud services, or freeze exchange rates for extended periods. Mordor, by contrast, aligns every segment to a single consumer-spend lens, refreshes currency conversions quarterly, and weights regional inputs by documented device reach and monetization models.
Benchmark comparison
| Market Size | Anonymized source | Primary gap driver |
|---|---|---|
| USD 3.04 trillion (2025) | Mordor Intelligence | - |
| USD 2.70 trillion (2024) | Global Consultancy A | Omits user-generated and live-event revenues; uses conservative ad-spend multipliers |
| USD 3.35 trillion (2025) | Research Boutique B | Bundles telecom carriage and hardware sales, inflating totals |
| USD 37.6 billion (2025) | Industry Tracker C | Focuses only on theatrical, music, and select streaming, excluding advertising |
These comparisons show that when scope alignment, currency rigor, and transparent assumptions converge, our baseline offers decision-makers a balanced, repeatable starting point grounded in verifiable market fingerprints.


Key Questions Answered in the Report
What is the current value of the media and entertainment market?
The market was valued at USD 3.12 trillion in 2026 and is forecast to reach USD 3.78 trillion by 2031.
How fast is streaming revenue growing compared with legacy digital channels?
Streaming platforms are projected to grow at a 4.77% CAGR through 2031, outpacing the broader market’s 3.93% CAGR.
Which region offers the fastest growth opportunities?
Asia-Pacific is set to record a 5.03% CAGR as 5G adoption, mobile gaming, and localized content expand the addressable base.
Why are hybrid ad-supported subscription tiers gaining traction?
Hybrid tiers combine lower entry prices with advertising, balancing revenue diversification and reducing churn, especially in mature markets.
What technologies are shaping future competition?
AI-driven dubbing, virtual production studios, and dynamic ad insertion are lowering production costs and raising engagement, helping new entrants challenge incumbents.
Page last updated on:


