
Mechanical Seals Market Size and Share
Market Overview
| Study Period | 2021 - 2031 |
|---|---|
| Market Size (2026) | USD 7.97 Billion |
| Market Size (2031) | USD 9.97 Billion |
| Growth Rate (2026 - 2031) | 4.58 % |
| Fastest Growing Market | Asia Pacific |
| Largest Market | Asia Pacific |
| Market Concentration | Medium |
Major Players *Disclaimer: Major Players sorted in no particular order Image © Mordor Intelligence. Reuse requires attribution under CC BY 4.0. | |
Mechanical Seals Market Analysis by Mordor Intelligence
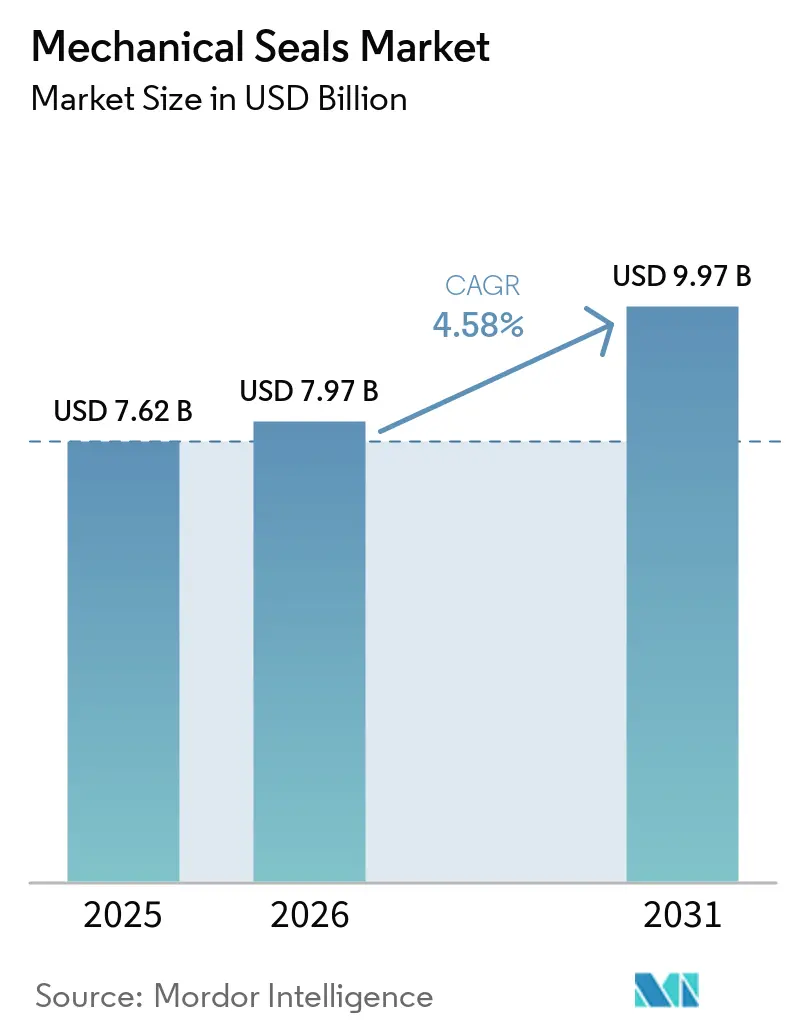
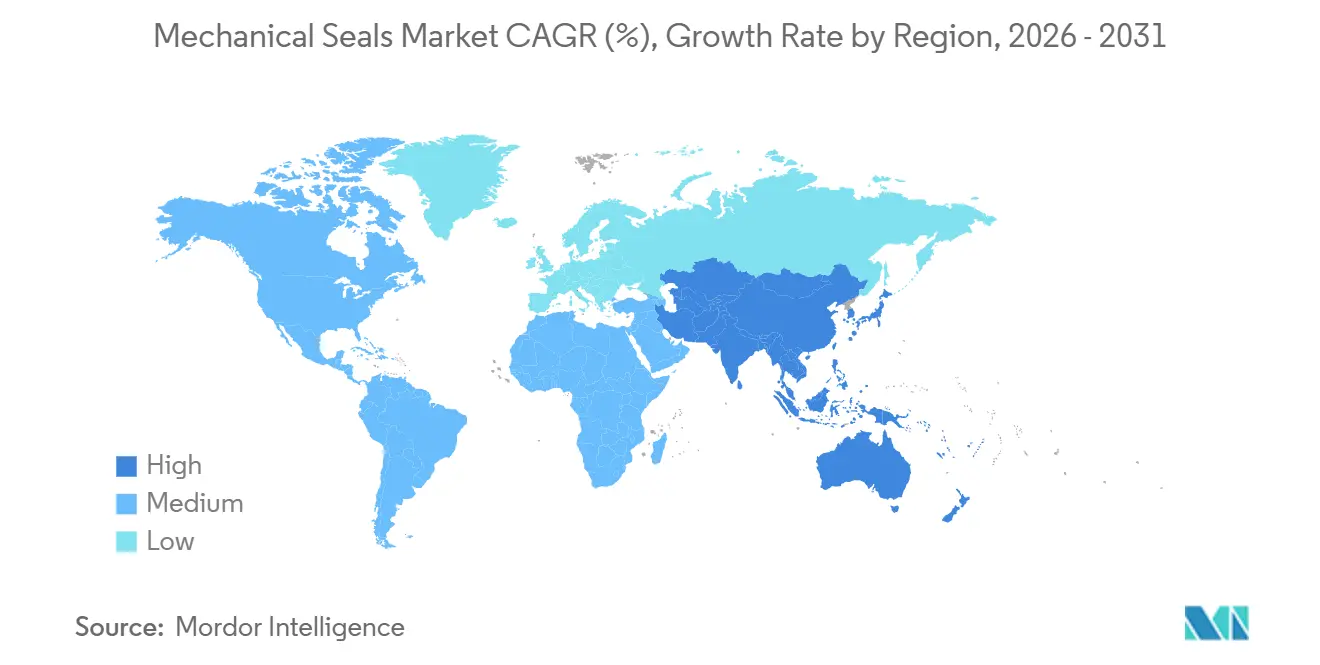
The Mechanical Seals Market size is expected to grow from USD 7.62 billion in 2025 to USD 7.97 billion in 2026 and is forecast to reach USD 9.97 billion by 2031 at a 4.58% CAGR over 2026-2031. Demand remains anchored in pumps and compressors, yet the mechanical seals market is splitting into high-volume commodity products that face price pressure from seal-less alternatives and premium engineered solutions that capture double-digit margins in hydrogen, super-critical carbon dioxide, and cryogenic services. Pump seals represented 64.35% of 2025 revenue, a share underwritten by the vast centrifugal pump installed base. Power-generation users form the fastest-growing customer group at a projected 4.88% CAGR because utilities are retrofitting turbines and commissioning hybrid plants that require advanced dry-gas seals. Asia-Pacific commanded 36.35% of the mechanical seals market share in 2025 and is set to grow at a 4.68% CAGR as China and India expand refining, petrochemical, and power assets.
Key Report Takeaways
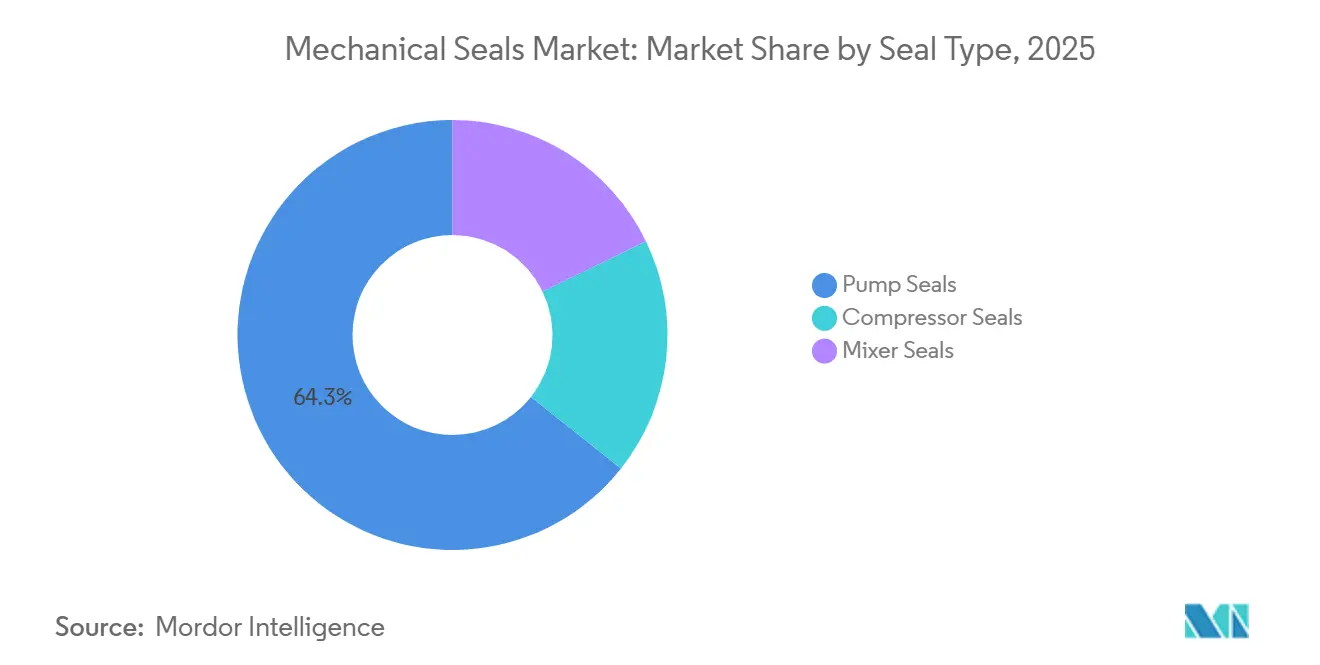
- By seal type, pump seals commanded 64.35% of the mechanical seals market share in 2025, and are advancing at 4.56% through 2031.
- By design, cartridge seals held 43.61% of the mechanical seals market size in 2025, and Component/Pusher is advancing at 4.62% through 2031.
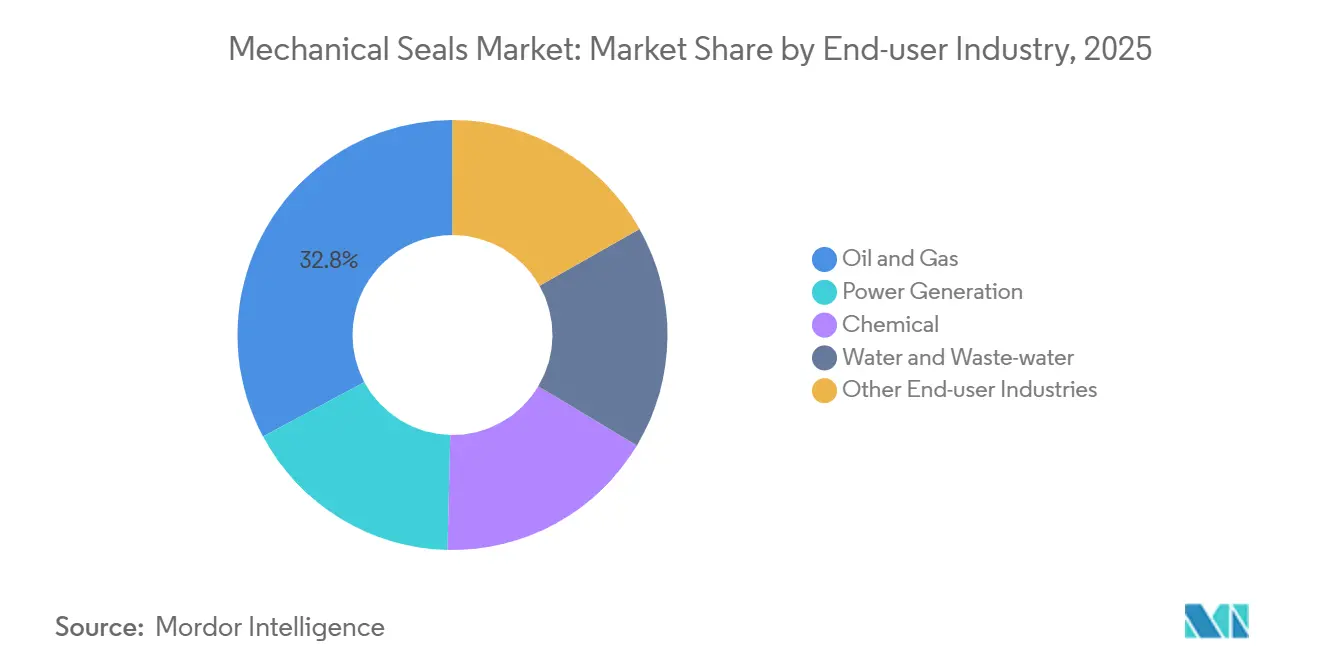
- By end-user, oil and gas accounted for 32.83% of the mechanical seals market size in 2025, while power generation is advancing at a 4.88% CAGR through 2031.
- By geography, Asia-Pacific generated 36.35% of the mechanical seals market revenue in 2025, expanding at a 4.68% CAGR to 2031.
Note: Market size and forecast figures in this report are generated using Mordor Intelligence’s proprietary estimation framework, updated with the latest available data and insights as of 2026.
Market Trends and Insights
Drivers Impact Analysis of Mechanical Seals Market*
| Drivers | (~) % Impact on CAGR Forecast | Geographic Relevance | Impact Timeline |
|---|---|---|---|
| Growing demand from oil and gas megaprojects | +1.2% | Middle East, Asia-Pacific (China, India), North America (US Gulf Coast LNG) | Medium term (2-4 years) |
| Surge in new power-generation capacity additions | +1.0% | Global, with concentration in Asia-Pacific (China, India) and Middle East | Medium term (2-4 years) |
| Tightening fugitive-emission regulations worldwide | +0.9% | North America, Europe; spillover to Asia-Pacific and Middle East by 2028-2030 | Long term (≥ 4 years) |
| Capacity expansion in chemical and petrochemical complexes | +0.8% | Middle East (Saudi Arabia, UAE), Asia-Pacific (China, India, South Korea) | Medium term (2-4 years) |
| Hydrogen and green-ammonia cryogenic infrastructure build-out | +0.6% | Europe, North America, Australia; early-stage in Middle East and Asia-Pacific | Long term (≥ 4 years) |
| Source: Mordor Intelligence | |||
Growing Demand from Oil and Gas Megaprojects
Saudi Arabia's push into downstream operations highlights a shift in seal requirements driven by crude-to-chemicals integration. Aramco's Amiral complex, set to commence operations in 2027, will demand premium high pressure seals for its mixed-feed crackers and high-pressure hydrocarbon pumps. Suppliers are now tasked with providing materials resilient to extreme temperatures and corrosive petrochemical streams. John Crane's Type 8628VL non-contacting spiral-groove seal boasts an extended mean time between repairs while significantly reducing flush demand. Such large-scale projects lean towards upfront investments in advanced technology, promising lifecycle savings, and putting pressure on vendors still dependent on traditional wet-seal lines.
Surge in New Power-Generation Capacity Additions
Worldwide installations of gas turbines, nuclear reactors, and hybrid renewables are on the rise. Yet, the primary demand for seals is concentrated in auxiliary feed-water pumps, cooling circuits, and steam turbines. A retrofit of AESSEAL’s STS steam turbine seal at a refinery in the UK resulted in significant steam savings annually per unit. This upgrade extended the turbine's lifespan, translating to impressive annual fleet savings. As grids increasingly incorporate intermittent renewables, combined-cycle turbines are set to cycle more frequently. This heightened activity accelerates seal wear, leading to a surge in aftermarket volumes. On the horizon, while modular nuclear concepts and closed-loop cooling might reduce the number of dynamic sealing points, tempering growth in the very long term, the immediate future looks robust.
Tightening Fugitive-Emission Regulations Worldwide
In December 2023, the U.S. EPA imposed methane leakage limits for wet-seal compressors and dry-seal ones[1]. To comply, operators must upgrade their seals and implement new monitoring protocols. Entering the fray in June 2025, John Crane unveiled its Type 93AX coaxial separation seal. This innovative seal slashes nitrogen usage and maintains integrity, making it a prime choice for operators grappling with leakage and resilience challenges. While Europe aligns with U.S. standards, the Asia-Pacific region lags behind. This delay permits the continued use of cost-effective, high-leak designs until local regulations become more stringent.
Capacity Expansion in Chemical and Petrochemical Complexes
Saudi petrochemical revenue exceeded expectations in 2025, and announced projects will nearly double capacity within five years. Commodity crackers favor standardized cartridge seals, whereas specialty plants demand customized solutions for corrosive or high-purity streams. Suppliers with regional service hubs enjoy margin upside by offering rapid response and engineered variants, whereas centralized producers face freight penalties and longer lead times.
Restraints Impact Analysis of Mechanical Seals Market*
| Restraints | (~) % Impact on CAGR Forecast | Geographic Relevance | Impact Timeline |
|---|---|---|---|
| High life-cycle cost in abrasive slurry services | -0.5% | Global, with concentration in mining (Australia, Latin America, Africa) and pulp and paper (North America, Scandinavia) | Short term (≤ 2 years) |
| Seal-less mag-drive and canned-motor pumps eroding addressable market | -0.7% | North America, Europe; expanding to Asia-Pacific chemical and pharmaceutical sectors | Medium term (2-4 years) |
| SiC face-material price volatility and supply-chain risk | -0.4% | Global, with acute impact on high-performance seal manufacturers sourcing from limited SiC wafer suppliers | Short term (≤ 2 years) |
| Source: Mordor Intelligence | |||
High Life-Cycle Cost in Abrasive Slurry Services
Mining and pulp operators frequently opt for packed glands or expeller devices, shunning the premium on slurry seals. Their choice underscores a preference for inventory simplicity over longevity. Meanwhile, John Crane's SB2 dual-cartridge technology, which eliminates the need for an external flush and extends service life, sees its field adoption largely dependent on bundled technical support and performance guarantees. These assurances aim to counterbalance the initial investment. Vendors who solely push products without added services find themselves sidelined in abrasive tasks.
Seal-Less Mag-Drive and Canned-Motor Pumps Eroding Addressable Market
Mag-drive units, priced at a premium over single-seal pumps, sidestep the need for dual-seal support systems and mitigate leak risks[2]. This advantage has helped them capture a significant share in services like LPG, alkylate, and acid reruns. While these units can face failures due to sludge blockages or magnet demagnetization, such challenges simultaneously create opportunities for premium mechanical seals. These seals are particularly sought after in applications prone to high temperatures, solid blockages, or dry runs.
*Our forecasts treat driver/restraint impacts as directional, not additive. The impact forecasts reflect baseline growth, mix effects, and variable interactions.
Mechanical Seals Market Segment Analysis
By Seal Type:
Pump Seals Maintain Dominance while Dry-Gas Variants Gain TractionPump seals generated 64.35% revenue in 2025 and will track a 4.56% CAGR to 2031. Retrofits into existing centrifugal pumps underpin stable aftermarket sales, but the installed base is vulnerable to seal-less migration in clean chemical services. Non-contacting spiral-groove designs and upstream-pumping faces now headline innovation, allowing suppliers to frame upgrades around energy savings and emissions compliance. Compressor seals, though lower in volume, achieve higher average selling prices via technical complexity and rising regulatory enforcement. Mixer seals remain niche yet mission-critical in hygiene-sensitive reactors, sustaining premium margins.
While the mechanical seals market size for pump applications will expand steadily, competitive intensity is sharpening as Asian manufacturers offer low-cost contact-face cartridges. Established brands differentiate through digital diagnostics, performance warranties, and rapid local service.

By Design Type:
Cartridge Convenience vs. Field-Service FlexibilityCartridge designs held 43.61% revenue share in 2025, valued for alignment accuracy and quick change-outs during turnarounds. However, component seals are on pace for a 4.62% CAGR because remote mines and pulp mills favor rebuildable assemblies that cut downtime and inventory. Split seals, though small in number, command hefty premiums when equipment teardown is impractical, such as large pipeline pumps.
As digitalization reshapes the landscape, sensor-equipped cartridges are now streaming data to cloud platforms. Vendors who overlook the importance of data services may find themselves trapped in a relentless price competition. However, there's a silver lining: independent sensor retrofits offer component-seal specialists a viable route to maintain their significance in the evolving market.
By End-User Industry:
Power Generation Surges as Oil-and-Gas Share SlidesOil and gas remained the largest buyer at 32.83% in 2025, but seal-less migration and upstream capex cuts trim its future slice. Power producers lead growth at 4.88% CAGR, spurred by turbine retrofits and auxiliary equipment in gas-fired, nuclear, and renewable plants. Chemical complexes are split between standardized cartridge seals for bulk ethylene and engineered variants for corrosive specialties. Water and wastewater utilities steadily convert packed glands to mechanical designs to conserve water, albeit at commoditized pricing. Mining enjoys episodic windfalls tied to battery-metal booms; suppliers with modular platforms adaptable across sectors buffer such cyclicality.
Geography Analysis
APAC Mechanical Seals Market
Asia-Pacific captured 36.35% of the mechanical seals market revenue in 2025 and is projected to post the fastest 4.68% CAGR through 2031. China's expansions in refining, petrochemicals, and power sectors drive a significant demand. Additionally, China's leadership in electrolyser manufacturing has spurred an early adoption of hydrogen-ready seals. Following closely, India is ramping up its refinery and water infrastructure projects. However, due to price sensitivities, the standard pump business is leaning towards domestic producers. Meanwhile, Japan and South Korea, despite their smaller size, are investing in high-performance seals for LNG and semiconductor applications, carving out premium-margin niches.
North America Mechanical Seals Market
North America commanded a notable market share in 2025. The EPA's methane regulations are driving retrofits of dry-gas seals throughout the Gulf Coast's midstream network. Capital orders are bolstered by LNG export terminals and petrochemical debottlenecks, while an aging installed base ensures stability in the aftermarket. In Canada, duties on oil sands are pushing the demand for abrasion-resistant dual seals, yet delays in pipeline projects introduce volatility in capital expenditures.
EMEA Mechanical Seals Market
Europe represented a considerable portion of the market value. Projects focused on energy transition—like carbon capture, hydrogen electrolysers, and offshore wind—are fostering growth, though progress is often slowed by permitting delays. Germany and the UK are taking the lead in hydrogen pipelines, yet the bulk of revenues from 2026 to 2028 are anticipated to stem from upgrades in industrial gas and specialty chemicals. While the Middle East and Africa hold a smaller market share, they are involved in some of the industry's largest projects. Notable undertakings include Saudi Arabia's push from crude to chemicals, ADNOC's venture in carbon capture and storage, and South Africa's mining sector—all of which demand hundreds of seals per project. However, suppliers face challenges with longer logistics routes and extended receivables.
Regulatory Landscape
Mechanical seal selection and qualification are shaped by performance standards and tightening chemical compliance requirements. ISO 21049:2004 (API 682 equivalent for pumps) remains a key reference for refinery and petrochemical pump sealing systems, and it entered systematic review as of April 15, 2026, keeping attention on standardized seal arrangements and support plans for projects and turnarounds.
On the materials side, EU REACH actions are increasingly influential for fluoropolymer and elastomer inputs used in secondary sealing (such as FKM/FFKM and PTFE-based components). In May 2026, the European Chemicals Agency (ECHA) advanced the Universal PFAS Restriction proposal to a final review stage, including transition frameworks (including stated derogation structures for industrial fluid sealing), and in July 2026 ECHA published a REACH Annex XVII proposal (ECHA/RAC/2026/18) to limit residual hexafluoropropylene (HFP) in FFKM sealing products to 0.5 ppm, with enforcement referenced for Q3 2027. These steps increase traceability and qualification demands across the seal bill of materials, especially for high-performance applications where fluoropolymers are difficult to substitute.
Value Chain Analysis
The mechanical seals value chain starts with upstream feedstocks and materials processing for face materials and metallic hardware, then moves into precision manufacturing, assembly, and aftermarket service. Key inputs include carbon graphite blends, silicon carbide and tungsten carbide, and corrosion-resistant alloys (for example Hastelloy and CrNiMo steels). These are machined via CNC, then ground and lapped to tight face-flatness requirements before assembly with secondary seals (O-rings/gaskets) and loading elements (springs or bellows). Material availability and qualification, especially for SiC faces and fluoropolymer-based components, is a recurring bottleneck for engineered seals used in LNG, hydrogen, and emissions-critical compressor services.
Downstream, OEMs and authorized service networks handle application engineering, installation, commissioning, and reliability programs that account for a large share of lifecycle value, particularly in pumps and compressors. Distributors and service centers support regional inventory, vendor-managed inventory (VMI), and rapid turnaround repair. Industry bodies such as the Fluid Sealing Association (FSA) and European Sealing Association (ESA) provide standards education and coordination on compliance topics, including PFAS discussions under ECHA REACH. Traceability and compliance data management is also becoming embedded in procurement and fulfillment workflows, as reflected by AESSEAL communications in February 2025 describing ERP-integrated country-of-origin tracking and supplier communication practices to manage disruption and compliance risk.
Competitive Landscape
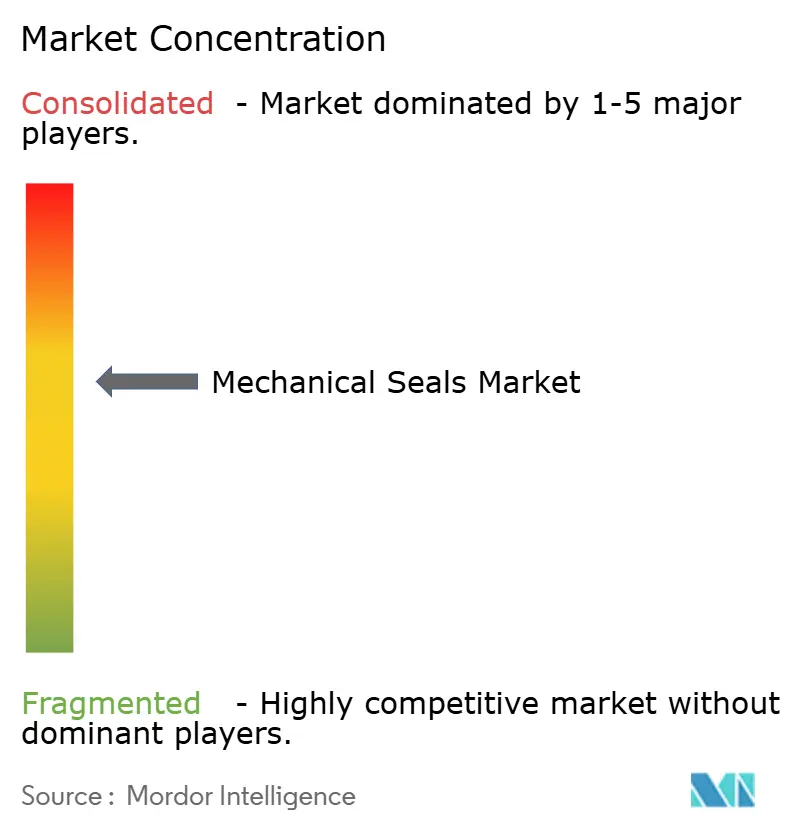
The mechanical seals market is moderately consolidated. Technology leadership is the key moat. John Crane’s Performance Plus service suite, launched in November 2025, bundles remote monitoring, analytics, and guaranteed reliability contracts, positioning the firm as a performance partner rather than a component vendor. Vendors doubling down on hydrogen-compatible materials, non-contacting faces, and digital diagnostics command pricing power, whereas producers anchored in wet-seal portfolios face margin compression as customers opt for dry seals or eliminate seals.
Mechanical Seals Industry Leaders
-
John Crane
-
EagleBurgmann
-
Flowserve Corporation
-
AESSEAL
-
A.W. Chesterton Company
- *Disclaimer: Major Players sorted in no particular order
Mechanical Seals Market Companies Covered in this Report
- A.W. Chesterton Company
- AESSEAL
- Dana Limited
- Eagle Industry Co., Ltd.
- EagleBurgmann
- Flexaseal Engineered Seals and Systems, LLC
- Flowserve Corporation
- Gallagher Seals
- Garlock
- Hutchinson Industries Inc.
- John Crane
- Parker Hannifin Corp
- SKF
- Technetics Group
Market Opportunities and Future Outlook
Engineered seals and service bundles that reduce utilities consumption are creating a focused white-space in pumps and compressors, particularly where operators are building emissions-control programs. In March 2026, John Crane reported deployment of its Type SB2 USP dual-cartridge seals at a Louisiana LNG export facility, achieving a 99.8% reduction in water consumption versus conventional API Plan 32 demineralized water flush systems. The reported result points to opportunities for water-saving and low-consumption support-plan conversions across large installed bases in LNG and related process industries.
Compliance-driven upgrades are another recurring pull through, as operators seek tighter leakage control and better monitoring alongside ongoing tightening of fugitive-emissions rules, including the U.S. EPA methane rule finalized in December 2023, and related Europe-focused chemical compliance activity under REACH. Vendors that can qualify alternative materials and provide documentation for evolving PFAS-related requirements, while maintaining performance in extreme services (cryogenic, hydrogen compression, and corrosive chemical duties), gain leverage in specification-led purchases. Condition monitoring and reliability contracting also extend the aftermarket beyond seal replacements by shifting maintenance toward telemetry-enabled interventions, supporting higher-value offerings in power generation retrofits and midstream compressor networks.
Recent Industry Developments in Mechanical Seals Market
- March 2026: John Crane supplied Type SB2 USP dual-cartridge seals to an LNG export facility in Louisiana and reported a 99.8% reduction in water consumption compared with conventional API Plan 32 demineralized water flush systems. The deployment highlights how engineered seal and support-plan retrofits can deliver measurable utility savings in high-throughput process assets. It also strengthens the commercial case for premium seals in LNG and adjacent hydrocarbon services where operators prioritize sustainability metrics and operating cost reductions.
- May 2025: EagleBurgmann inaugurated an expanded facility in Doha, Qatar, in partnership with Jaidah Group to localize mechanical sealing technology and service support. The move shortens lead times and improves turnaround responsiveness for regional oil and gas, power, and process customers. Localization also positions the company for specification-driven projects that favor in-country capability and faster aftermarket coverage.
- July 2024: Flowserve acquired cryogenic LNG submerged pump technology and related intellectual property from NexGen Cryogenic Solutions, Inc. The transaction broadened Flowserve's cryogenic capabilities that connect upstream pumping equipment with downstream sealing and reliability needs in LNG value chains. It reinforced the companys positioning in LNG infrastructure programs where cryogenic duty requirements pull through specialized seal materials, designs, and service support.
Mechanical Seals Market Report Scope and Research Methodology
Market Definition and Coverage
This market covers revenue earned from mechanical seals used to prevent leakage in rotating equipment, mainly in pumps, compressors, and mixers, across industrial and utility end users, and counted at the point of sale for new equipment and replacement demand.
Scope exclusions: It does not include non-mechanical sealing options such as packing, gaskets, O-rings, sealants, or seal-less pump technologies.
Segments Covered in This Report
- By Seal Type
- Pump Seals
- Compressor Seals
- Mixer Seals
- By Design Type
- Component/Pusher
- Cartridge
- Split
- By End-user Industry
- Oil and Gas
- Power Generation
- Chemical
- Water and Waste-water
- Other End-user Industries (Mining and Mineral Processing, Food, Pharma, etc.)
- By Geography
- Asia-Pacific
- China
- India
- Japan
- South Korea
- ASEAN
- Rest of Asia-Pacific
- North America
- United States
- Canada
- Mexico
- Europe
- Germany
- United Kingdom
- France
- Italy
- Russia
- Rest of Europe
- South America
- Brazil
- Argentina
- Rest of South America
- Middle-East and Africa
- Saudi Arabia
- South Africa
- Rest of Middle-East and Africa
- Asia-Pacific
Data Sources, Market Sizing, and Validation
Desk Research
Desk work starts by mapping where mechanical seals are most used, which is largely tied to the installed base of pumps and compressors, and to operating conditions in process plants. We refer to public sources such as the US Energy Information Administration for refinery and energy throughput indicators, the US Geological Survey for mining and minerals activity signals, and UN Comtrade for trade flows of relevant equipment and components.
To keep inputs grounded, we also review OSHA and EPA releases that influence leakage control and maintenance practices, and we use peer-reviewed engineering literature to understand typical seal lifetimes, failure modes, and how upgrades are handled in harsh services. Company annual reports, investor presentations, and reputable press are used to confirm demand drivers and regional exposure. Paid subscriptions for company financials and patent databases help cross-check product focus and technology shifts. These examples are not exhaustive, and many other sources were also used for data collection, validation, and clarification during the study.
Primary Interviews and Surveys
Primary discussions were used to validate how demand splits between OEM and aftermarket purchases, how seal selection changes by duty condition, and how pricing moves with materials and service requirements. We spoke with participants across seal manufacturing, distributors, rotating equipment OEMs, and maintenance teams, then reconciled differences by region so the final assumptions align with real ordering behavior in major industrial hubs.
Distribution of primary research fieldwork respondents
| Company type | Respondent position | Region |
|---|---|---|
| Top tier: 38% | CXOs: 17% | APAC: 45% |
| Mid tier: 43% | Functional/Unit leaders: 37% | EMEA: 31% |
| Smaller Players: 19% | Managers: 46% | Americas: 24% |
Market-Sizing & Forecasting
Sizing follows a top-down and bottom-up workflow, where end-use demand pools are reconstructed from industrial activity and rotating equipment intensity, and then cross-checked with selective supplier roll ups. We start from indicators that explain seal consumption, and only after the totals look reasonable do we allocate value across applications and regions.
Key model inputs include the installed base and replacement cycle patterns for pumps and compressors, the share of severe service duties that require higher value seal designs, and maintenance spending direction in oil and gas, power generation, chemical processing, and water and wastewater. Price realization is handled through a mix of sampled ASP ranges from interviews and published material cost trends, and gaps are handled by using proxy duty classes and conservative substitution assumptions where direct data is thin.
For forecasting, scenario analysis is used so we can reflect different paths for industrial capex, turnaround intensity, and energy and chemical throughput. Scenario weights are adjusted based on what interviewees expect for lead times, planned projects, and retrofit activity. The final forecast is then checked for realism against the implied volumes and pricing progression.
Data Validation & Update Cycle
Outputs are validated through triangulation across independent signals, including whether regional totals align with equipment additions, maintenance cycles, and trade patterns that should move in the same direction. Outliers are flagged, assumptions are revisited, and a second analyst review is completed before results are signed off.
We refresh the report annually, and interim updates are triggered when there are material changes such as sharp shifts in energy or industrial output, major policy moves on emissions and leakage control, or visible pricing shocks in key inputs. Before delivery, a final pass ensures the latest public releases and interview learnings are reflected in the numbers and commentary.
Mordor Intelligence's Mechanical Seals Market Size Versus Other Published Estimates
Published market numbers for mechanical seals can look far apart because authors do not always count the same applications, time their currency conversions the same way, or treat aftermarket value consistently. Differences also come from how much weight is put on real installed base replacement behavior versus broad industrial growth rates.
The benchmark table shows a higher total in the near term, and in Mordor Intelligence's model the scope counts pump, compressor, and mixer seals across end-user industries and geographies in USD revenue. Demand is anchored to replacement cycles and validated shares, such as pump seals being the largest use, rather than relying only on a narrower set of process industries.
Benchmark comparison
| Source | Market Size | Gaps in Research Methodology |
|---|---|---|
| Mordor Intelligence | USD 7.97 B (2026) | |
| Global Consultancy A | USD 3.90 B (2025) | Uses a tighter product boundary that appears closer to standardized cartridge and component seals sold into a limited set of industries, and it typically reports a base year that excludes a broader aftermarket value layer and some regional coverage. |
| Trade Journal B | USD 5.80 B (2025) | Often blends mechanical seals with adjacent sealing components or uses simplified growth assumptions tied to industrial output, and the pricing build can understate severe service mix where engineered seals raise average revenue per unit. |
Overall, the spread is mainly explained by what gets counted as mechanical seals revenue, how aftermarket replacement is treated, and whether pricing is built from duty-based mix or from a single average. By keeping the steps traceable to installed base, replacement timing, and application mix, the estimate stays easier to reproduce and to stress test for planning decisions.
Key Questions Answered in the Report
How fast is the mechanical seals market expected to grow through 2031?
The mechanical seals market is projected to expand at a 4.58% CAGR from 2026 to 2031, rising from USD 7.97 billion in 2026 to USD 9.97 billion by 2031.
Which region leads demand for mechanical seals?
Asia-Pacific held 36.35% of global revenue in 2025 and will remain the largest, expanding at a forecast 4.68% CAGR thanks to large investments in refining, petrochemicals, and power.
What end-user segment offers the fastest growth outlook?
Power generation is forecast to post the highest 4.88% CAGR as utilities retrofit turbines and build new hybrid plants that rely on advanced dry-gas and steam-turbine seals.
How are seal-less pumps impacting mechanical seal suppliers?
Magnetic-drive and canned-motor pumps eliminate dynamic seals in many chemical and LPG services, trimming the addressable market and pushing seal vendors to focus on duties where high temperature, solids, or dry-run risk favor mechanical seals.
Why are silicon-carbide faces a supply concern?
Rising electric-vehicle and power-electronics demand extends SiC wafer lead times and inflates prices, forcing seal OEMs to secure long-term supply agreements or qualify alternate ceramics to protect margins.