
Market Overview
| Study Period | 2021 - 2031 |
|---|---|
| Market Size (2026) | USD 16.84 Billion |
| Market Size (2031) | USD 23.82 Billion |
| Growth Rate (2026 - 2031) | 7.18% CAGR |
| Fastest Growing Market | Asia Pacific |
| Largest Market | North America |
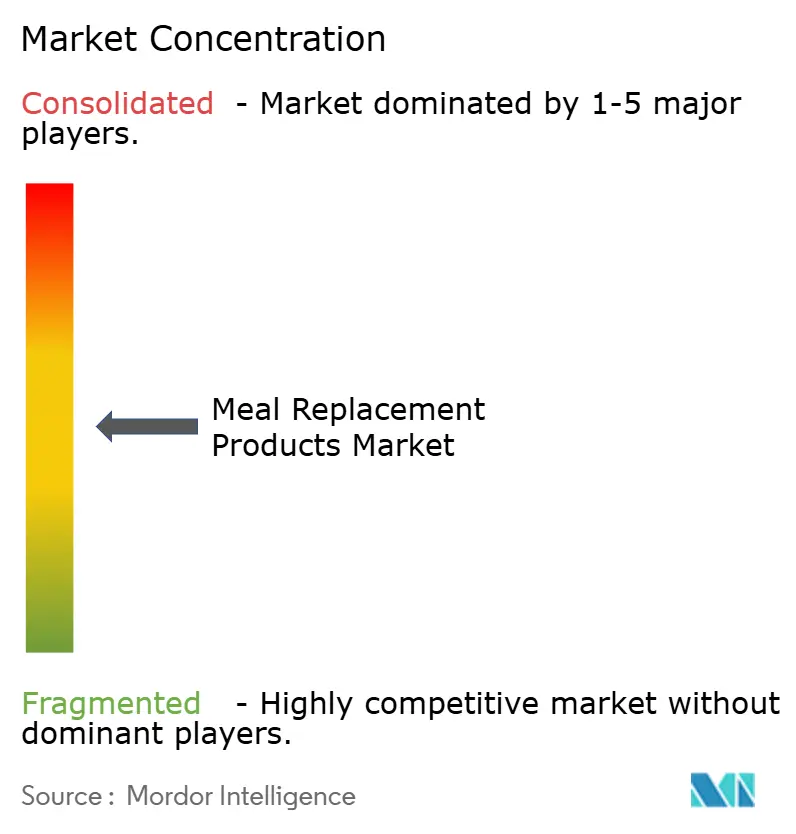
| Market Concentration | Medium |
Major Players
*Disclaimer: Major Players sorted in no particular order Image © Mordor Intelligence. Reuse requires attribution under CC BY 4.0. |
|
Meal Replacement Products Market Analysis by Mordor Intelligence
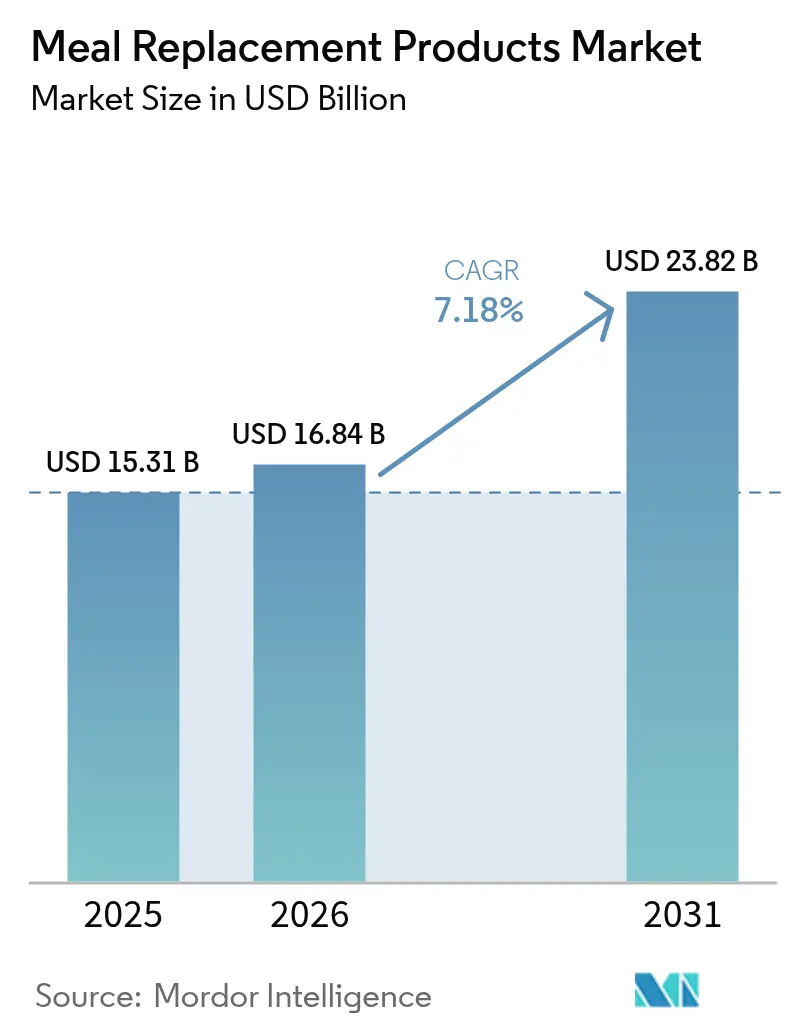
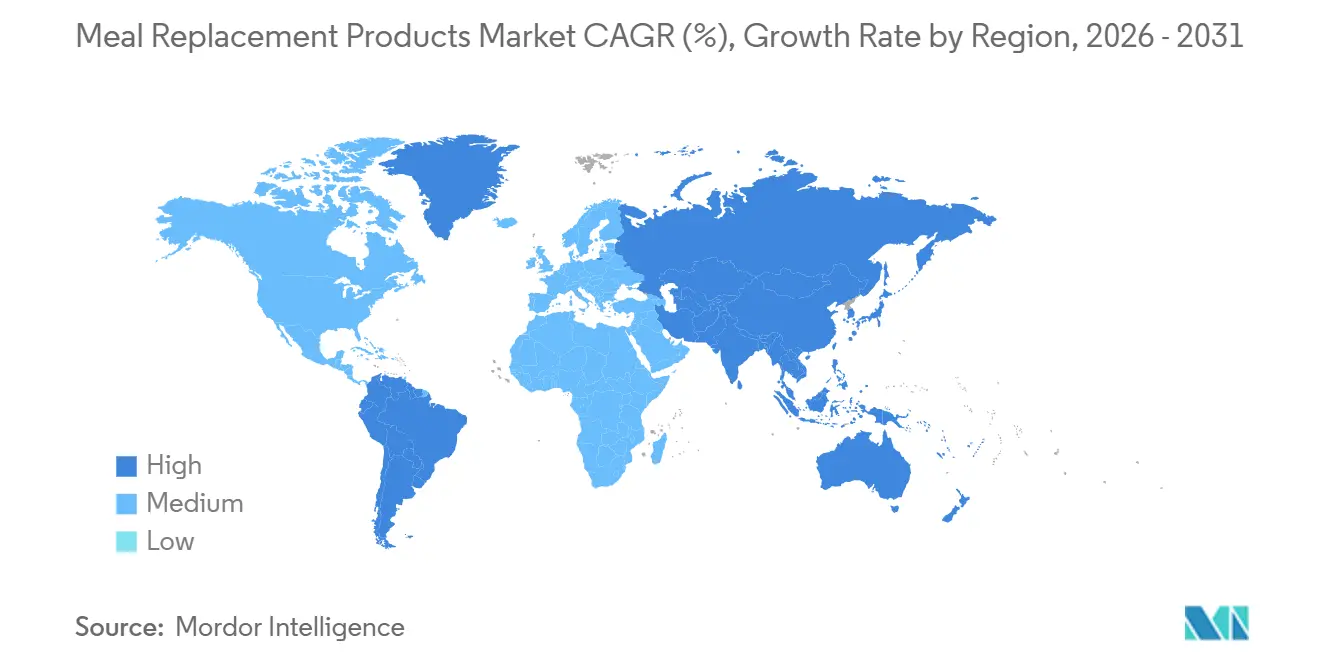
The Meal Replacement Products Market size is expected to increase from USD 15.31 billion in 2025 to USD 16.84 billion in 2026 and reach USD 23.82 billion by 2031, growing at a CAGR of 7.18% over 2026-2031. Regulatory clarity provided by the FDA and EFSA, which categorizes fortified products as Foods for Special Medical Purposes, has validated health-related claims associated with these products. This regulatory support has encouraged substantial investments in the development of innovative and novel formulas. North America contributed 41.17% of the revenue in 2025, making it a key market. However, the Asia-Pacific region is emerging as a high-growth area due to increasing disposable incomes in countries like China and India, combined with the rapid adoption of e-commerce platforms. These factors are driving a shift in market dynamics toward this region. Product innovation within the market is being spearheaded by ready-to-drink (RTD) formats. These formats leverage aseptic technology, which provides consumers with the convenience of zero preparation and ensures a shelf life of up to one year under ambient conditions. Additionally, online retail subscriptions are experiencing robust growth. This growth rate surpasses that of traditional supermarket channels. As a result, e-commerce platforms, particularly Amazon, have seen a significant boost in supplement sales, which have exceeded USD 20 billion on a trailing-twelve-month basis.
Key Report Takeaways
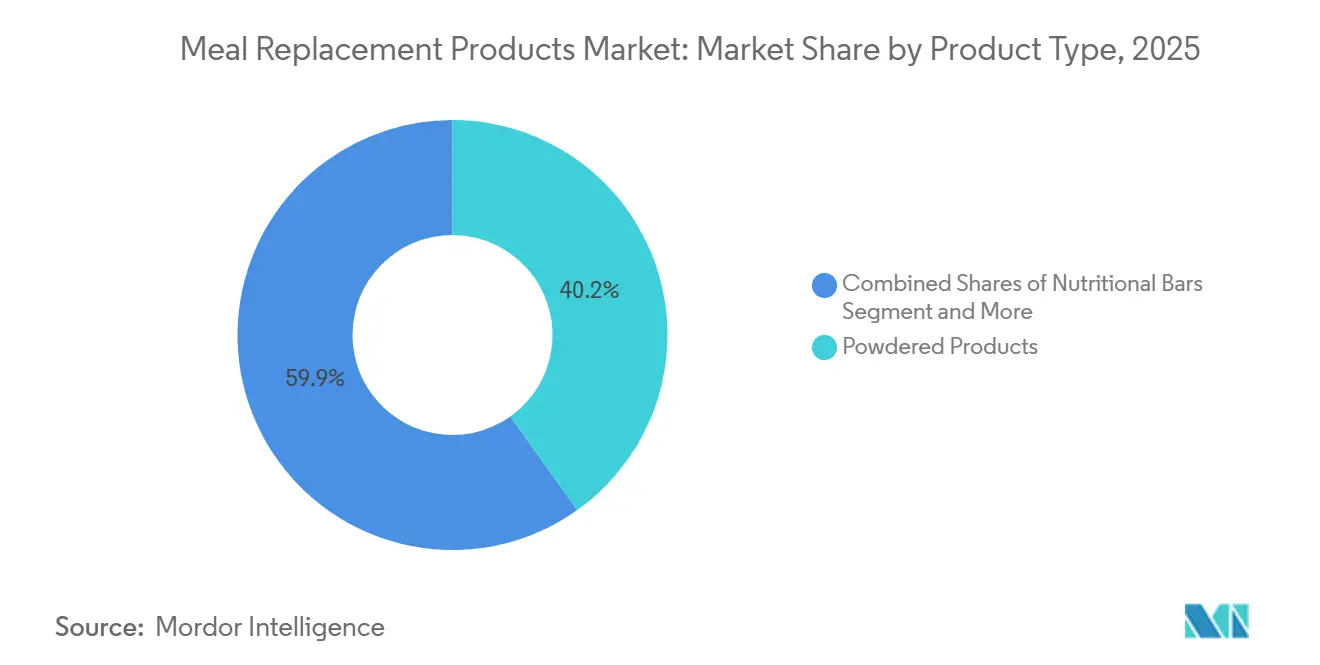
- By product type, powdered items commanded 40.15% of the meal replacement products market share in 2025, while RTD shakes are projected to expand at an 8.25% CAGR to 2031.
- By packaging format, bottles and jars held 70.98% share of the meal replacement products market size in 2025, whereas cartons and Tetra Paks are advancing at an 8.97% CAGR through 2031.
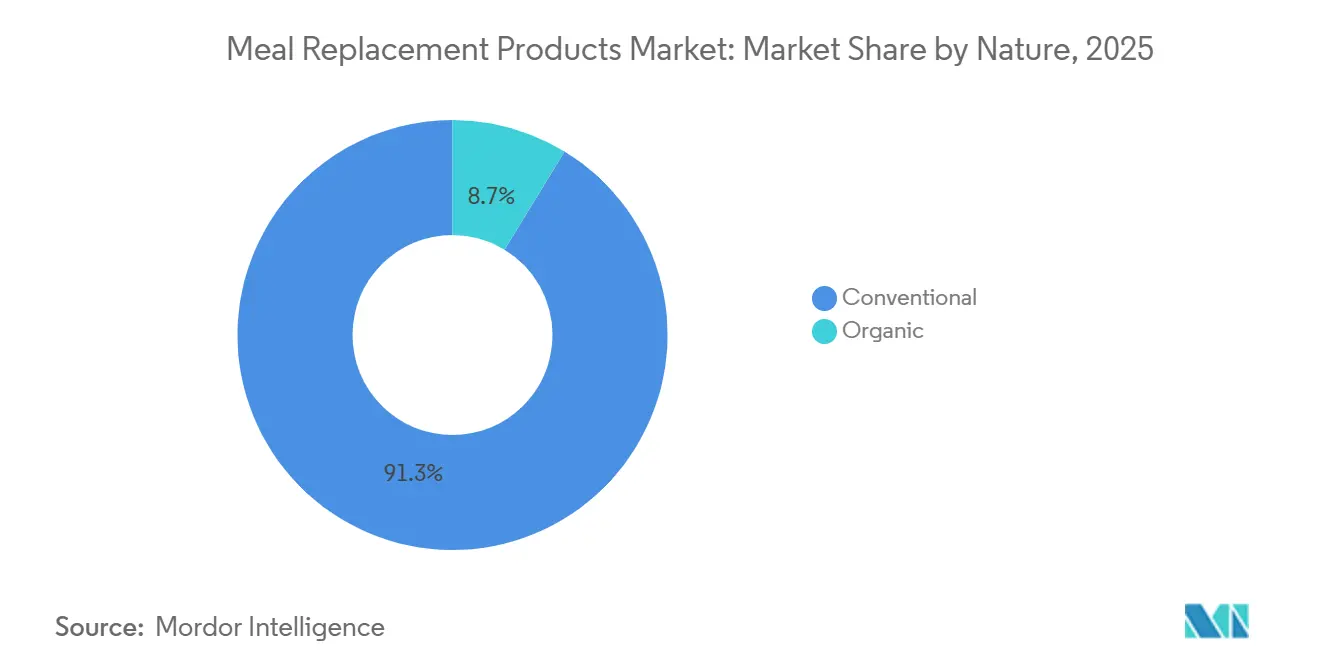
- By nature, conventional formulations dominated with 91.28% share in 2025, but organic products are forecast to rise at an 8.48% CAGR to 2031.
- By distribution channel, supermarkets and hypermarkets led with 53.72% of the 2025 revenue pool, while online retailers are growing at an 8.69% CAGR through 2031.
- By geography, North America captured 41.17% of 2025 sales, yet Asia-Pacific is the fastest region with an 8.74% CAGR projected for 2026-2031.
Note: Market size and forecast figures in this report are generated using Mordor Intelligence’s proprietary estimation framework, updated with the latest available data and insights as of 2026.
Global Meal Replacement Products Market Trends and Insights
Drivers Impact Analysis*
| Driver | (~) % Impact on CAGR Forecast | Geographic Relevance | Impact Timeline |
|---|---|---|---|
| Demand for personalized nutrition tailored to age, gender, and health needs | +1.2% | Global, with early adoption in North America and Western Europe | Medium term (2-4 years) |
| Busy lifestyles fuel demand for convenient and nutritious meal options | +1.5% | Global, particularly urban centers in Asia-Pacific and North America | Short term (≤ 2 years) |
| Rising health and fitness consciousness boosts demand for protein-enriched meal replacements | +1.8% | North America, Europe, Asia-Pacific core markets | Short term (≤ 2 years) |
| Workplace wellness programs encourage use of meal replacements as healthy on-the-go solutions | +0.9% | North America, Western Europe, with spillover to APAC corporate hubs | Medium term (2-4 years) |
| Greater awareness of portion control and calorie management encourages meal replacement adoption | +1.0% | Global, led by weight-management-focused regions in North America and Europe | Short term (≤ 2 years) |
| Advances in food technology improve taste, texture, shelf life, and nutrient profiles | +1.3% | Global, with R and D concentrated in North America and Europe | Long term (≥ 4 years) |
| Source: Mordor Intelligence | |||


Demand for personalized nutrition tailored to age, gender, and health needs
Artificial intelligence and microbiome sequencing are transforming meal replacement formulations from a standardized approach to personalized macronutrient profiles. Platforms like ZOE utilize continuous glucose monitor data and gut bacteria analysis to recommend protein-to-carbohydrate ratios that help stabilize post-meal blood sugar levels. The FDA's 2024 guidance on personalized nutrition requires manufacturers to demonstrate clinical outcomes instead of relying on surrogate biomarkers. This raises the evidentiary standards while also supporting premium pricing for AI-driven products. Gender-specific formulations are gaining traction, with Abbott's Protality focusing on women over 50. This group, which constitutes 60% of GLP-1 prescription holders, has increased needs for calcium and vitamin D to mitigate osteoporosis risks during weight loss. However, regulatory frameworks remain inconsistent. EFSA permits structure-function claims for personalized diets under Regulation 1924/2006, while the FDA requires randomized controlled trials for such claims, creating compliance challenges for multinational brands.
Busy lifestyles fuel demand for convenient and nutritious meal options
Ready-to-drink meal replacements, including Nestlé's Vital Pursuit frozen meals and Premier Protein's shelf-stable shakes, are experiencing significant growth, with a robust 8.25% CAGR. These products simplify consumption by eliminating the need for mixing, measuring, and cleanup, requiring only refrigeration or ambient storage. Tetra Pak's advanced aseptic processing technology extends the shelf life of heat-sensitive vitamins for up to 12 months without refrigeration. This innovation ensures nutrient preservation while catering to the convenience needs of commuters and shift workers through single-serve portability. In Asia-Pacific megacities such as Shanghai, Mumbai, and Jakarta, urban density drives higher adoption of meal replacements. Short 30-minute lunch breaks and the prevalence of micro-apartments with limited kitchen facilities make grab-and-go formats increasingly popular. Workplace cafeterias are also integrating Smart Fridges stocked with CookUnity's high-protein meals, enabling employees to use corporate wellness cards for subsidized nutrition. This model has already been adopted by over 500 U.S. employers in 2025. Additionally, the growing number of dual-income households supports market expansion, as families have less time to prepare meals. According to the Bureau of Labor Statistics, in 2024, 49.6% of married-couple families in the United States had both spouses employed[1]Source: Bureau of Labor Statistics, "Employment Characteristics of Families - 2024", bls.gov.
Rising health and fitness consciousness boosts demand for protein-enriched meal replacements
As per the 2025 Health and Fitness Association Global Report, global gym memberships are increasing. Memberships grew by 6% year-over-year, revenue rose by an average of 8%, and the number of fitness facilities expanded by nearly 4%[2]Source: " Health and Fitness Association, "2025 Global Fitness Industry Report", healthandfitness.org. Glanbia's Optimum Nutrition brand, which recorded a 14.3% revenue growth in Q3 2025, attributes half of its incremental volume to fitness enthusiasts. These individuals now aim to consume between 1.6 and 2.2 grams of protein per kilogram of body weight to enhance muscle protein synthesis. Companies like Solar Foods are advancing precision fermentation proteins. These proteins provide complete amino acid profiles while reducing greenhouse gas emissions by 90% compared to whey. This sustainable solution appeals to athletes who prioritize environmental consciousness and avoid animal-derived ingredients. The FDA's updated Nutrition Facts label now requires the disclosure of added sugars, prompting many brands to reformulate their products using stevia and monk fruit sweeteners. These alternatives maintain flavor without causing insulin spikes, a critical factor for the 11.1% of adults (ages 20-79) living with diabetes, as reported by the latest International Diabetes Federation (IDF) Diabetes Atlas (2025)[3]Source: International Diabetes Federation, "Diabetes Facts and Figures", idf.org. In 2024, India's FSSAI introduced draft regulations mandating that sports nutrition products carry disclaimers stating "Not for medicinal use." This initiative aims to reduce ambiguity and accelerate the formalization of the market.
Workplace wellness programs encourage use of meal replacements as healthy on-the-go solutions
Employer-sponsored Lifestyle Spending Accounts now cover reimbursements for meal delivery and weight management programs. The Milken Institute's 2024 blueprint for Food as Health projects that medically tailored meals could prevent 1.6 million hospitalizations annually and save USD 13.6 billion in healthcare costs. This has prompted self-insured employers to explore subsidizing meal replacements for managing chronic diseases. In January 2026, Applied Nutrition collaborated with Morrisons to launch 53 high-protein products, including GLP-1-friendly meals, aimed at securing corporate wellness contracts. Emory University's Healthy Kitchen teaching program reported a 22% reduction in ready-made meal consumption among participants. However, employers are increasingly adopting meal replacements as a practical interim solution for shift workers and remote employees who lack access to on-site cafeterias.
Restraints Impact Analysis*
| Restraint | (~) % Impact on CAGR Forecast | Geographic Relevance | Impact Timeline |
|---|---|---|---|
| High product prices compared to traditional meals deter budget-conscious consumers | -0.8% | Global, particularly acute in price-sensitive emerging markets | Short term (≤ 2 years) |
| Consumer skepticism toward artificial additives and preservatives limits product acceptance | -0.5% | North America, Western Europe, with growing awareness in Asia-Pacific | Medium term (2-4 years) |
| Presence of common allergens restricts market to allergen-free segments | -0.3% | Global, with stricter labeling enforcement in EU and North America | Medium term (2-4 years) |
| Inability to fully replicate satiety and experience of traditional meals limits repeat purchases | -0.6% | Global, particularly in food-culture-centric regions like Southern Europe and East Asia | Long term (≥ 4 years) |
| Source: Mordor Intelligence | |||
High product prices compared to traditional meals deter budget-conscious consumers
In May 2024, USDA Food Plans estimated the cost of a thrifty adult diet at USD 242 to USD 304 per month. In comparison, premium meal replacement subscriptions from brands like Huel or Ka'Chava exceed USD 400 monthly, representing a 30 to 65% cost premium. This price gap creates adoption challenges for households earning below the median income. Drought conditions in New Zealand and the EU have increased whey protein concentrate prices, pressuring manufacturers' margins. Glanbia, a major player, cited these raw material challenges during its H1 2025 earnings call. Private-label meal replacements at supermarkets are priced 20 to 40% lower than branded options but lack third-party certifications such as NSF Certified for Sport. This absence results in a quality-price trade-off, contributing to market fragmentation. In Southeast Asia and Sub-Saharan Africa, a 10% price increase leads to a volume decline of over 15% reflecting a price elasticity of demand greater than -1.5. This high price sensitivity restricts the geographic expansion of multinational brands in these regions.
Consumer skepticism toward artificial additives and preservatives limits product acceptance
Consumers are increasingly avoiding products containing carrageenan, xanthan gum, or artificial sweeteners, compelling brands to reformulate with more familiar ingredients despite the associated higher costs and reduced shelf life. The FDA's FASTER Act, implemented in January 2023, identified sesame as the ninth major allergen. This regulation has necessitated the reformulation of meal replacement bars that previously used sesame flour as a binder, with recipe development and labeling costs ranging from USD 50,000 to USD 200,000 per SKU. Although EU Regulation 1169/2011 mandates allergens to be displayed in bold typeface, consumer confusion remains prevalent. A 2024 EFSA study found that 42% of surveyed shoppers misinterpreted "may contain" cross-contamination warnings as an indication of intentional ingredient inclusion. Precision fermentation proteins, while free from animal allergens, face regulatory hurdles. The EFSA classifies these proteins as novel foods, requiring pre-market authorization under Regulation 2015/2283, which delays commercialization by 18 to 36 months.
*Our forecasts treat driver/restraint impacts as directional, not additive. The impact forecasts reflect baseline growth, mix effects, and variable interactions.
Segment Analysis
By Product Type: RTD Formats Capture Fastest Growth Despite Powder Dominance
In 2025, powdered items contributed to 40.15% of the total revenue, primarily due to their extended shelf life and lower protein costs per gram, making them a cost-effective option for consumers. Glanbia's 2-kilogram tubs, priced at approximately USD 1 for a 30-gram serving, present a significant price advantage compared to ready-to-drink (RTD) alternatives. According to Amazon, powdered products dominate the meal replacement products market, accounting for 55% of its market size. This dominance is largely attributed to the cost efficiencies associated with shipping powdered items. Although the flavor variety for powders is more limited compared to RTDs, bulk users continue to prioritize the value they offer, making them a preferred choice for this segment.
Conversely, RTD shakes are experiencing robust growth, with a compound annual growth rate (CAGR) of 8.25% projected through 2031. This growth is fueled by the convenience of single-serve portability and the ability to remain stable at ambient temperatures for up to a year. The use of Tetra Pak cartons has been instrumental in expanding distribution to regions where refrigeration infrastructure is limited, thereby increasing the addressable market for meal replacement products. Premier Protein, for instance, recorded an 18% increase in volume sales following its expanded availability in convenience stores. Additionally, consumer behavior trends indicate that single-serve bottles support portion control, which has been linked to improved adherence to weight-loss programs, further driving the demand for RTD shakes.


By Packaging Format: Bottles and Jars Dominate While Tetra Paks Gain Sustainability Edge
In 2025, rigid bottles and jars contributed to 70.98% of sales, maintaining their position as the most widely used packaging option for ready-to-drink (RTD) shakes. PET bottles, which can cost as little as USD 0.15, are highly durable and capable of withstanding the rigorous handling associated with e-commerce deliveries. Their transparent design allows consumers to visually assess product quality, fostering trust and encouraging repeat purchases.
Although cartons and Tetra Paks currently represent a smaller portion of the market, they are experiencing significant growth, with a compound annual growth rate (CAGR) of 8.97%. The use of PlantCaps, closures derived from sugarcane, not only reduces the carbon footprint of each package but also supports retailers in achieving their corporate sustainability objectives. Additionally, the rectangular shape of these packages optimizes pallet utilization by up to 25%, leading to lower freight emissions and reduced transportation costs. Major retailers, such as Nestlé, have already transitioned more than one-third of their North American stock-keeping units (SKUs) to cartons. As a result, the market share of cartons in the meal replacement products segment is expected to grow steadily throughout the forecast period.
By Nature: Conventional Products Retain Scale as Organic Accelerates on Clean-Label Demand
In 2025, conventional formulas, predominantly composed of sucralose and non-organic whey, accounted for a significant 91.28% of the revenue. This dominance is attributed to their ability to deliver protein at the lowest cost, making them highly competitive in institutional channels. Additionally, the use of synthetic vitamins, which are up to 85% cheaper than natural alternatives, has enabled manufacturers to offer fortified products at more affordable prices, further solidifying their market position.
Conversely, organic products are experiencing a notable compound annual growth rate (CAGR) of 8.48%. These products comply with USDA organic standards, which prohibit the use of GMO ingredients and synthetic preservatives, aligning with the increasing consumer demand for natural and clean-label products. Nestlé's acquisition of Orgain in 2025 exemplifies the growing interest of mainstream players in this premium segment. However, high input costs, such as organic pea protein exceeding USD 8,000 per metric ton, continue to limit broader market penetration. Despite these challenges, affluent and label-conscious consumers are willing to pay a premium of 20-35%, driving the meal replacement products market toward cleaner and more sustainable sourcing practices.
By Distribution Channel: Supermarkets Lead While Online Retailers Surge on Subscriptions
In 2025, supermarkets and hypermarkets accounted for 53.72% of total sales, effectively utilizing high store traffic and strategically placed impulse end-caps to boost purchases. For instance, Walmart employs a focused strategy by positioning RTD (Ready-to-Drink) shakes near yogurt aisles, targeting shoppers who are already inclined toward protein-rich products. This placement not only increases visibility but also encourages impulse buying among health-conscious consumers.
Although online retailers currently hold a smaller market share, they are experiencing robust growth with a compound annual growth rate (CAGR) of 8.69%, fueled by the increasing adoption of subscription-based models. Amazon's "Subscribe and Save" program, which offers discounts ranging from 5% to 15%, has significantly boosted the popularity of shakes, placing them among the top 10 most subscribed items on the platform. Additionally, brands like Huel are leveraging innovative strategies, such as interactive quizzes, to engage potential customers and achieve conversion rates of 12-18% among site visitors. This approach allows them to bypass the conventional 25-35% retailer margin, enhancing profitability. These evolving strategies are expected to continue reshaping the meal replacement products market, particularly in regions where the growth of traditional brick-and-mortar stores has stagnated.
Geography Analysis
In 2025, North America accounted for 41.17% of the market share. This slower growth is primarily due to market saturation in the U.S., where adults report consuming protein supplements monthly. Abbott's adult nutrition segment reported fiscal 2025 revenue of USD 4.48 billion, driven by 3.0% organic growth from its brands, Ensure and Protality. In January 2024, Abbott introduced Protality, targeting the 15 million Americans prescribed GLP-1 medications. This niche market is expected to grow to 25 million by 2028 as insurance coverage expands. In Canada, the meal replacement market benefits from Health Canada's Natural and Non-prescription Health Products Directorate, which allows structure-function claims for products adhering to Good Manufacturing Practices. This regulatory framework is less stringent compared to the FDA's substantiation requirements. In Mexico, rising obesity rates have led to government-mandated front-of-package warning labels on high-calorie products. This initiative, while aimed at reducing unhealthy consumption, has inadvertently increased the adoption of meal replacements as consumers shift to portion-controlled alternatives.
In South America, urbanization is influencing dietary trends. In Brazil, Argentina, and Chile, gym memberships grew by 12% annually from 2023 to 2025, reflecting increased protein supplement consumption among the growing middle class. Brazil's regulatory authority, ANVISA, governs meal replacements under RDC 243/2018, requiring a minimum protein content of 10 grams per serving and capping sugar at 10 grams. These regulations align with global standards, facilitating the entry of multinational brands. In Argentina, economic instability, marked by inflation exceeding 100% in 2024, has shifted consumer preferences toward bulk powdered products, which are 40 to 60% cheaper per serving than ready-to-drink options. In Colombia, the fitness culture in cities like Bogotá and Medellín supports specialty retail chains such as BodyTech, which dedicates 3% of its floor space to sports nutrition. However, rural areas remain underserved due to inadequate cold-chain infrastructure. Europe captured 24% of 2025 revenues, with the UK, Germany, and France leading regional sales. This growth is driven by the EU's Regulation 609/2013, which defines total diet replacements for weight control and requires clinical substantiation for weight-loss claims. The UK's National Health Service has incorporated meal replacement programs into its obesity treatment pathways, with general practitioners prescribing 12-week interventions that combine 800-calorie daily formulas with behavioral counseling. Germany, home to Europe's largest organic market, supports premium meal replacement brands like Huel and Foodspring, which emphasize sustainability and transparent supply chains.
Asia-Pacific is experiencing rapid growth, with the highest CAGR of 8.74% through 2031. This expansion is fueled by China's growing sports nutrition market and India's increasing demand for protein supplements. China's regulatory framework, under GB 24154-2015, defines sports nutrition foods and requires third-party testing for contaminants. This approach reduces grey-market imports and strengthens domestic brands like WonderLab, which launched high-protein meal replacement shakes in 2024. Online platforms Tmall and JD.com dominate the market, accounting for 72% of sports nutrition sales. Their Singles' Day promotions alone contribute 25 to 40% of annual sales, concentrated within a 24-hour period. In India, the FSSAI regulates protein supplements under the 2016 Food Safety and Standards regulations, requiring pre-market approval for novel ingredients and restricting health claims without clinical trial evidence. Japan's aging population is driving demand for sarcopenia-prevention formulas enriched with leucine and HMB. The Ministry of Health, Labour and Welfare has approved Foods with Function Claims, validating the muscle maintenance benefits of these products. In the Middle East and Africa, urbanization in the UAE, Saudi Arabia, and South Africa is driving dietary changes. Expatriate populations and fitness-conscious millennials are fueling the adoption of premium products. In the UAE, the ESMA (Emirates Authority for Standardization and Metrology) enforces GCC Standardization Organization requirements for sports supplements. These include Arabic labeling and halal certification, which can extend product launch timelines by 8 to 12 weeks.

Regulatory Landscape
Regulatory frameworks across major markets shape labeling, claims substantiation, and category definitions for meal replacements and total diet replacement products. In the United States, the FDA updated the implied nutrient content claim 'healthy' effective February 25, 2025, with a compliance date of February 25, 2028, and prioritized labeling and alignment workstreams in its Human Foods Program for 2026. This provides a defined path for products marketed as meal replacements or dietary supplements to manage nutrition and health-related claims while maintaining product safety standards.
In the European Union, total diet replacement for weight control remains governed by Regulation (EU) 609/2013 and delegated Regulation (EU) 2017/1798, with cross-border alignment of compositional and information requirements. In Australia and New Zealand, Standard 2.9.3 under the Food Standards Code governs formulated meal replacements with a transitional window from September 13, 2024 to September 13, 2029. Canada regulates meal replacements under the Food and Drug Regulations (Section B.24.200) updated June 5, 2026, influencing serving-size design and labeling. Across regions, regulators are emphasizing harmonized nutrition panels, allergen declarations, and compliant claim strategies as RTD and powder formats scale.
Competitive Landscape
The meal replacement market is experiencing moderate consolidation, fostering a competitive environment where established multinational corporations compete alongside innovative startups and regional specialists. For instance, Simply Good Foods' USD 280 million acquisition of the plant-based protein shake brand OWYN in June 2024 highlights this trend. This acquisition, expected to generate approximately USD 120 million in sales, strengthens Simply Good Foods' position in the rapidly growing RTD segment. Companies in this market are differentiating themselves by emphasizing functional benefits, supported by scientific validation and regulatory approvals, to justify premium pricing and build consumer trust.
Prominent players in the meal replacement products market include Nestlé SA, Herbalife Nutrition, Abbott Laboratories, and Glanbia PLC, which dominate the competitive landscape. These companies prioritize product innovation as a key growth strategy, investing heavily in research and development to introduce new flavors, formats, and functional benefits that align with evolving consumer preferences. They also demonstrate operational agility by quickly adapting to market demands, particularly through the expansion of e-commerce capabilities and direct-to-consumer programs.
Technology integration is becoming a crucial competitive advantage, with companies investing in AI-driven personalized nutrition platforms and advanced food processing technologies to improve product efficacy and enhance the consumer experience. Additionally, the FDA's approval of novel proteins through GRAS notices, such as beta-lactoglobulin derived from Aspergillus oryzae and fermented pea protein, is driving ingredient innovation that supports competitive differentiation.
Meal Replacement Products Industry Leaders
-
Abbott Laboratories
-
The Simply Good Foods Company (Atkins)
-
Glanbia PLC
-
Nestlé S.A.
-
Herbalife Nutrition Ltd.
- *Disclaimer: Major Players sorted in no particular order

Market Opportunities and Future Outlook
Two opportunity areas stand out around formats that are nutritionally complete and capable of scaling across channels, alongside incumbents moving toward complete nutrition as a portfolio adjacency. In March 2026, Danone announced a definitive agreement to acquire Huel, which signals that global dairy and specialized nutrition players are integrating complete nutrition into mainstream portfolios while accelerating international expansion and product development.
A second opportunity axis is digital-first, marketplace-led expansion and subscription replenishment, which reduces consumer friction for powders, bars, and RTD shakes. Sperri (Novagevity) closed a multi-million dollar investment around US expansion with platform support from Invest Nova Scotia, pairing funding with channel access to scale customer acquisition. Regulatory definitions in Australia and Canada also shape product differentiation through nutrient density, compliant labeling, and transparent claims relevant to weight management, healthy aging, and high-protein convenience.
Recent Industry Developments
- May 2026: Abbott Laboratories launched Ensure Strength Pro in India, positioned around healthy aging with a formulation featuring 30 g of protein and 31 nutrients. The launch expands Abbott’s adult nutrition footprint in a large, fast-growing supplements market and underscores a shift toward higher-protein meal replacement style propositions tailored to local demand.
- June 2025: Quest Nutrition introduced Quest Protein Milkshakes in 14 oz bottles with 45 g of protein and 230 calories. The product raises the performance bar in RTD protein shakes and increases competitive pressure in single-serve formats where convenience-store and online channels can scale distribution quickly.
- June 2024: The Simply Good Foods Company agreed to acquire OWYN, a plant-based protein shake brand, for USD 280 million. The deal expands Simply Good Foods’ presence in RTD and plant-based nutrition, strengthening its competitive positioning against incumbents that rely heavily on dairy-based offerings.


Research Methodology Framework and Report Scope
Market Definition and Coverage
We define the meal replacement products market as packaged foods and beverages that are positioned and consumed as a replacement for one full meal, and that offer a controlled nutrition and calorie profile across bars, powders, ready-to-drink shakes, and similar formats.
Scope exclusions: We exclude meal kits, regular frozen meals, standard snacks, and single-nutrient supplements that do not function as a full meal replacement.
Segmentation Overview
-
By Product Type
- Powdered Products
- Ready-to-Drink Products
- Nutritional Bars
- Soups
- Other Product Types
-
By Packaging Format
- Bottles/Jars
- Pouches
- Tetra Packs and Cartons
- Others
-
By Nature
- Conventional
- Organic
-
By Distribution Channel
- Supermarkets/Hypermarkets
- Convenience Stores
- Specialty Stores
- Online Retailers
- Other Distribution Channels
-
By Geography
-
North America
- United States
- Canada
- Mexico
- Rest of North America
-
South America
- Brazil
- Argentina
- Colombia
- Chile
- Rest of South America
-
Europe
- United Kingdom
- Germany
- France
- Italy
- Spain
- Russia
- Sweden
- Belgium
- Poland
- Netherlands
- Rest of Europe
-
Asia-Pacific
- China
- Japan
- India
- Thailand
- Singapore
- Indonesia
- South Korea
- Australia
- New Zealand
- Rest of Asia-Pacific
-
Middle East and Africa
- United Arab Emirates
- South Africa
- Saudi Arabia
- Nigeria
- Egypt
- Morocco
- Turkey
- Rest of Middle East and Africa
-
North America
Data Sources, Market Sizing, and Validation
Desk Research
Desk research was used to build the initial demand and supply picture, and then to set realistic guardrails for what the market can be in value terms. We used public sources such as USDA, and similar national nutrition and retail-statistics portals, along with US FDA and EFSA guidance on labeling and claims, to understand how products are defined and sold in practice. We also reviewed broad health and nutrition publications from WHO and OECD to keep the nutrition and claim language consistent with how meal replacement products are marketed.
On the market mechanics side, we reviewed customs and trade statistics for processed foods (where relevant), industry association releases, and company annual reports and investor presentations to map product launches, pricing moves, and channel expansion. For cross-checking company presence and financial direction, we referred to paid subscriptions focused on company financials and news intelligence, along with patent databases to spot formulation and packaging activity. These examples are illustrative, and many other public sources were also reviewed for data collection, validation, and clarification.
Primary Interviews and Surveys
Primary work focused on interviews and surveys with manufacturers, ingredient and packaging participants, distributors, and channel specialists across key consuming regions, where pricing, channel mix, and claim positioning get clarified for bars, powders, and ready-to-drink shakes. Inputs were used to confirm how often products are bought for meal substitution, how online and offline shares are shifting, and what typical price bands look like by format, before assumptions were locked in for the demand pool and value conversion.
Distribution of primary research fieldwork respondents
| Company type | Respondent position | Region |
|---|---|---|
| Top tier: 32% | CXOs: 13% | APAC: 44% |
| Mid tier: 53% | Functional/Unit leaders: 27% | EMEA: 29% |
| Smaller Players: 15% | Managers: 60% | Americas: 27% |
Market-Sizing & Forecasting
Market sizing starts with a top-down demand pool build that links nutrition and packaged-food consumption to the portion that is realistically substituting a meal, and then converts that demand into value using observed price bands. Results are then checked through selective bottom-up approximations such as sampled SKU price points by format, channel markups, and a roll-up of visible brand revenues where disclosures are available, which helps adjust totals when a gap shows up.
The model is guided by a few practical inputs that can be repeatedly tracked each year, such as ready-to-drink versus powder mix shifts, average selling price movement by pack size, share of online retail for nutrition and functional foods, frequency of purchase for weight management routines, and changes in labeling and claims that impact what is counted as a meal replacement. For forecasting, we use scenario analysis supported by simple trend methods, where variables like format mix and ASP progression are stress-tested with expert feedback so we do not over-extend growth when price increases or channel changes are doing most of the work. When bottom-up signals are incomplete, we handle the gap by using conservative channel coverage factors that are validated during follow-up calls.
Data Validation & Update Cycle
Validation is done through a sequence of checks that compare the model output with independent signals, such as regional consumption patterns for functional foods, observed shelf pricing, and shifts in online visibility for key formats. When unusual jumps are seen, we go back to the underlying drivers first, and then re-contact selected respondents to confirm whether the change is real or tied to timing or currency effects.
Before sign-off, the work is reviewed in multiple steps so assumptions, formulas, and year mapping are consistent across regions and formats. Reports are refreshed annually, and interim updates are made when material events occur, such as major claim changes, sudden input-cost shifts, or a channel disruption. Right before delivery, we complete a final pass so the latest public releases and pricing signals are reflected.
Mordor Intelligence's Meal Replacement Products Market Estimate Compared With Other Published Estimates
Published numbers for meal replacement products often vary, even when the topic sounds identical, because firms do not always align on what qualifies as a meal replacement and when pricing is captured. The differences also show up when one estimate relies more on list prices, while another leans on retail scan assumptions or older channel mixes.
In practice, the biggest gaps usually come from how ready-to-drink shakes, bars, powders, and adjacent functional beverages are separated, and whether weight management positioning is treated as a strict entry rule. Timing matters too, because currency conversion month, inflation pass-through, and pack-size driven ASP changes can move the value noticeably. For that reason, the latest annual refresh and a final currency and price sanity check were prioritized before publishing by Mordor Intelligence.
Benchmark comparison
| Source | Market Size | Gaps in Research Methodology |
|---|---|---|
| Mordor Intelligence | USD 15.31 B (2025) | |
| Industry Publisher A | USD 14.90 B (2025) | Uses a broader historical framing and can understate recent ASP lift when pack sizes and channel mix move, especially if currency conversion timing is not aligned to the same price window. |
| Industry Publisher B | USD 15.90 B (2026) | Reported year is one step forward, and the uplift may reflect a more aggressive price progression assumption for ready-to-drink formats rather than a like-for-like volume expansion over the same period. |
Taken together, the spread is mainly explained by year alignment, currency timing, and how price progression is treated across formats and channels. By keeping the scope anchored to true meal replacement claims and by re-checking prices close to publication, the estimate stays traceable to repeatable inputs instead of drifting with outdated mix assumptions.


Key Questions Answered in the Report
How large will the meal replacement products market be by 2031?
The market is projected to reach USD 23.82 billion by 2031, expanding at a 7.18% CAGR from 2026 levels.
Which product format is growing fastest?
Ready-to-drink shakes are forecast to grow at 8.25% CAGR because of zero-prep convenience and one-year ambient stability.
Why are cartons gaining ground in packaging?
Sugarcane-based PlantCaps closures cut each carton’s carbon footprint by 30% and improve pallet efficiency, driving an 8.97% CAGR for carton formats.
What drives Asia-Pacific demand?
Rising disposable income, strict sports-nutrition regulations, and dominant e-commerce platforms are pushing Asia-Pacific to an 8.74% CAGR, the highest globally.
Page last updated on:






