
Maritime Surveillance Market Size and Share
Market Overview
| Study Period | 2020 - 2031 |
|---|---|
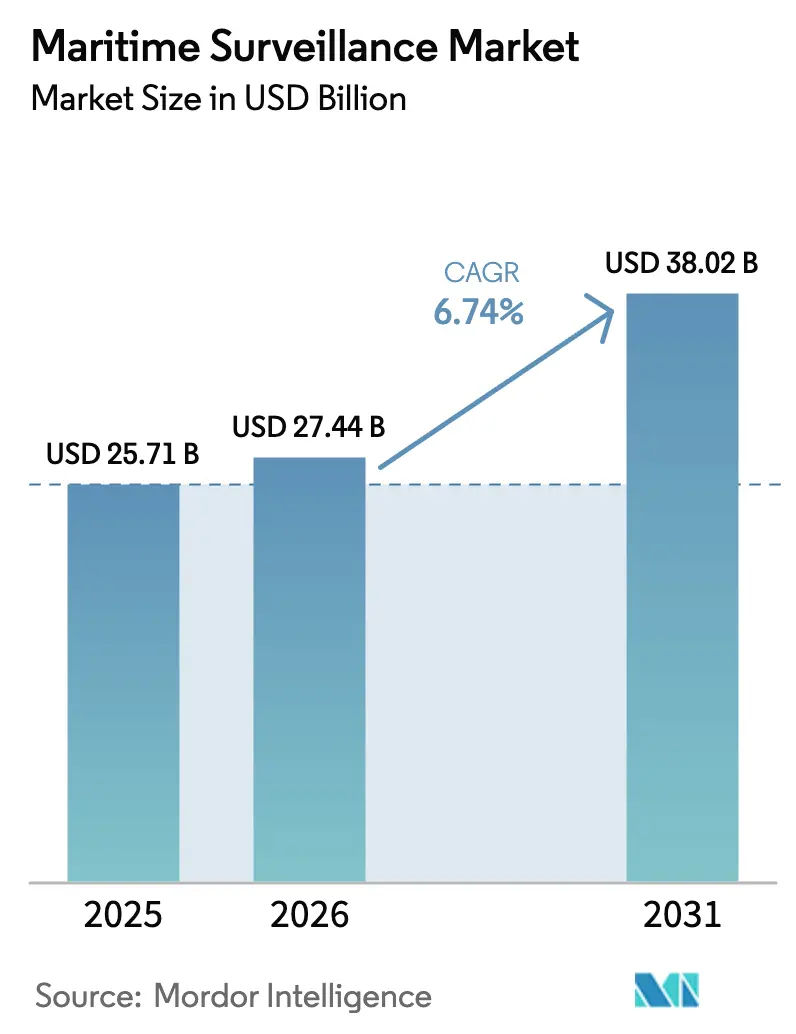
| Market Size (2026) | USD 27.44 Billion |
| Market Size (2031) | USD 38.02 Billion |
| Growth Rate (2026 - 2031) | 6.74 % |
| Fastest Growing Market | Middle East and Africa |
| Largest Market | North America |
| Market Concentration | Medium |
Major Players *Disclaimer: Major Players sorted in no particular order Image © Mordor Intelligence. Reuse requires attribution under CC BY 4.0. | |
Maritime Surveillance Market Analysis by Mordor Intelligence
The maritime surveillance market size in 2026 is estimated at USD 27.44 billion, growing from 2025 value of USD 25.71 billion with 2031 projections showing USD 38.02 billion, growing at 6.74% CAGR over 2026-2031. Rising grey-zone coercion in exclusive economic zones, accelerated naval modernization, and adoption of autonomous ISR swarms underpin this momentum. Governments prioritize sensor-fusion architectures that compress detect-to-engage timelines, while export-control chokepoints spur allied co-development of advanced sensors. Demand gravitates toward software-defined command-and-control (C2) layers that orchestrate multi-domain data streams at kill-web speed, stimulating procurement of AI-enabled analytics. Simultaneously, lifecycle cost pressures encourage modular upgrades that reuse hulls but insert new radars or cloud-linked processors, creating retrofit opportunities for primes and tier-2 software vendors.
Key Report Takeaways
- By application, naval operations led with 47.32% revenue share in 2025; border security is projected to expand at an 8.05% CAGR through 2031.
- By platform, coastal/fixed installations captured 38.40% of the maritime surveillance market share in 2025, while airborne systems are advancing at an 8.28% CAGR to 2031.
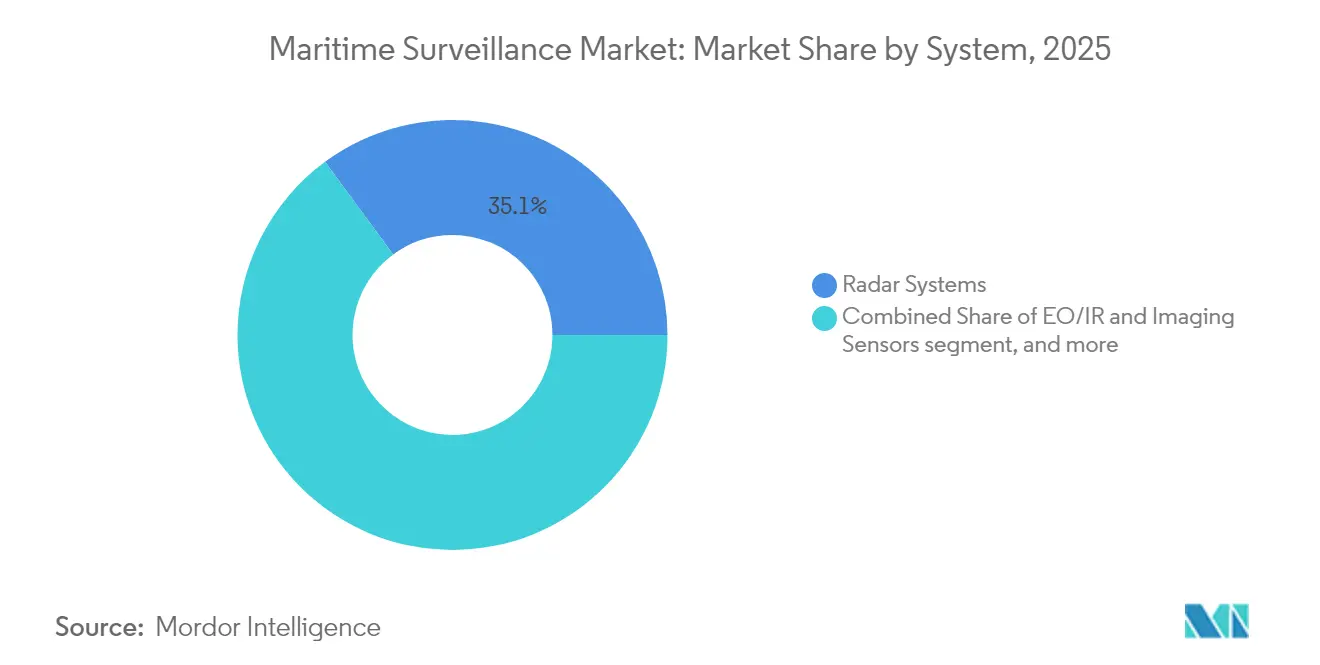
- By system, radar accounted for a 35.10% share of the maritime surveillance market in 2025, and integrated C2/analytics software is progressing at an 8.76% CAGR through 2031.
- By component, hardware held a 64.60% share of the maritime surveillance market in 2025; software recorded the fastest growth at a 9.12% CAGR.
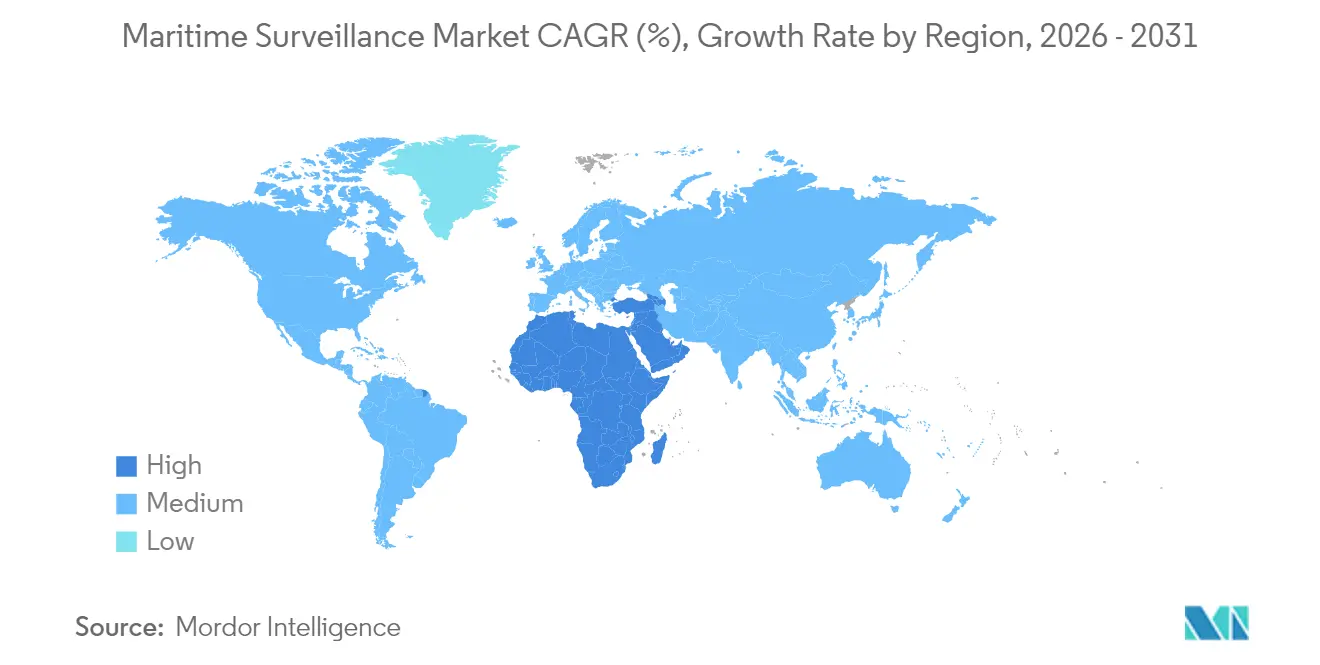
- By geography, North America commanded a 35.10% share of the maritime surveillance market in 2025, whereas the Middle East and Africa registered an 8.94% CAGR during 2026-2031.
Note: Market size and forecast figures in this report are generated using Mordor Intelligence’s proprietary estimation framework, updated with the latest available data and insights as of 2026.
Market Trends and Insights
Drivers Impact Analysis of Maritime Surveillance Market*
| Driver | (~)% Impact on CAGR Forecast | Geographic Relevance | Impact Timeline |
|---|---|---|---|
| Grey-zone maritime coercion and contested EEZs | +1.2% | APAC core, spill-over to MEA | Medium term (2-4 years) |
| Indo-Pacific naval modernization race | +1.5% | APAC, North America, Europe | Long term (≥4 years) |
| Rapid fielding of autonomous ISR strike swarms | +0.8% | Global, led by North America and Europe | Short term (≤2 years) |
| AI-enabled sensor-fusion for kill-web speed | +1.1% | Global, advanced military markets | Medium term (2-4 years) |
| Hypersonic-era early-warning radar upgrades | +0.9% | North America, Europe, APAC | Long term (≥4 years) |
| Space-to-sea ISR layer for joint all-domain ops | +1.3% | Global, space-capable nations | Long term (≥4 years) |
| Source: Mordor Intelligence | |||
Grey-zone maritime coercion and contested EEZs
States leverage non-kinetic tactics below conflict thresholds to assert claims, as seen in South China Sea ship militia maneuvers.[1] Continuous monitoring that discriminates fishing trawlers from covert militia hulls is therefore essential. The Enhanced Defense Cooperation Agreement supports the Philippines' acquisition of persistent surface-air sensor grids to cross-cue unmanned assets.[2] This environment boosts orders for high-resolution coastal radar, AIS spoofing detection, and pattern-of-life analytics that flag abnormal loitering.
Indo-Pacific naval modernization race
Regional defense budgets rise 7.2% annually, funding carrier groups, destroyers, and long-range missiles that depend on resilient surveillance backbones. Japan integrates multifunction radar masts for counter-strike missions, while Australia’s AUKUS submarine enterprise specifies an acoustic array networked to space-based relays.[3] Interoperability mandates open-architecture mission systems, propelling maritime surveillance market demand for modular, sovereign-configurable suites.
Rapid fielding of autonomous ISR strike swarms
The US Ghost Fleet Overlord tests validated unmanned surface vessels that self-organize across theaters. Swarm logic optimizes sensor placement, multiplying surveillance footprints without equivalent manpower. Commercial offshore operators mirror this with autonomous AUVs for pipeline inspection, illustrating civil-mil convergence that widens the maritime surveillance market. Edge-cloud fusion engines that ingest dozens of low-power feeds now outpace human analysts, elevating software value.
AI-enabled sensor-fusion for kill-web speed
Hypersonic threats compress decision loops to seconds, spurring adoption of machine-learning classifiers that triage multiband inputs at machine velocity. NATO’s Maritime Unmanned Systems Initiative pushes federated data models so allies share real-time tracks. Vendors embedding explainable AI gain an advantage, as customers insist on human-in-the-loop assurance without losing speed.
Restraints Impact Analysis of Maritime Surveillance Market*
| Restraint | (~)% Impact on CAGR Forecast | Geographic Relevance | Impact Timeline |
|---|---|---|---|
| Export-control choke-points on advanced sensors | -0.7% | Global, non-allied nations | Short term (≤2 years) |
| Multi-domain C2 interoperability gaps | -0.6% | Global, coalition ops | Medium term (2-4 years) |
| High lifecycle cost of AESA and DEW-ready radars | -0.8% | Global, budget-constrained | Long term (≥4 years) |
| Cyber-attack surface expansion in networked fleets | -0.5% | Global, advanced navies | Short term (≤2 years) |
| Source: Mordor Intelligence | |||
Export-control choke-points on advanced sensors
Export-control choke-points on advanced sensors continue to fracture procurement pathways. Under the US International Traffic in Arms Regulations (ITAR) and the European Union's (EU's) dual-use control lists, gallium nitride (GaN) power amplifiers, ultra-low-noise receivers, and digital radio-frequency memory chips are treated as strategic assets. Licenses for these components can stretch 12-18 months and often contain strict re-export clauses that complicate multinational integration programs. As a result, allied navies secure next-generation AESA arrays and electronic-warfare-resistant processors first, while non-aligned buyers are funneled toward less capable legacy designs. To mitigate the gap, several Asia–Pacific and Middle Eastern shipyards have launched co-production lines, pairing local assembly with tier-2 semiconductor fabrication, thereby planting seeds for future joint ventures that might eventually bypass current choke-points
Multi-domain C2 interoperability gaps
Multi-domain C2 interoperability gaps stem from decades of platform-specific data formats, bandwidth-hungry video feeds, and incompatible encryption suites. Older vessels still broadcast track files in proprietary message sets that new unmanned assets cannot parse, forcing operators to employ protocol translators that add latency and risk data truncation during peak activity. Although NATO’s Federated Mission Networking framework defines a common standard, implementation varies by nation, and coalition exercises routinely surface schema mismatches that delay fused targeting solutions. These issues grow more acute as maritime forces attempt to synchronize with space, cyber, and land sensors, revealing that technical fixes must be paired with sustained governance and cyber-accreditation reforms to deliver a truly joint all-domain picture
*Our forecasts treat driver/restraint impacts as directional, not additive. The impact forecasts reflect baseline growth, mix effects, and variable interactions.
Maritime Surveillance Market Segment Analysis
By Application:
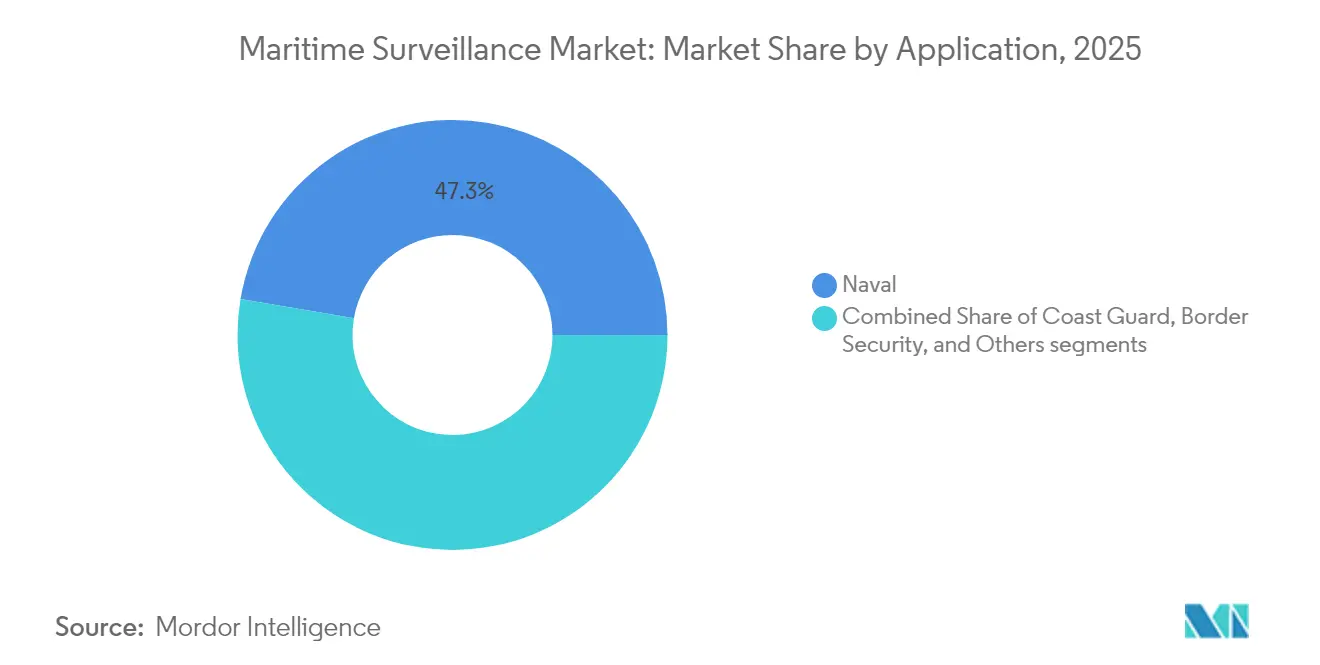
Naval Dominance Drives Border Security SurgeNaval missions generated USD 12.16 billion of the maritime surveillance market size in 2025 and retained 47.32% leadership owing to fleet modernization across the US, China, and India. Sensor-rich destroyers link with space relays to extend detection horizons, while carrier air wings integrate AI-enabled EO/IR pods for sea-control operations. The maritime surveillance industry also sees high-endurance unmanned surface vessels (USVs) blended into battle networks, lowering per-mile coverage cost. Border security trailblazes growth at an 8.05% CAGR as coastal nations automate migration interdiction and anti-smuggling patrols using shore radars fused with UAV feeds.
Commercial ports, fisheries, and offshore energy operators adopt dual-use surveillance suites, benefitting from spill-over R&D. Environmental agencies exploit AI classifiers originally coded for submarine detection to flag illegal dumping. This convergence broadens the buyer base, enlarging the maritime surveillance market even where defense budgets plateau.

By Platform:
Airborne Systems Accelerate Beyond Coastal InfrastructureCoastal and fixed sites accounted for 38.40% of the maritime surveillance market share in 2025, anchored by long-range over-the-horizon radars guarding straits and EEZ borders. Yet airborne assets outpace stationary nodes with an 8.28% CAGR as P-8 Poseidon upgrades and UAV procurements proliferate. The maritime surveillance industry embraces attritable drones that loiter 24+ hours, passing detections via satcom to distributed ops centers.
Surface vessels integrate low-probability-of-intercept radars and deck-mounted EO turrets, extending sensing arcs for distributed lethal networks. Sub-surface acoustic arrays map helical routes of quiet diesel-electric subs, though capex confines uptake to major navies. As airborne ISR costs fall, smaller states leapfrog to aerial coverage rather than erect costly coastal towers, reshaping geographic spend patterns within the maritime surveillance market.
By System:
Software Analytics Outpace Radar DominanceGiven its all-weather tracking value, radar still commands a 35.10% share of the maritime surveillance market. However, integrated C2 and analytics suites expand 8.76% annually as navies prioritize cognitive systems that slash operator burden. Sensor-agnostic middleware ingests radar, sonar, AIS, and satellite images to build single-pane maritime pictures. Vendors differentiate through real-time anomaly detection, false-alarm suppression, and predictive course-of-action algorithms.
EO/IR payloads add positive ID, feeding classification AI that has migrated from self-driving car perception stacks. Sonar chains detect undersea infrastructure threats, while passive RF arrays such as TwInvis exploit civilian broadcasts to locate stealth aircraft without emitting. This multi-phenomenology demand invigorates the maritime surveillance industry’s software segment, converting hardware data streams into decision advantage.
By Component:
Software Revolution Transforms Hardware-Centric MarketHardware kept 64.60% of the maritime surveillance market in 2025 due to capital-intensive antennas and stabilized gimbals. Nonetheless, software revenues are growing 9.12% yearly, reflecting cloud-edge pipelines that deploy micro-services afloat. AI model updates enhance threat libraries without dry-dock periods, sustaining platform relevance. This shift aligns with customers' desire for open APIs that avoid vendor lock-in, compelling primes to open proprietary buses or risk displacement by agile ISVs.
Cybersecure DevSecOps pipelines emerge as differentiators; navies demand software bills-of-material and continuous vulnerability scanning. Consequently, the maritime surveillance market now values certification bodies and digital-twin testing labs on par with physical test ranges.
Geography Analysis
North America Maritime Surveillance Market
North America retained 35.10% of the maritime surveillance market share in 2025, supported by USD 19 billion yearly US Navy and Coast Guard modernization outlays. Distributed maritime operations hinge on sensor-rich surface combatants, while the Coast Guard backs Offshore Patrol Cutters with AESA and AI analytics for counter-narcotics. Canada funds Polar Epsilon Next to surveil melting Arctic sea lanes via RADARSAT-Constellation imagery downlinked to Halifax. Mexico integrates coastal radars with UAVs to curb drug-laden semi-submersibles.
MEA Maritime Surveillance Market
The Middle East and Africa posts the fastest 8.94% CAGR as GCC states shield the Strait of Hormuz tanker routes amid drone and mine incidents. Saudi Arabia bundles maritime surveillance packages into Vision 2030 coastal megaprojects. UAE pioneers unmanned surface picket lines, leveraging foreign partnerships for sovereign data control. Israel deploys autonomous patrol craft around gas rigs, coupling ELINT sensors with AI correlation engines. South Africa upgrades Kelvin radar chain to monitor illegal fishing and vessel-borne pollution around the Cape.
Europe and APAC Maritime Surveillance Market
Europe and Asia-Pacific exhibit steady uptake tied to unique threat vectors. Europe funds Mediterranean SAR and Arctic situational awareness using Galileo PRS signals for encrypted vessel tracking. Asia-Pacific modernization remains the maritime surveillance market’s strategic fulcrum, but export-control bifurcation means US allies access GaN radars while others diversify toward Israeli or indigenous sensors. Japan rolls out shipborne OQQ-25 sonars; Australia seeds sovereign AI labs for anti-submarine warfare analytics; India fields coastal surveillance chains under Project Sagarmala.
Regulatory Landscape
The market operates under a layered governance structure across maritime security obligations, defense export controls, and cyber-related requirements. On the civilian and port side, the International Maritime Organization (IMO) anchors core expectations through SOLAS Chapter XI-2 and the mandatory International Ship and Port Facility Security (ISPS) Code, which shape port-facility security plans, risk assessments, and reporting routines. These processes increasingly rely on coastal radar, AIS, and fused maritime domain awareness systems, with IMO MSC.1/Circ.1525 used to guide national maritime security legislation aligned to ISPS implementation.
On the defense side, technology transfer and integration are influenced by export-control regimes, including US International Traffic in Arms Regulations (ITAR) and the European Union dual-use control lists. These rules can constrain shipment and re-export of advanced sensor components referenced in procurement pathways, such as GaN and digital RF subsystems. Interoperability and information-sharing requirements for coalition operations also drive specifications: NATO updated its Alliance Maritime Strategy in October 2025, emphasizing improved information exchange and new surveillance and tracking technologies and reinforcing demand for standards-based data interfaces and accredited cyber baselines for networked maritime ISR.
Value Chain Analysis
The maritime surveillance value chain begins with upstream component suppliers covering radar and EO/IR electronics, acoustic transducers, RF front ends, compute, and secure communications. These inputs then feed sensor OEMs and mission-system providers that package radar, EO/IR, AIS/identification, sonar, and datalinks into platform-ready subsystems. Prime integrators and combat-system houses complete mission integration, software-defined C2 and analytics configuration, and secure networking for maritime patrol aircraft, UAVs, surface combatants, and coastal installations, followed by testing, accreditation, and certification activities tailored to national security handling rules and coalition interoperability.
Downstream, delivery and sustainment are shaped by long-lived service contracts covering installation, training, cybersecurity patching, and analytics model updates. Buyers increasingly favor modular upgrades and open architectures that reuse existing hulls and shore infrastructure. Recent program structures reflect this integration-heavy setup: L3Harris is positioned as a lead system vendor integrating surveillance-related systems for the US Navy T-AGOS-25 ocean surveillance shipset, while architectures such as Airbus Defence and Space STYRIS are designed as multi-node, sensor-agnostic platforms that ingest third-party sensors and existing infrastructure feeds. In those cases, differentiation shifts toward data fusion, workflow automation, and secure information sharing.
Competitive Landscape
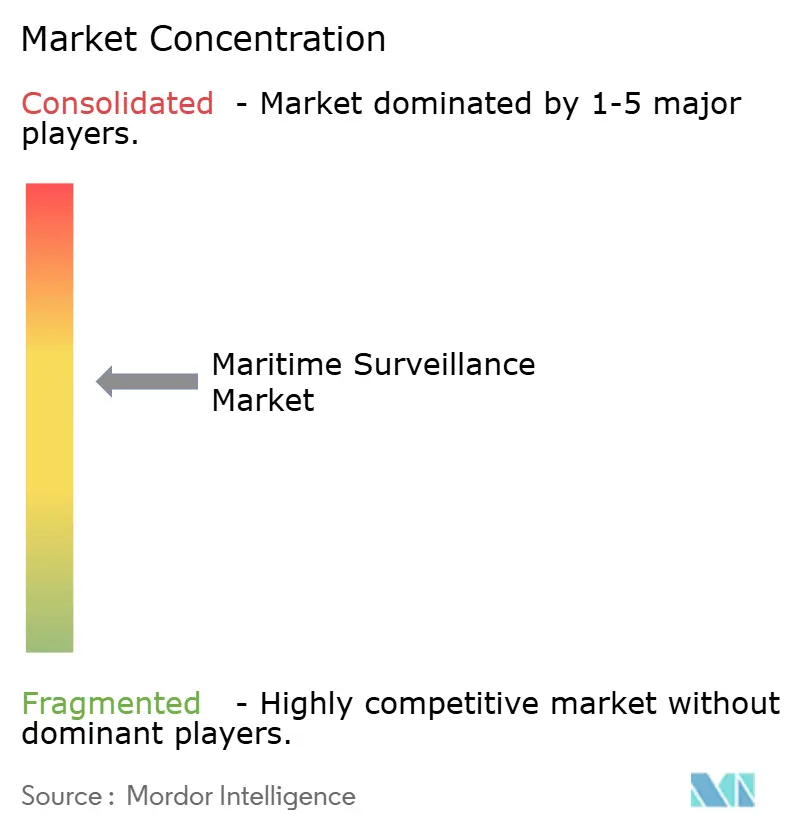
The maritime surveillance market is moderately consolidated. Lockheed Martin, Elbit Systems, and Thales anchor naval radar and C2, enjoying deep classified program pipelines. Strategic moves in 2024 signal a pivot to software; Lockheed’s USD 1.2 billion Aegis refresh integrates satellite data in real time. Thales delivered GaN-based Sea Fire radars, touting 25% lower power draw.
Mid-tier specialists expand through M&A: Kongsberg’s USD 85 million purchase of Maritime Robotics grants autonomous vessel IP, while L3Harris debuts AI-fused sensor suites for P-3 upgrades. Start-ups target edge analytics; Terma pairs with Microsoft Azure Government to host classified maritime AI models. Competition intensifies around passive radar and cyber-resilient mesh networks, with Hensoldt’s TwInvis and Northrop’s ZPY-8 integrations illustrating shifting R&D weight toward multi-phenomenology sensing.
Success hinges on meeting export regulations and cyber accreditation. Vendors offering ITAR-compliant open architectures with zero-trust baselines win multinational tenders. Partnerships between primes and cloud hyperscalers aim to balance classified handling with elastic compute, shaping the future structure of the maritime surveillance industry.
Maritime Surveillance Industry Leaders
-
Thales Group
-
Kongsberg Gruppen ASA
-
Saab AB
-
Elbit Systems Ltd.
-
L3Harris Technologies, Inc.
- *Disclaimer: Major Players sorted in no particular order
Maritime Surveillance Market Companies Covered in this Report
- SRT Marine Systems plc
- Kongsberg Gruppen ASA
- Bharat Electronics Limited
- Anschütz GmbH
- Thales Group
- Saab AB
- Elbit Systems Ltd.
- Indra Sistemas S.A.
- Terma Group
- HENSOLDT AG
- L3Harris Technologies, Inc.
- Lockheed Martin Corporation
- Northrop Grumman Corporation
- Leonardo S.p.A.
- Wärtsilä Corporation
- Frequentis AG
- Teledyne Technologies Incorporated
- Saildrone, Inc.
Market Opportunities and Future Outlook
Critical infrastructure protection is expanding the addressable buyer set beyond traditional naval and coast guard modernization. That shift pulls demand toward subsea sensing, persistent monitoring, and analytics that correlate anomalies across offshore platforms, undersea cables, and energy corridors. A concrete signal came in July 2026, when Kongsberg secured an international contract focused on underwater surveillance and protection of critical subsea infrastructure, aligning with NATO's October 2025 Alliance Maritime Strategy emphasis on protecting maritime critical infrastructure and improving information exchange.
Airborne maritime surveillance and cross-domain fusion continue to represent a major whitespace for countries linking coastal networks with wide-area sensing and coalition data-sharing. In May 2026, Saab was named preferred supplier for Canada's future Airborne Early Warning and Control (AEW&C) capability centered on GlobalEye, reinforcing a procurement pathway that combines airborne sensors with maritime picture compilation. Separately, platform and combat-system modernization that embeds software-defined C2 and modern radars continues to create integration and retrofit work: Saab's July 2026 order to equip Germany's new F128 frigates with 9LV and Sea Giraffe radars underscores ongoing standardization around integrated sensor-to-C2 stacks that can be extended through upgrades, cybersecurity hardening, and interoperability tooling.
Recent Industry Developments in Maritime Surveillance Market
- July 2026: Saab AB awarded SEK 8.7 billion contract to supply 9LV combat systems, Sea Giraffe 4A and 1X radars, and composite superstructures for four German Navy MEKO A-200 DEU class frigates. The award strengthens Saab's naval radar and C2 footprint and boosts interoperability with NATO fleets. It also expands software defined sensor integration across European naval platforms.
- July 2026: Kongsberg Gruppen contract with international customer for monitoring and protection of critical subsea infrastructure. The deal expands Kongsberg's subsea sensing and defense offerings and supports resilience of energy corridors and naval assets.
- May 2026: Saab AB named preferred supplier for Canada’s future Airborne Early Warning and Control AEW&C capability, with GlobalEye platform designated for potential procurement. The arrangement strengthens Saab's role in North American ISR modernization and may lead to long-term sourcing and integration with allied fleets.
Maritime Surveillance Market Report Scope and Research Methodology
Market Definition and Coverage
For this report, the maritime surveillance market is defined as revenue generated from systems, software, and related integration used to detect, identify, track, and monitor activity across coastal and offshore waters for defense and civil use.
Scope exclusions: It excludes general shipbuilding and routine port operations that do not primarily deliver surveillance, detection, or maritime domain awareness outcomes.
Segments Covered in This Report
- By Application
- Naval
- Coast Guard
- Border Security
- Others
- By Platform
- Coastal/Fixed Installations
- Surface Vessels
- Airborne (MPA, UAV)
- Sub-Surface (UUV/USV relay)
- By System
- Radar Systems
- EO/IR and Imaging Sensors
- AIS and Identification Systems
- Sonar and Acoustic
- Integrated C2/Analytics Software
- Communications and Datalinks
- By Component
- Hardware
- Software
- By Geography
- North America
- United States
- Canada
- Mexico
- Europe
- United Kingdom
- France
- Germany
- Russia
- Rest of Europe
- Asia-Pacific
- China
- India
- Japan
- South Korea
- Rest of Asia-Pacific
- South America
- Brazil
- Rest of South America
- Middle East and Africa
- Middle East
- Saudi Arabia
- Israel
- United Arab Emirates
- Rest of Middle East
- Africa
- South Africa
- Rest of Africa
- Middle East
- North America
Data Sources, Market Sizing, and Validation
Desk Research
Desk research started with mapping demand drivers that typically translate into maritime surveillance budgets, procurement plans, and upgrade cycles. We used public sources such as NATO releases, UNODC reporting on maritime crime, IMO publications on maritime safety, and IHS Markit style trade statistics equivalents from official customs portals where available. We also referenced US government publications, including DHS and US Coast Guard documents, along with European Commission material to understand coastal monitoring priorities and funding signals.
To convert context into usable inputs, we leaned on company filings, investor presentations, defense and coast guard tender notices, and reputable press coverage of platform upgrades and sensor procurements. In a few places, paid subscriptions were used to cross-check company financials and to scan patents around radar, EO/IR, and AIS related innovation so assumptions did not drift. The sources listed here are illustrative only, and many other public documents and databases were also reviewed for data collection, cross-checking, and clarification.
Primary Interviews and Surveys
Primary interviews and surveys were used to validate what is actually being bought, how programs are phased, and how pricing shifts when systems are bundled with software, integration, and upgrades. We spoke with a mix of platform and system stakeholders, procurement and operations users, and channel-side experts who track bids and deliveries across key maritime theaters. Where desk sources were thin, inputs such as typical replacement cycles, upgrade timing, and adoption of multi-sensor fusion were rechecked with experts so the final model stayed realistic.
Distribution of primary research fieldwork respondents
| Company type | Respondent position | Region |
|---|---|---|
| Top tier: 31% | CXOs: 15% | APAC: 47% |
| Mid tier: 53% | Functional/Unit leaders: 39% | EMEA: 35% |
| Smaller Players: 16% | Managers: 46% | Americas: 18% |
Market-Sizing & Forecasting
Sizing was built using a top-down approach where defense and civil maritime monitoring spend signals were reconstructed by geography and then allocated to surveillance systems based on observed program mix and adoption levels. To keep totals grounded, results were corroborated with selective bottom-up approximations such as sampled contract values, typical system ASPs multiplied by expected unit volumes, and channel checks on retrofit activity.
Key model inputs included coastal and offshore patrol fleet modernization cadence, sensor refresh cycles for radar and EO/IR, AIS coverage requirements, integration intensity (standalone sensor versus fused command-and-control stacks), and the share of upgrades versus new installations. When a data gap appeared for smaller procurement programs, assumptions were filled using comparable program patterns and then adjusted after expert feedback.
For forecasting, scenario analysis was applied around procurement timing and delivery slippages, and then a simple multivariate regression overlay was used to relate growth to budget signals, security incidents, and fleet activity indicators. The final forecast was stress-tested so short-term jumps did not exceed what procurement pipelines and installation capacity can realistically support.
Data Validation & Update Cycle
Outputs were validated through multiple checks, including year-over-year variance review, cross-comparison versus independent indicators such as tender flow and known program cycles, and consistency checks across platform and system totals. If an outlier appeared, the assumptions behind pricing, delivery timing, or scope inclusion were revisited and, when needed, experts were re-contacted to confirm what changed.
Before sign-off, the work goes through a multi-step internal review so calculations, units, and currency handling match the stated scope. Reports are refreshed annually, and interim updates are made when material events occur that can move demand, pricing, or procurement timelines. Right before delivery, a final pass is done so clients receive the latest updated view.
Mordor Intelligence's Maritime Surveillance Market Sizing Compared With Other Published Estimates
Published market numbers for maritime surveillance can look far apart because firms do not always count the same things, and they may also anchor their models to different budget and procurement timelines. The table helps show that even when the same market name is used, scope and measurement choices can move the final value noticeably.
The benchmark table shows a higher 2026 value than some figures that are anchored to earlier base years or that blend adjacent areas such as broader maritime security and intervention. In Mordor Intelligence's model, the total is built from surveillance specific systems and software demand signals across defense and civil use, with growth tied to platform upgrades and sensor refresh cycles rather than counting unrelated security services.
Benchmark comparison
| Source | Market Size | Gaps in Research Methodology |
|---|---|---|
| Mordor Intelligence | USD 27.44 B (2026) | |
| Global Data Publisher A | USD 28.54 B (2024) | Uses a different base year and can mix in intervention oriented spending and broader security response budgets, which inflates comparability when only surveillance system revenue is intended. |
| Industry Research Outlet B | USD 23.40 B (2025) | Often applies conservative adoption and ASP progression assumptions and may undercount retrofit and software layers by focusing mainly on hardware shipments. |
Overall, the spread mainly comes from what is counted as surveillance versus adjacent categories, plus how base year timing and price progression are treated. By keeping inputs tied to clear procurement signals, upgrade cycles, and system level pricing logic, us and our clients can trace the total back to repeatable steps and practical assumptions.
Key Questions Answered in the Report
What is the global value of the maritime surveillance market in 2026?
The maritime surveillance market size is valued at USD 27.44 billion in 2026.
How fast will maritime surveillance revenues grow between 2026 and 2031?
Aggregate revenues are projected to rise at a 6.74% CAGR, reaching USD 38.02 billion by 2031.
Which application area is expanding the quickest?
Border security leads growth at an 8.05% CAGR as nations automate coastal interdiction and anti-smuggling patrols.
Which platform type is seeing the strongest demand increase?
Airborne platforms, including maritime patrol aircraft and UAVs, are advancing at an 8.28% CAGR through 2031.
Which region is expected to record the highest growth rate?
Middle East and Africa shows the fastest regional CAGR at 8.94% due to heightened tanker-lane security investments.
What technology trend is transforming future surveillance capabilities?
AI-enabled sensor-fusion that delivers kill-web-speed decisions is reshaping command-and-control architectures across fleets.