Maritime Analytics Market Size and Share
Market Overview
| Study Period | 2020 - 2031 |
|---|---|
| Market Size (2026) | USD 1.62 Billion |
| Market Size (2031) | USD 2.59 Billion |
| Growth Rate (2026 - 2031) | 9.84% CAGR |
| Fastest Growing Market | Asia Pacific |
| Largest Market | Europe |
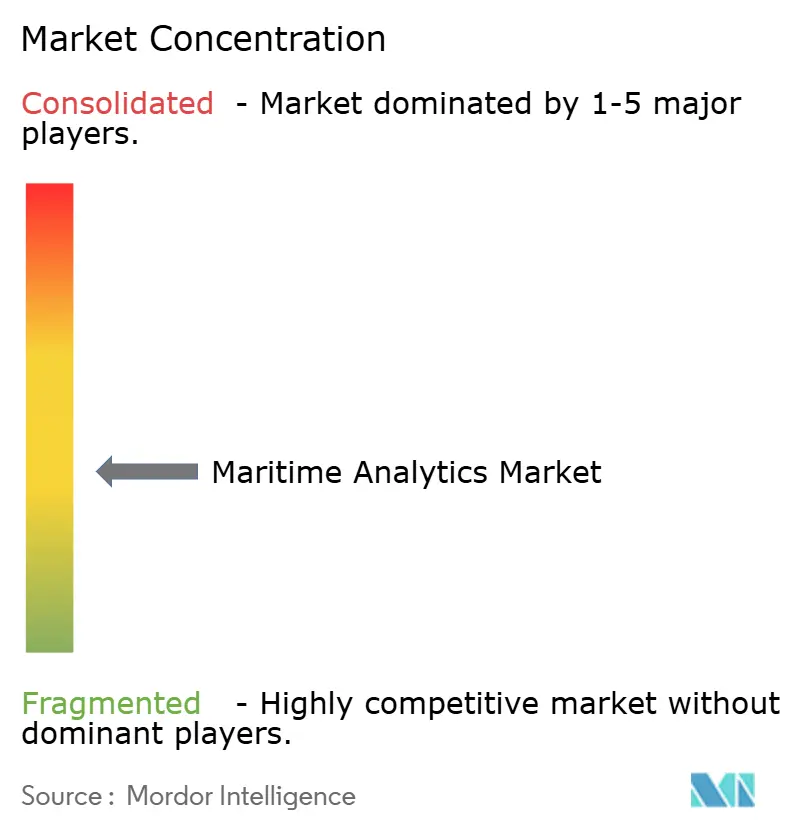
| Market Concentration | Medium |
Major Players *Disclaimer: Major Players sorted in no particular order Image © Mordor Intelligence. Reuse requires attribution under CC BY 4.0. | |
Maritime Analytics Market Analysis by Mordor Intelligence
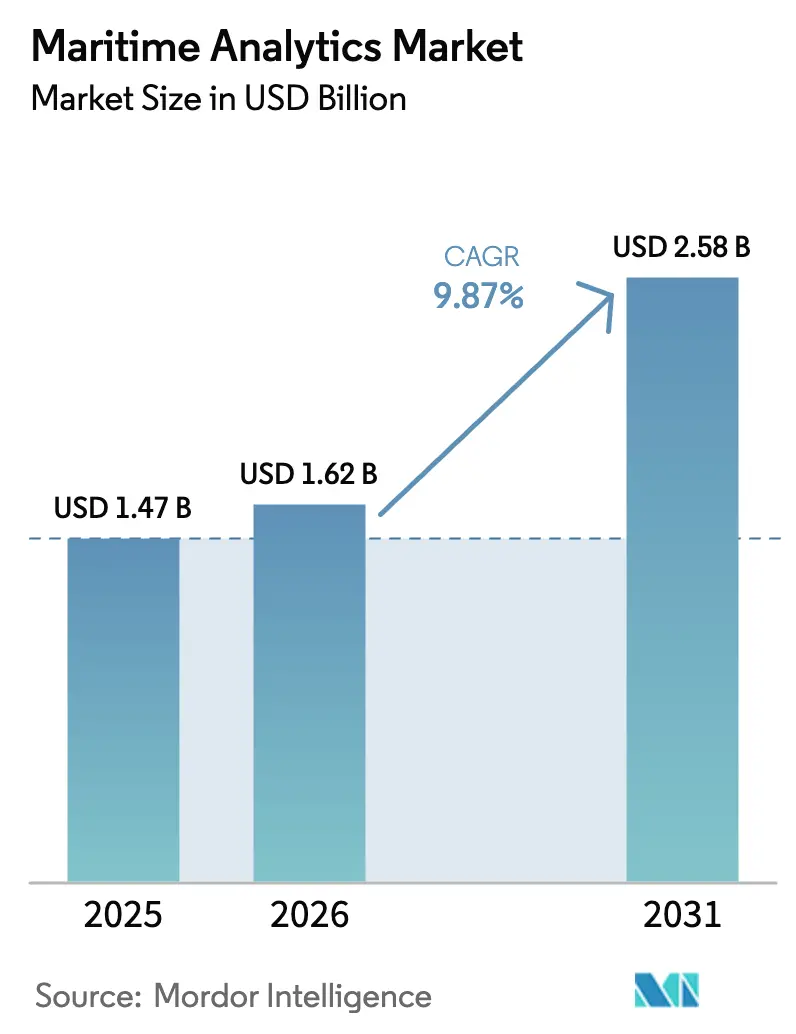
The maritime analytics market size is projected to expand from USD 1.47 billion in 2025 and USD 1.62 billion in 2026 to USD 2.59 billion by 2031, registering a CAGR of 9.84% between 2026 to 2031. Fleet digitalization is moving from pilot stages to fleet-wide programs, positioning analytics platforms as core infrastructure. Software vendors are embedding regulatory logic that helps owners manage European Union and International Maritime Organization carbon-reduction mandates, while edge computing lowers latency so collision-avoidance and dynamic-positioning algorithms can run safely at sea. Investor appetite remains strong, with more than USD 200 million of venture capital flowing to start-ups during 2025, and established equipment makers are bundling analytics modules with propulsion, navigation, and cargo-handling systems. Hybrid cloud-edge architectures are gaining traction because they let operators combine shore-based model training with real-time shipboard inference, a balance that reduces satellite-bandwidth costs and improves decision speed.
Key Report Takeaways
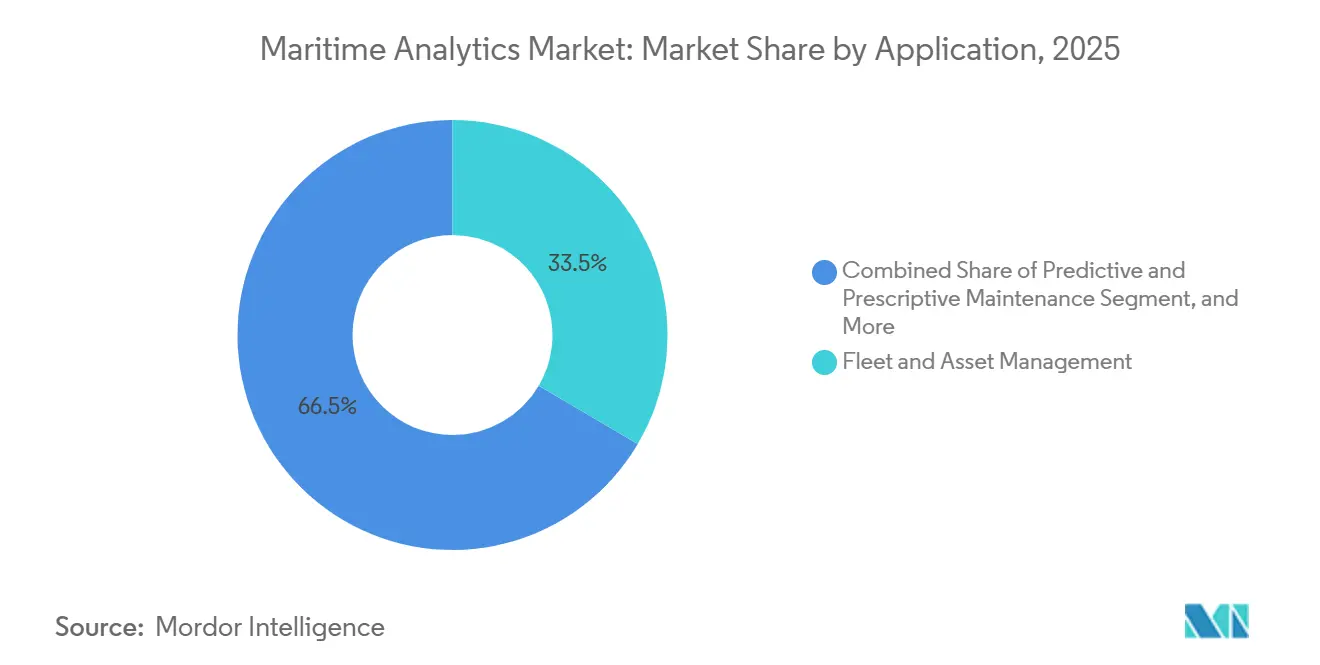
- By application, Fleet and Asset Management led the maritime analytics market with 33.46% market share in 2025, while Predictive and Prescriptive Maintenance is advancing at a 10.83% CAGR through 2031.
- By end-user, Commercial Shipping Lines accounted for 42.67% of 2025 spending, whereas Ports and Terminal Operators are projected to grow at a 10.64% CAGR to 2031.
- By deployment mode, Cloud installations accounted for 57.89% in 2025, while Hybrid models are rising at a 10.49% CAGR through 2031.
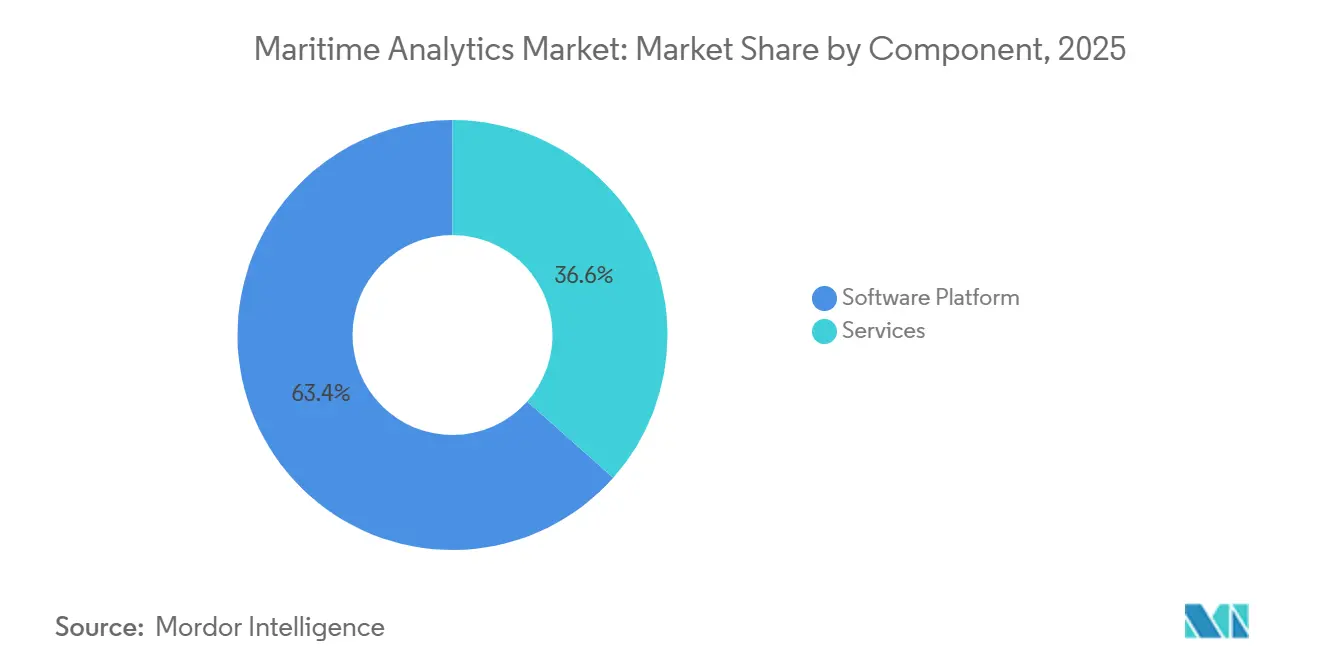
- By component, Software Platforms accounted for 63.44% of 2025 revenue, while Services are progressing at a 10.07% CAGR through 2031.
- By analytics type, Descriptive Analytics held 46.71% of 2025 spending, and Prescriptive Analytics is set to grow at a 10.22% CAGR during 2026-2031.
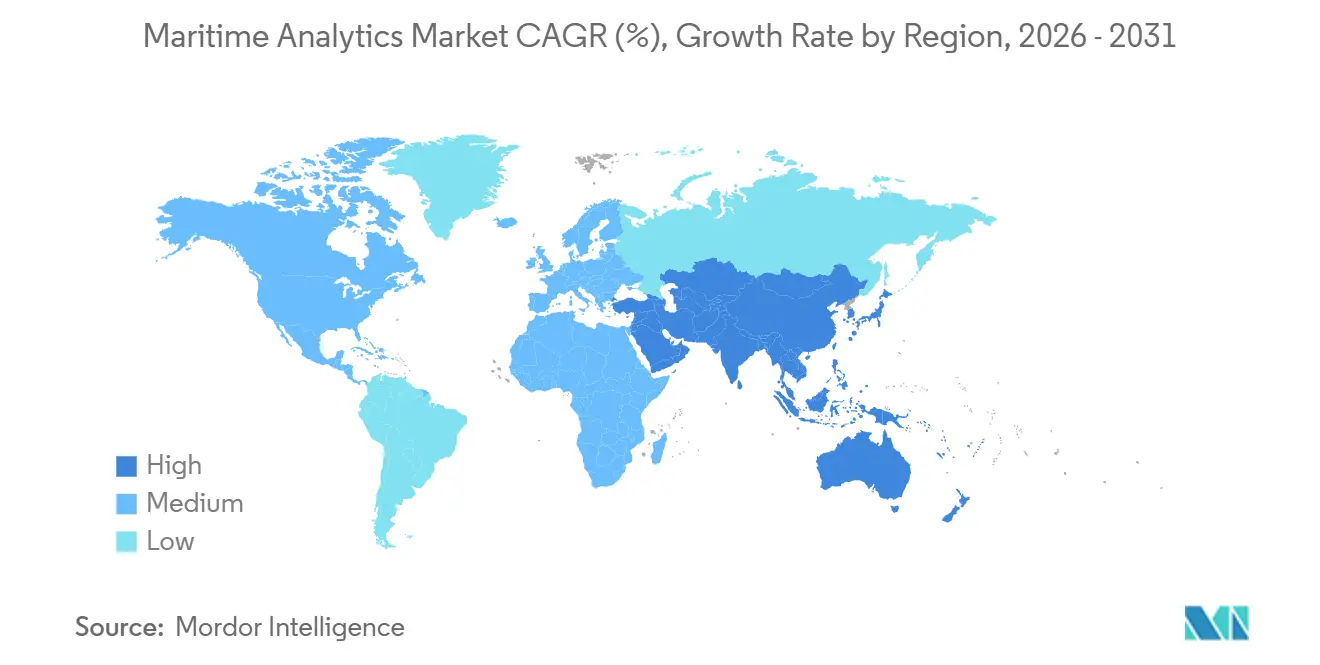
- By geography, Europe captured 28.74% of 2025 revenue, and Asia-Pacific is forecast to expand at a 10.87% CAGR between 2026-2031.
Note: Market size and forecast figures in this report are generated using Mordor Intelligence’s proprietary estimation framework, updated with the latest available data and insights as of January 2026.
Global Maritime Analytics Market Trends and Insights
Drivers Impact Analysis
| Driver | (~) % Impact on CAGR Forecast | Geographic Relevance | Impact Timeline |
|---|---|---|---|
| Rising Digitization Across Global Fleets | +2.1% | Global, early uptake in Europe and North America | Medium term (2-4 years) |
| Regulatory Push for Fuel-Efficiency and Emissions Compliance | +2.3% | Europe and North America expanding to Asia-Pacific | Medium term (2-4 years) |
| Growing Adoption of IoT and Vessel Connectivity | +1.9% | Global, led by European and North American liner operators | Short term (≤2 years) |
| Expansion in Seaborne Trade Volumes | +1.8% | Asia-Pacific core, spillover to Middle East and Africa | Long term (≥4 years) |
| AI-Driven Route Optimisation Reducing Bunker Spend | +1.6% | Global, strongest in container and bulk segments | Short term (≤2 years) |
| Venture Capital Inflow Into Maritime-Tech Start-Ups | +1.2% | North America and Europe, emerging Asia-Pacific | Long term (≥4 years) |
| Source: Mordor Intelligence | |||
Rising Digitization Across Global Fleets
Ship-owners are outfitting vessels with private LTE or 5G networks that deliver 4G-class bandwidth, replacing narrow satellite links that once restricted data exchange. Maersk deployed shipboard wireless across 450 vessels in 2025, letting shore teams retrieve engine logs for predictive diagnostics.[1]Maersk, “OneWireless Platform Deployment,” maersk.com Telenor Maritime reported a 60% jump in connectivity subscriptions that year. Onboard edge computers from Nokia processed live video and sensor streams, detecting cargo-handling anomalies within seconds. ISO 19847 server guidelines are becoming standard bid requirements, ensuring redundancy and cybersecurity.
Regulatory Push for Fuel-Efficiency and Emissions Compliance
FuelEU Maritime forces ships calling at European ports to cut greenhouse-gas intensity by 2% in 2025 and 6% in 2030, escalating to 80% in 2050.[2]European Commission, “FuelEU Maritime Regulation,” ec.europa.eu IMO’s Carbon Intensity Indicator penalizes vessels that remain in the lowest two ratings for three consecutive years. Wartsila’s voyage-optimisation module saved a large container ship 9.2% in fuel during 2025, equal to USD 1.8 million at prevailing bunker prices. Analytics now integrates dual-fuel engine data, enabling algorithms to propose the cheapest, least-emitting mix available at the next port.
Growing Adoption of IoT and Vessel Connectivity
ABB Ability Marine Pilot logged data at one-second intervals from more than 1,200 ships by the end of 2025.[3]ABB, “Ability Marine Pilot Installations,” new.abb.com Kongsberg’s digital twin predicted bearing wear 14 days in advance, allowing operators to position spare parts before failure. Spire Global tracked 300,000 unique vessel identities via satellite AIS, offering charterers third-party verification of vessel routes. Edge gateways reduce satellite costs by filtering sensor streams on board, and IEC 61162 ensures that IoT devices do not interfere with bridge electronics.
Expansion in Seaborne Trade Volumes
Asia-Pacific ports handled 60% of global container traffic in 2025, and continued growth in intra-Asian trade is driving crane automation and berth-planning analytics. China’s Ministry of Transport requires major ports to install traffic management systems integrated with berth allocation algorithms, spurring deployments in Shanghai and Ningbo. The Nippon Foundation-backed autonomous feeder trials in Tokyo Bay rely on computer vision and route-optimisation software. These initiatives boost demand across the maritime analytics market, especially for platforms that couple port visibility with vessel ETA forecasting.
Restraints Impact Analysis
| Restraint | (~) % Impact on CAGR Forecast | Geographic Relevance | Impact Timeline |
|---|---|---|---|
| High Implementation and Integration Costs | -1.4% | Global, pressure greatest on smaller operators in emerging markets | Short term (≤2 years) |
| Limited Data Standardisation Across Legacy Systems | -1.1% | Global, particularly mixed-age fleets | Medium term (2-4 years) |
| Cyber-Security Vulnerabilities in Connected Vessels | -0.8% | Global, heightened in defense and offshore energy | Short term (≤2 years) |
| Shortage of Analytics-Skilled Maritime Workforce | -0.6% | North America and Europe, rising Asia-Pacific | Long term (≥4 years) |
| Source: Mordor Intelligence | |||
High Implementation and Integration Costs
Retrofitting a mid-size bulk carrier with sensors, edge servers, and broadband links can top USD 500,000, an outlay hard to justify for owners running on single-digit margins. Proprietary engine-management protocols from suppliers such as MAN Energy Solutions require custom middleware, inflating integration budgets. Smaller Asian and African operators often fly in European specialists at USD 2,000 per day, widening the digital divide. Subscription models from Prisma Electronics cut capital expense, but some owners remain wary of new recurring fees.
Limited Data Standardisation Across Legacy Systems
Ships built over the past quarter-century use diverse protocols from NMEA 0183 to vendor-specific CANbus, creating silos that slow fleet-wide analytics. ISO 19848 offers a common data model, yet refitting legacy systems to comply costs about USD 100,000 per vessel. Although cloud data lakes can normalize raw feeds, the compute overhead undermines sub-minute prescriptive maintenance. The Digital Container Shipping Association aims to harmonize data-sharing formats, but progress is slow because carriers guard operational KPIs.
Segment Analysis
By Application: Predictive Models Transform Maintenance Economics
Predictive and Prescriptive Maintenance is projected to expand at a 10.83% CAGR, the quickest pace among all applications in the maritime analytics market. Ship-owners are shifting budget from time-based overhauls to condition-based work, cutting maintenance costs by 20-30%. As a result, this slice of the maritime analytics market is growing faster than asset-tracking or route-planning tools. Fleet and Asset Management still held the highest 2025 revenue, with 33.46% of the maritime analytics market share, reflecting years of investment in vessel-tracking dashboards that have now reached near saturation in container and tanker fleets.
Voyage Optimisation solutions are gaining momentum because every 1% reduction in fuel consumption on a 10,000 TEU ship translates into roughly USD 200,000 in annual savings, strengthening their ROI case. Cargo and Supply-Chain Analytics is also climbing as e-commerce raises the premium on precise ETA forecasts. Safety and Compliance Analytics remains a niche but high-stakes field, automating International Safety Management reporting and helping charterers avoid vessels with poor inspection records. Collectively, these dynamics keep the overall application landscape fluid, with owners increasingly bundling multiple modules into one platform license.
Note: Segment shares of all individual segments available upon report purchase
By End-User: Terminals Accelerate Digital Spend
Commercial Shipping Lines commanded 42.67% of 2025 spending, the largest slice of the maritime analytics market size, because global liners view fuel- and schedule-driven insights as table stakes. Yet growth momentum is shifting to Ports and Terminal Operators, where a 10.64% CAGR is forecast through 2031. Automated berth-planning and crane-scheduling systems allow mega-terminals to turn vessels 30% faster, a gain that justifies rising analytics budgets and enlarges their share of the maritime analytics market.
Government and Defense agencies are scaling domain-awareness deployments that spot illegal fishing or sanctions evasion, while Offshore and Energy operators rely on analytics to schedule crew transfers and predict weather windows that govern turbine maintenance. Each cohort demands different data feeds: AIS, radar, or high-frequency weather, but they all require secure, real-time processing. Vendors that can segment feature sets and pricing by owner type will capture the broadest clientele.
By Deployment Mode: Hybrid Balances Latency and Scale
Cloud deployments accounted for 57.89% of 2025 installations because centralized compute simplifies fleet benchmarking and model training. However, the maritime analytics market size tied to Hybrid architectures is projected to expand at a 10.49% CAGR as operators move latency-sensitive tasks such as collision avoidance and dynamic positioning onboard, while leaving big-data crunching ashore. A ruggedized edge server now costs under USD 10,000, down from USD 25,000 in 2023, pushing hybrid adoption even among smaller owners.
On-prem deployments persist in defense and government segments, where data sovereignty rules prohibit commercial clouds. For commercial fleets, hybrid approaches also reduce satellite fees by filtering video and sensor streams locally and uploading only summaries. This architecture reduces the total cost of ownership while delivering sub-second response times, making it the preferred middle path for most new projects. As regulatory regimes such as the GDPR tighten crew data rules, hybrid models further protect sensitive information.
By Component: Services Bridge the Skills Gap
Software Platforms generated 63.44% of 2025 component revenue, but the services slice of the maritime analytics market size is on track to grow 10.07% through 2031. Integration projects often last several months because they must marry engine data with weather feeds and charter-party clauses, a complexity pushing owners toward system integrators and managed analytics contracts priced at USD 50,000-150,000 per vessel per year. Shortages of maritime-savvy data scientists reinforce demand for external expertise.
Training has become a standalone revenue stream, with digital-twin simulators now mandatory for engineers on many smart ships. Low-code dashboards are also emerging, enabling chief engineers to build custom alerts without advanced programming, reducing reliance on scarce talent. Vendors that combine platform licenses with structured training and lifecycle support hold an advantage, especially among mid-size fleets without dedicated IT departments.
By Analytics Type: Prescriptive Systems Deliver Actionable Guidance
Descriptive dashboards still commanded 46.71% of 2025 spending and remain the entry point for most owners because they meet basic reporting mandates. Yet the prescriptive slice of the maritime analytics market share is forecast to grow at a 10.22% CAGR, the fastest within this category, as operators pursue software that not only predicts events but also suggests the optimal response. Predictive systems that alert crews two weeks before a bearing failure serve as a stepping stone toward prescriptive decision support.
Optimization engines now weigh speed, weather, emissions, and charter-party clauses before recommending a route and quantifying the benefit, a capability that converts data into dollar savings. Classification societies are drafting guidelines to certify these AI-based tools, improving user confidence and accelerating uptake. Over time, data gathered by descriptive modules will continue to feed training pipelines for predictive and prescriptive models, ensuring that all three analytics types remain interdependent in the maritime analytics market.
Geography Analysis
Europe contributed 28.74% of the 2025 maritime analytics market share, the largest regional slice of the maritime analytics market size, because vessel owners must purchase European Union Emissions Trading System allowances that rise to 100% coverage in 2026, adding roughly USD 1.5 million in annual carbon cost to a large container ship. Operators respond by deploying voyage-optimization and fuel-blend algorithms that lower greenhouse-gas intensity enough to reduce allowance purchases. The United Kingdom Maritime and Coastguard Agency reinforced software demand by requiring electronic submissions of fuel-consumption and Carbon Intensity Indicator data through its digital portal starting in 2025. These overlapping regulations keep Europe at the forefront of fleet digitization, with several Scandinavian carriers now budgeting analytics spending as a recurring operating expense rather than discretionary IT outlays.
Asia-Pacific is forecast to expand at a 10.87% CAGR from 2026-2031, the fastest regional pace, as smart-port mandates and autonomous-shipping trials create new procurement cycles. China’s Ministry of Transport ordered every port handling more than 10 million tonnes annually to integrate vessel-traffic management and berth-allocation analytics by year-end 2025, catalyzing large contracts in Shanghai, Ningbo, and Shenzhen. Japan’s Nippon Foundation funded autonomous feeder trials in Tokyo Bay that rely on sensor fusion and route-planning algorithms to navigate congested waters without human input, aiming to deploy for commercial service in 2027. South Korean yards bundle digital-twin software with newbuild deliveries so ship-owners avoid retrofit hassles, accelerating adoption among early adopters. Regional governments actively subsidize 5G coastal coverage and satellite-backhaul upgrades, helping small and medium operators justify analytics subscriptions.
North America and the Middle East show steady but slower uptake as coast guards invest in domain-awareness platforms that monitor exclusive economic zones for illegal fishing and sanctions evasion. South America and Africa remain emerging markets; Brazil’s Port of Santos is piloting predictive berth-allocation software to cut average vessel wait time from 18 hours to under 12 hours, but most regional ports still lack the fiber connectivity needed to support real-time dashboards. The maritime analytics market size in these regions remains below 5% because fragmented ownership structures and limited capital budgets slow procurement cycles. Nonetheless, multilateral lenders are funding port-modernization programs that include sensor networks and edge-computing hardware, laying the groundwork for faster adoption after 2028.
Competitive Landscape
The market remains moderately concentrated, with ABB, Kongsberg, and Wartsila together accounting for a little over 60% of total revenue, a position they reinforce by bundling analytics modules with their installed propulsion, navigation, and automation hardware. ABB’s Ability Marine Pilot surpassed 1,200 vessel installations by late 2025, cumulatively avoiding 500,000 t of CO₂-equivalent emissions and helping the firm win repeat-license deals. Kongsberg accelerated its autonomous-shipping roadmap through the 2024 purchase of Massterly AS, combining sensor suites with remote-operations software that requires comprehensive data analytics back ends. Wärtsilä integrated Eniram’s algorithms into its engine-control stack, offering an end-to-end platform spanning predictive maintenance, route planning, and fuel-blend optimization.
Specialized software vendors capture white-space opportunities by targeting discrete use cases. Nautilus Labs focuses on prescriptive voyage optimization, claiming bunker savings of 8-12% per voyage; Windward delivers sanctions-screening analytics that help charterers avoid USD 10 million compliance fines; and Xeneta mines 300 million freight-rate datapoints annually to guide shippers’ booking strategies. Orca AI raised USD 72.5 million in December 2025 to scale collision-avoidance AI to 500 ships by 2026, signaling venture confidence that niche applications can earn premium margins. These firms win contracts by offering cloud-native deployments, rapid iteration, and subscription pricing that aligns with operators’ operating expense models.
Patent activity underscores the competitive stakes. The European Patent Office lists more than 200 active filings on condition-based monitoring algorithms held by ABB, Siemens, and Rolls-Royce Marine, while start-ups focus on computer vision and reinforcement learning patents. Cybersecurity has become a key differentiator as owners demand ISO 27001 audits and proof of IMO cyber-risk compliance before awarding contracts. Connectivity providers such as Onomondo and Viasat join the fray by bundling global IoT SIMs and high-throughput satellite service with analytics subscriptions, further blurring the line between telecom and software. Overall, vendor success hinges on combining maritime domain expertise with scalable cloud-edge architectures, a formula that is reshaping competitive boundaries across the maritime analytics market.
Maritime Analytics Industry Leaders
ABB Ltd.
Prisma Electronics S.A.
SparkCognition, Inc.
Spire Global, Inc.
Windward Ltd.
- *Disclaimer: Major Players sorted in no particular order
Recent Industry Developments
- January 2026: Kongsberg Digital partnered with Microsoft Azure to install edge-computing hardware on 300 European liner vessels, targeting a 25% cut in unscheduled downtime.
- December 2025: Orca AI closed a USD 72.5 million Series B round led by Mizmaa Ventures to expand collision-avoidance AI to 500 vessels by end-2026.
- November 2025: A.P. Moller-Maersk finished rolling out the OneWireless connectivity platform on 450 ships, a move expected to save USD 30 million annually in maintenance costs.
- October 2025: Wartsila acquired Eniram Oy, integrating fuel-efficiency algorithms with its engine-control suite.
Global Maritime Analytics Market Report Scope
The Maritime Analytics Market Report is Segmented by Application (Predictive and Prescriptive Maintenance, Voyage Optimisation and Route Planning, Fleet and Asset Management, Cargo and Supply-Chain Analytics, Safety and Compliance Analytics), End-User (Commercial Shipping Lines, Government and Defense, Ports and Terminal Operators, Offshore and Energy), Deployment Mode (Cloud, On-premise, Hybrid), Component (Software Platform, and Services), Analytics Type (Descriptive Analytics, Predictive Analytics, Prescriptive Analytics), and Geography (North America, South America, Europe, Asia-Pacific, Middle East and Africa). The Market Forecasts are Provided in Terms of Value (USD).
| Predictive and Prescriptive Maintenance |
| Voyage Optimisation and Route Planning |
| Fleet and Asset Management |
| Cargo and Supply-Chain Analytics |
| Safety and Compliance Analytics |
| Commercial Shipping Lines |
| Government and Defense |
| Ports and Terminal Operators |
| Offshore and Energy |
| Cloud |
| On-premise |
| Hybrid |
| Software Platform |
| Services |
| Descriptive Analytics |
| Predictive Analytics |
| Prescriptive Analytics |
| North America | United States | |
| Canada | ||
| Mexico | ||
| South America | Brazil | |
| Argentina | ||
| Rest of South America | ||
| Europe | United Kingdom | |
| Germany | ||
| France | ||
| Italy | ||
| Rest of Europe | ||
| Asia Pacific | China | |
| Japan | ||
| India | ||
| South Korea | ||
| Rest of Asia Pacific | ||
| Middle East and Africa | Middle East | United Arab Emirates |
| Saudi Arabia | ||
| Rest of Middle East | ||
| Africa | South Africa | |
| Egypt | ||
| Rest of Africa | ||
| By Application | Predictive and Prescriptive Maintenance | ||
| Voyage Optimisation and Route Planning | |||
| Fleet and Asset Management | |||
| Cargo and Supply-Chain Analytics | |||
| Safety and Compliance Analytics | |||
| By End-User | Commercial Shipping Lines | ||
| Government and Defense | |||
| Ports and Terminal Operators | |||
| Offshore and Energy | |||
| By Deployment Mode | Cloud | ||
| On-premise | |||
| Hybrid | |||
| By Component | Software Platform | ||
| Services | |||
| By Analytics Type | Descriptive Analytics | ||
| Predictive Analytics | |||
| Prescriptive Analytics | |||
| By Geography | North America | United States | |
| Canada | |||
| Mexico | |||
| South America | Brazil | ||
| Argentina | |||
| Rest of South America | |||
| Europe | United Kingdom | ||
| Germany | |||
| France | |||
| Italy | |||
| Rest of Europe | |||
| Asia Pacific | China | ||
| Japan | |||
| India | |||
| South Korea | |||
| Rest of Asia Pacific | |||
| Middle East and Africa | Middle East | United Arab Emirates | |
| Saudi Arabia | |||
| Rest of Middle East | |||
| Africa | South Africa | ||
| Egypt | |||
| Rest of Africa | |||
Key Questions Answered in the Report
What is the projected revenue of maritime analytics by 2031?
Spending is forecast to reach USD 2.59 billion by 2031, expanding from USD 1.62 billion in 2026.
How fast is maritime analytics expected to grow during 2026-2031?
The compound annual growth rate is projected at 9.84% across that six-year span.
Which application area is gaining adoption most rapidly?
Predictive and Prescriptive Maintenance is advancing at a 10.83% CAGR, outpacing asset-tracking and voyage-planning tools.
Why are hybrid cloud-edge deployments becoming popular?
They let ships run latency-sensitive algorithms on board while training models ashore, cutting satellite bandwidth costs and boosting real-time safety functions.
Which region is likely to post the fastest growth to 2031?
Asia-Pacific is set to expand at a 10.87% CAGR, driven by China’s smart-port rollouts and autonomous-shipping pilots in Japan.
What return on investment can owners expect from voyage-optimization analytics?
Case studies show bunker savings of 8–12% per voyage, often paying back the software license within 12–18 months.


