
Marine Propeller Market Size and Share
Market Overview
| Study Period | 2019 - 2031 |
|---|---|
| Market Size (2026) | USD 4.78 Billion |
| Market Size (2031) | USD 6.57 Billion |
| Growth Rate (2026 - 2031) | 6.60 % |
| Fastest Growing Market | Asia Pacific |
| Largest Market | Asia Pacific |
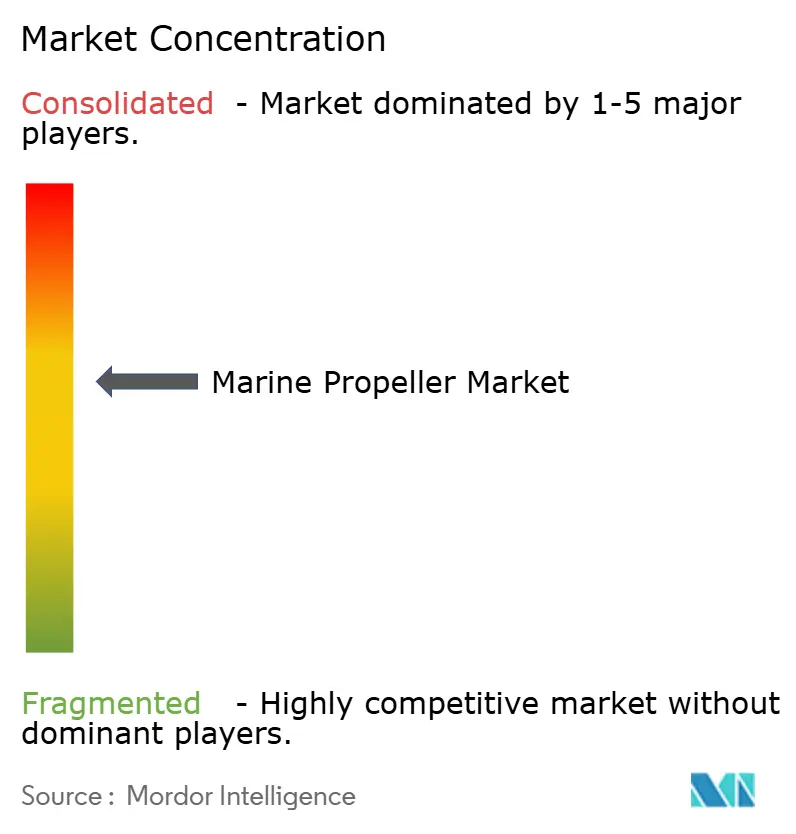
| Market Concentration | Medium |
Major Players *Disclaimer: Major Players sorted in no particular order Image © Mordor Intelligence. Reuse requires attribution under CC BY 4.0. | |
Marine Propeller Market Analysis by Mordor Intelligence
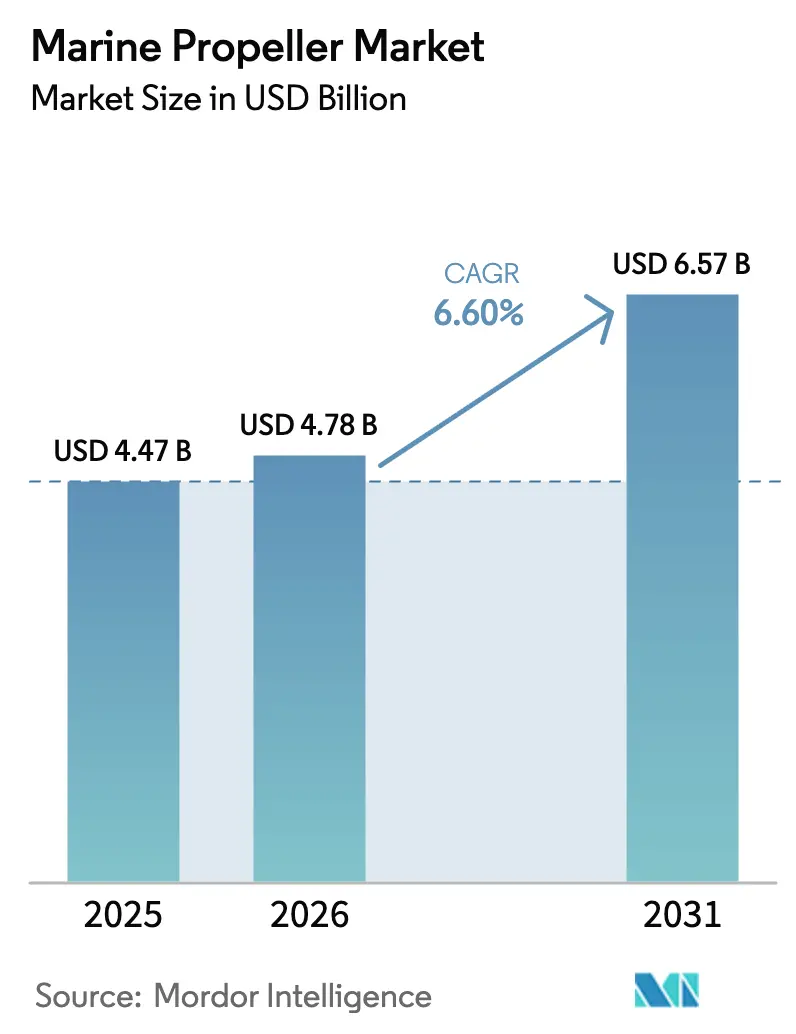
The marine propeller market size is expected to grow from USD 4.47 billion in 2025 to USD 4.78 billion in 2026 and is forecast to reach USD 6.57 billion by 2031, growing at a CAGR of 6.60% during the forecast period (2026-2031). Owners are upgrading propulsion systems, driven by tighter IMO Energy Efficiency Existing Ship Index (EEXI) and Carbon Intensity Indicator (CII) rules.[1]International Maritime Organization, “EEXI and CII measures enter into force,” imo.org While cost pressures from volatile nickel-aluminum bronze and composite feedstocks are squeezing margins, the urgency for retrofitting keeps order books robust, even as new-build cycles show signs of softening. Integrated propulsion suppliers, which merge propellers with digital twin design tools, are now directly competing with traditional specialists, marking a significant industry shift toward comprehensive efficiency solutions.
Key Report Takeaways
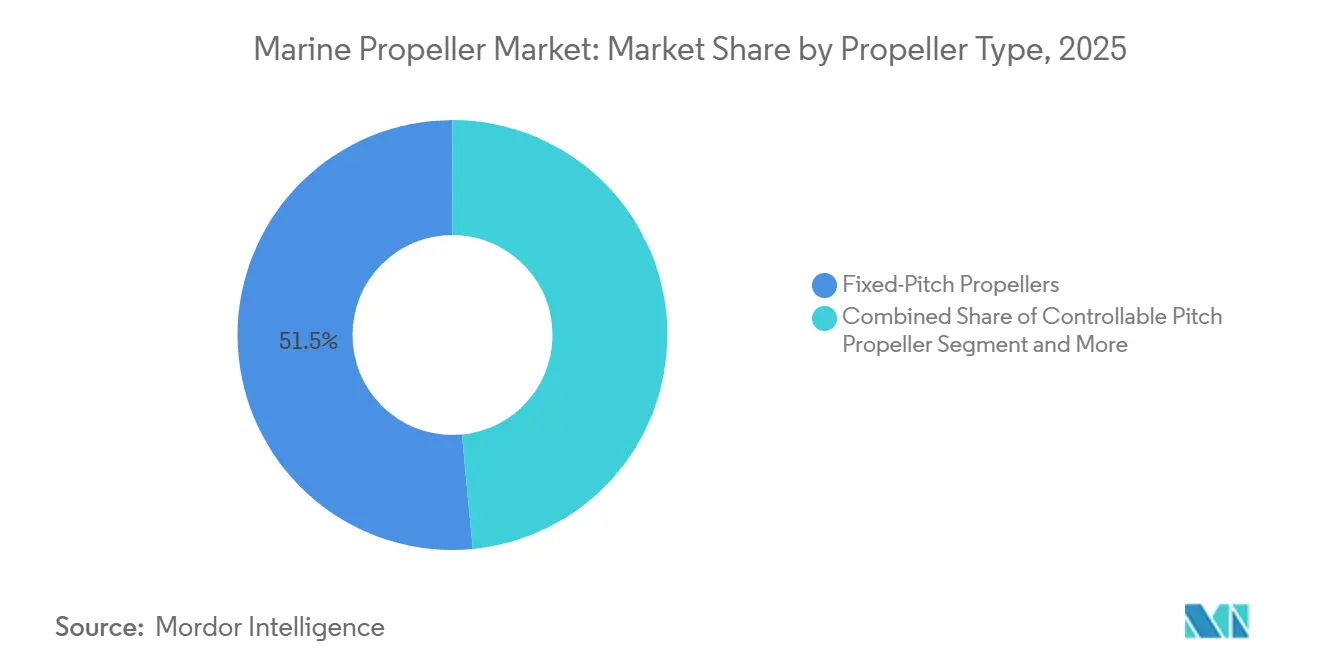
- By propeller type, fixed-pitch designs retained 51.50% of the marine propeller market share in 2025, while controllable-pitch units are projected to clock the fastest 6.70% CAGR through 2031.
- By number of blades, four-blade configurations led the marine propeller market with 39.30% of the market share in 2025; five-blade propellers are forecast to expand at a 6.06% CAGR through 2031.
- By material, nickel-aluminum bronze accounted for 43.60% of the marine propeller market in 2025; composite propellers are set to grow at a 10.50% CAGR through 2031.
- By propulsion system, inboard arrangements contributed 57.70% of the marine propeller market share in 2025, whereas electric pod systems registered the highest 11.80% CAGR through 2031.
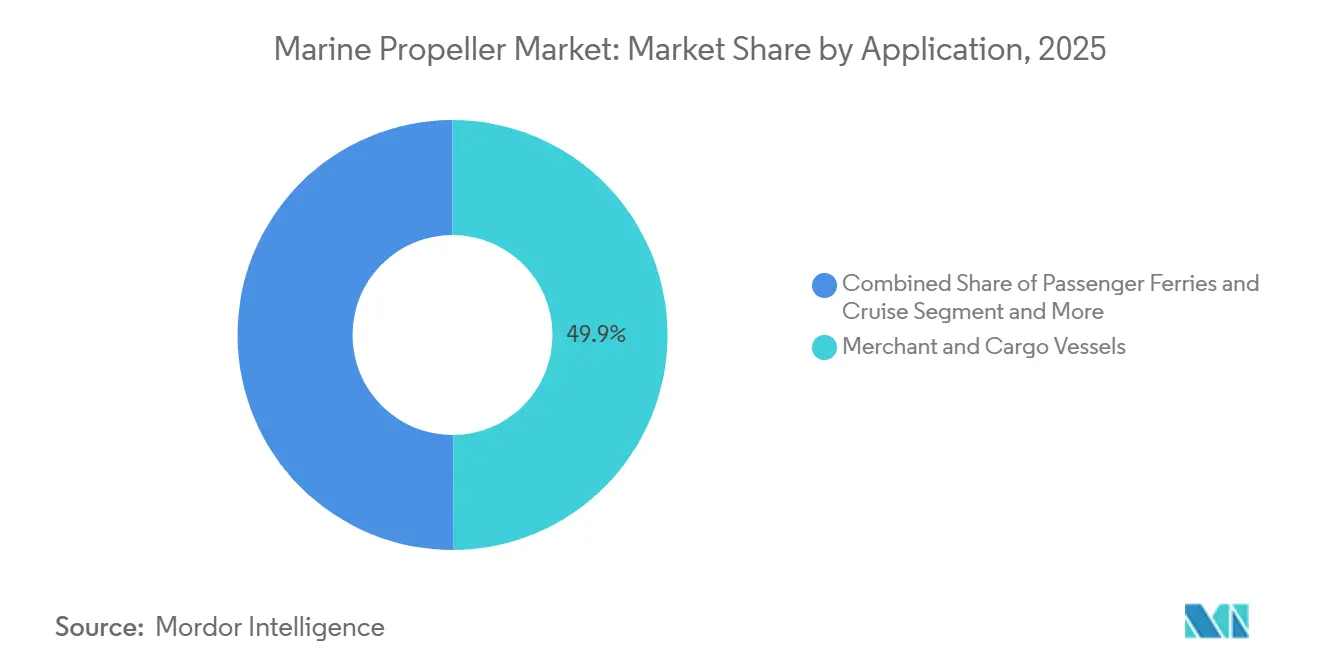
- By application, merchant and cargo vessels commanded a 49.90% share of the marine propeller market in 2025, while offshore support vessels are advancing at an 8.50% CAGR through 2031.
- By sales channel, OEM deliveries accounted for 73.20% of the marine propeller market share in 2025; the aftermarket is growing fastest at an 8.70% CAGR through 2031.
- By geography, Asia-Pacific captured 43.70% of the marine propeller market share in 2025, and is poised for the quickest 6.76% CAGR through 2031.
Note: Market size and forecast figures in this report are generated using Mordor Intelligence’s proprietary estimation framework, updated with the latest available data and insights as of January 2026.
Global Marine Propeller Market Trends and Insights
Drivers Impact Analysis*
| Driver | (~) % Impact on CAGR Forecast | Geographic Relevance | Impact Timeline |
|---|---|---|---|
| IMO EEXI and CII Efficiency Mandates | +1.2% | Global | Short term (≤ 2 years) |
| Expansion of Global Shipbuilding Capacity | +0.8% | Asia-Pacific core, spill-over to global | Medium term (2-4 years) |
| Accelerating Ferry Electrification Projects | +0.6% | North America and EU, expanding to Asia-Pacific | Medium term (2-4 years) |
| Surging Offshore-Wind Vessel Orders | +0.5% | Europe and North America, emerging in Asia-Pacific | Long term (≥ 4 years) |
| Retro-Fit Demand to Meet Underwater-Noise Limits | +0.4% | Global, concentrated in naval regions | Short term (≤ 2 years) |
| Adoption of AI-Driven Digital-Twin Hydrodynamic Design Tools | +0.3% | Global, led by advanced shipbuilding nations | Long term (≥ 4 years) |
| Source: Mordor Intelligence | |||
IMO EEXI and CII Efficiency Mandates
International Maritime Organization rules require annual carbon-intensity improvements, prompting roughly 13,500 ships to contemplate controllable-pitch retrofits, power limitations, or auxiliary upgrades. Only 27 shipyards can handle large-scale propeller work, resulting in an 18-month backlog that is prompting operators to consider modular blade systems assembled at quayside. Because controllable-pitch props allow for blade-angle changes while underway, operators can fine-tune thrust without docking, thereby preserving schedules while meeting compliance targets. Foundries that furnish mobile machining units and accelerated casting cycles are capturing retrofit orders ahead of the 2027 and 2030 audit milestones. As a result, the marine propeller market benefits from a sustained multi-year retrofit pipeline.
Expansion of Global Shipbuilding Capacity in China and South Korea
Hengli Group invested CNY 9.2 billion (USD 1.25 billion) in 2025 to enlarge its Dalian complex for ultra-large container and LNG vessels, each demanding propellers exceeding 10 meters. South Korean leaders Hyundai Heavy Industries and Samsung Heavy Industries continue to dominate premium gas-carrier and naval work, where nickel-aluminum bronze castings withstand cavitation pressures exceeding 3 MPa. These programs integrate controllable-pitch hubs, shaft generators, and hybrid power-take-off modules into single procurement packages, anchoring customers to long-term service deals. Unless European and North American foundries target niches such as composite surface-piercing blades for high-speed ferries, they risk a commodity squeeze.
Accelerating Ferry Electrification Projects
ABB’s Azipod system propels the Tycho Brahe and Aurora ferries with 4,160 kWh batteries, enabling emission-free sailings across the Øresund Strait. Wärtsilä has won 2025 contracts for two battery-electric ferries for Molslinjen, which feature twin azimuth thrusters designed for regenerative braking during docking. Electric drives eliminate gearboxes and allow variable motor speeds, but they also impose tight blade-tip clearances to avoid sensor interference. Shore-power gaps in smaller ports remain a hurdle. Yet, integrated motor-pod-propeller solutions give suppliers a first-mover advantage as electrification moves from Scandinavia toward Mediterranean and Asian shuttle routes.
Surging Offshore-Wind Vessel Orders
DEME’s Norse Wind, delivered in 2025, carries a 3,200-ton crane and dynamic-positioning systems that hold to within 0.5 meters in 2-meter waves using twin azimuth thrusters. Damen’s FLOW-SV design utilizes contra-rotating propellers that recover rotational energy while reducing fuel consumption. As global offshore wind targets aim for 500 GW by 2030, operators prioritize low-noise, ducted propellers that mitigate marine mammal disturbance. Patent portfolios centered on blade skew and composite hubs position Schottel and Rolls-Royce to capitalize on this acoustic imperative.
Restraints Impact Analysis*
| Restraint | (~) % Impact on CAGR Forecast | Geographic Relevance | Impact Timeline |
|---|---|---|---|
| High Raw-Material Price Volatility | -0.7% | Global, acute in supply-constrained regions | Short term (≤ 2 years) |
| Stringent Bio-Fouling/Anti-Cavitation Certification Costs | -0.4% | Global, concentrated in regulated markets | Medium term (2-4 years) |
| Short-Term Ship-Owner Cap-Ex Freeze | -0.3% | Global, acute in cyclical shipping markets | Short term (≤ 2 years) |
| Limited Dry-Dock Slots | -0.2% | Global, concentrated in major shipyard regions | Medium term (2-4 years) |
| Source: Mordor Intelligence | |||
High Raw-Material Price Volatility
Nickel prices swung between USD 16,000 and USD 24,000 per metric ton during 2024-2025, eroding foundry margins by up to 300 basis points. Carbon-fiber-reinforced polymer blades remain 40-60% more expensive than bronze because the aerospace and automotive sectors compete for prepreg supply. Sellers are exploring aluminum-silicon-magnesium alloys, yet fatigue limits their use in tugboats. Scrap-metal recycling and long-term nickel contracts are surfacing as hedges.
Stringent Bio-Fouling/Anti-Cavitation Certification Costs
ISO 19030 requires continuous performance monitoring, which involves adding USD 50,000-150,000 worth of sensors per vessel. New anti-fouling coatings must clear IMO field trials across multiple climates, pushing R&D spending to USD 2-5 million. Smaller foundries struggle to finance these tests and lean on coatings majors, shrinking their bargaining power within the marine propeller market.
*Our forecasts treat driver/restraint impacts as directional, not additive. The impact forecasts reflect baseline growth, mix effects, and variable interactions.
Segment Analysis
By Propeller Type: Controllable-Pitch Gains on Retrofit Wave
Fixed-pitch propellers accounted for 51.50% of the marine propeller market share in 2025, driven by their lower upfront cost, typically 30 to 40% below controllable-pitch equivalents, and simpler maintenance requirements, which appeal to bulk-carrier and tanker operators prioritizing capital efficiency over fuel optimization. Controllable-pitch propellers are forecast to grow at a 6.70% CAGR through 2031. Azimuth and podded propellers are carving a share in offshore-support and cruise segments, where dynamic positioning and tight-radius maneuvering justify the 50 to 70% price premium; ABB's Azipod units now power over 100 cruise ships globally, with each installation delivering approximately 10% fuel savings versus fixed-pitch shaft-line configurations.
Contra-rotating propellers, which mount two propellers on concentric shafts to cancel torque and recover rotational energy, remain a niche technology, with a market share of under 3%, due to mechanical complexity and higher failure rates in debris-laden waters. Ducted or Kort-nozzle propellers command steady demand in tugboats and inland-waterway vessels, where the shroud boosts static thrust by 25 to 35% at low speeds, though hydrodynamic losses above 12 knots limit adoption in open-ocean trades. Surface-piercing propellers, used in high-speed ferries and military patrol craft, are growing modestly as composite materials reduce weight and enable blade profiles that minimize spray and ventilation losses.


By Number of Blades: Five-Blade Configurations Reduce Noise Signatures
Four-blade propellers held 39.30% of the marine propeller market share in 2025; however, five-blade models outgrew them at a 6.06% CAGR through 2031, offering lower vibration and cavitation while preserving thrust. Rolls-Royce's Adjustable Bolted Propeller on HMS Queen Elizabeth features five blades spanning 6.7 meters in diameter, with each blade individually replaceable, extending the service life beyond 25 years.
Computational fluid dynamics simulations now enable foundries to optimize blade count and skew angle for specific hull forms and operating profiles, moving the industry away from catalog offerings toward application-engineered solutions. Nakashima Propeller's variable-pitch five-blade design, launched in 2024, adjusts blade angle hydraulically to maintain constant shaft speed across varying sea states, reducing engine wear and fuel consumption by approximately 4% on container feeders operating in the Asia-Pacific short-sea trades.
By Material: Composites Surge on Weight and Noise Benefits
Nickel-aluminum bronze held a 43.60% share of the marine propeller market in 2025, but composite propellers are projected to expand at a 10.50% CAGR through 2031. Stainless steel remains the material of choice for high-performance yachts and military patrol craft, offering superior strength-to-weight ratios and corrosion resistance in tropical waters. However, raw material costs are approximately 50% higher than bronze, limiting broader adoption.
Aluminum propellers serve niche roles in inland-waterway and shallow-draft vessels, where reduced weight lowers draft and permits operation in channels with depths of less than 2 meters. However, aluminum's lower fatigue resistance restricts its use to low-thrust applications with a power output of less than 500 kilowatts. Carbon-fiber-reinforced polymers are advancing beyond prototypes as resin suppliers develop epoxy matrices that withstand continuous immersion and impact loading; Sharrow Marine's composite propeller, featuring a looped blade geometry that eliminates tip vortices, achieved 9% fuel savings in independent trials on a 40-foot sportfishing boat.
By Propulsion System: Electric Pods Reshape Ferry and Cruise Segments
Inboard shafts accounted for 57.70% of the marine propeller market share in 2025, yet electric pod systems posted an 11.80% CAGR through 2031, the highest among all propulsion categories. Outboard propulsion dominates recreational craft under 10 meters, with Brunswick's Mercury Marine holding a leading position through its aluminum and stainless-steel propeller lines optimized for gasoline and diesel outboards.
Sterndrive units, which combine inboard engines with outboard lower units, serve the performance-boat segment where operators prioritize shallow-water capability and trailering convenience over fuel efficiency. ABB's Azipod units, which integrate electric motors directly into the pod housing, eliminate gearbox losses and enable 360-degree thrust vectoring for dynamic positioning. The company delivered 12 Azipod installations in 2025 for cruise ships and offshore support vessels, each rated between 5 and 20 megawatts.
By Application: Offshore Support Vessels Lead Growth Amid Wind-Farm Boom
Merchant and cargo vessels generated 49.90% of the marine propeller market share in 2025, yet offshore-support and tugboats register the fastest 8.5% CAGR through 2031, as floating wind projects proliferate.
Recreational and leisure boats are recovering from pandemic-era supply chain disruptions, with outboard propeller sales rebounding as the availability of aluminum and stainless steel feedstock normalizes. Inland-waterway vessels, which operate in rivers and canals with depth restrictions of less than 3 meters, favor ducted propellers that maximize static thrust at low speeds.
However, this segment remains price-sensitive and concentrated among regional foundries in Europe and Asia. Passenger ferries act as test beds for zero-emission and low-noise innovations, while inland barges prioritise shallow-draft propellers that avoid riverbed contact. Leisure craft benefits from quieter composite outboards, mirroring automotive consumer expectations for silent running.[2]ABS, “Future of offshore Support Vessels,”eagle.org
By Sales Channel: Aftermarket Resilience Amid Newbuild Slowdown
OEM sales accounted for 73.20% of the marine propeller market share in 2025. Still, retrofit activity grew more quickly at an 8.70% CAGR through 2031, as ship owners defer capital expenditures amid freight-rate uncertainty.
Mobile machining services, where technicians perform blade polishing and minor repairs afloat, are gaining traction as dry-dock slot availability tightens; Lloyd's Register estimates that only 27 yards globally can handle propeller retrofits on vessels exceeding 100,000 deadweight tons, pushing lead times beyond 18 months. Aftermarket channels also benefit from regulatory retrofits driven by IMO EEXI and underwater-noise mandates, as operators replace fixed-pitch propellers with controllable-pitch variants or upgrade blade materials to reduce cavitation. Rolls-Royce's modular Adjustable Bolted Propeller design, which allows individual blade replacement without removing the hub, is accelerating aftermarket penetration in naval fleets where operational availability is paramount.
Geography Analysis
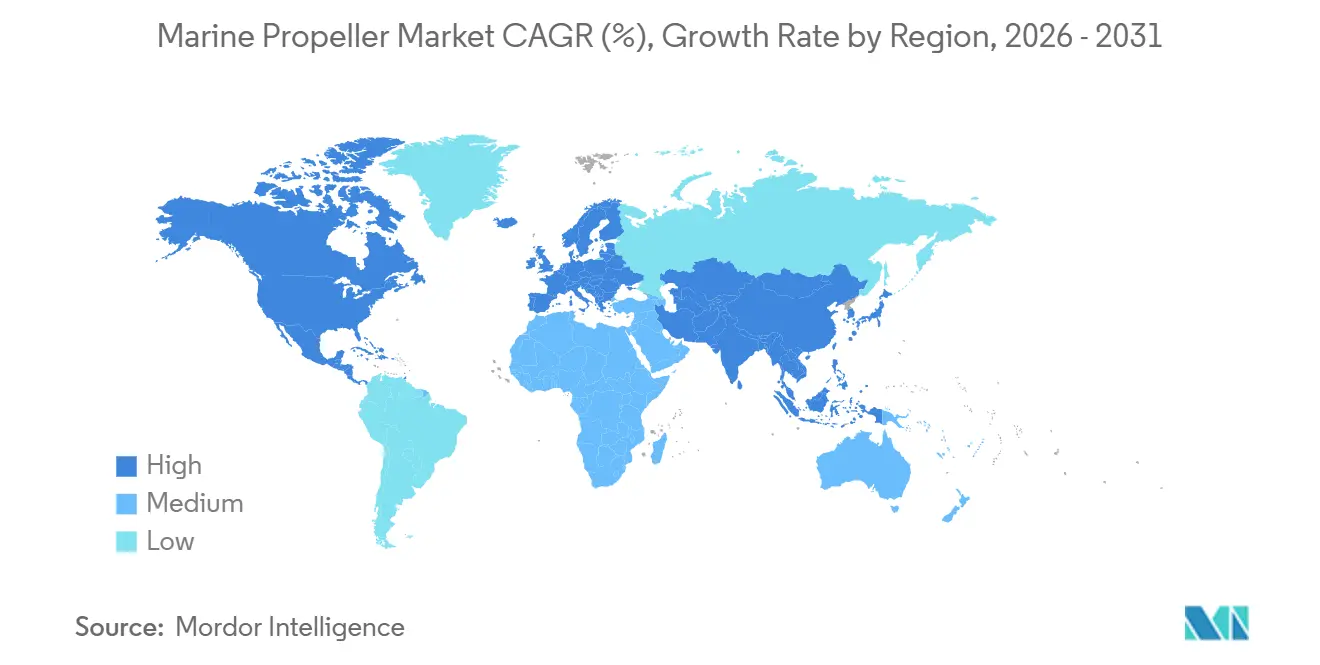
Asia-Pacific remains the world’s largest hub for propeller demand, with 43.70% of the marine propeller market share in 2025 and expected to grow at 6.76% between 2026 and 2031. China’s CNY 9.2 billion (USD 1.25 billion) Dalian expansion targets ultra-large container vessels with 10-meter bronze propellers. South Korea still commands high-margin LNG and naval work, with propellers facing cavitation pressures above 3 MPa. Japan’s Nakashima couples controllable-pitch expertise with domestic yard tie-ups, and India’s USD 2.8 billion Maritime Development Fund backs shallow-draft projects on inland waterways. Dry-dock queues remain the primary headwind, although mobile machining offers partial relief.
Europe drives electrification. ABB’s Azipod ferries Tycho Brahe and Aurora operate on 4,160 kWh packs, removing 65,000 tCO₂ annually per ship. Wärtsilä will supply twin azimuth thrusters to Denmark’s new battery ferries due in 2027-2028. The EU’s 2030 noise rules push five- and six-blade swept designs. Offshore wind vessels in the North Sea and Baltic adopt low-noise azimuth thrusters, while congestion in Rotterdam and Hamburg forces diversions to yards in Turkey or the United Arab Emirates, inflating retrofit costs.
North America rebounds in leisure boating as Brunswick restores stainless-steel propeller supply. The United States Navy validated a 720-hour endurance for electric-drive unmanned craft, signaling the defense sector's adoption of pods. South America’s coastal ferries prioritize fixed-pitch affordability, whereas Gulf Cooperation Council offshore projects adopt dynamic-positioning thrusters; Kongsberg azimuth units on Rem Offshore vessels illustrate this trend.

Regulatory Landscape
Marine propeller demand is being shaped by emissions and energy-efficiency rules that link in-service performance to vessel compliance status. The IMO EEXI and CII framework is a central trigger for propeller retrofits and upgrades aimed at lowering fuel consumption and improving operational carbon intensity scores, pushing shipowners toward controllable-pitch propellers, optimized blade geometries, and efficiency devices. Alongside this, the European Union put FuelEU Maritime (Regulation (EU) 2023/1805) into force in January 2025, establishing greenhouse-gas intensity reduction requirements for onboard energy use, which increases the value of propulsion-efficiency improvements and data-backed performance documentation.
Regulatory updates in 2026 further reinforce the shift toward monitored, compliant propulsion systems. In April 2026, the UK Maritime and Coastguard Agency issued Marine Guidance Note MGN 717 on air-quality related amendments to mandatory international instruments such as MARPOL Annex VI, while the IMO NOx Technical Code amendments (Resolution MEPC.398(83)) are scheduled to enter into force on 1 September 2026, tightening the emissions compliance environment for marine engines. In parallel, the California Air Resources Board has compliance dates through 2026 for parts of its Commercial Harbor Craft framework, which is sharpening demand for integrated propulsion solutions and compatible component upgrades in regulated coastal operations.
Value Chain Analysis
The value chain starts with upstream metals and materials (notably copper and nickel inputs for nickel-aluminum bronze, plus carbon-fiber and resin systems for composite blades), followed by hydrodynamic design and simulation, pattern and mold making, casting or advanced fabrication, precision machining (often 5-axis), and finishing processes such as polishing and coating to manage cavitation and fouling. OEM procurement is tied to shipyard build schedules and integrated propulsion packages, while aftermarket demand depends on dry-dock availability, mobile machining capabilities, and class-compliant refurbishment cycles that extend propeller life. A growing share of differentiation is shifting into digital design workflows (CFD and digital-twin tools), sensor-enabled monitoring, and service contracts that combine performance verification with maintenance.
Midstream production is constrained by capital-intensive foundry infrastructure, skilled labor needs (metallurgy, pattern making, and machining), and the logistics of transporting large castings, which encourages regionalization near major shipbuilding clusters in Asia. Consolidation and footprint expansion are also visible: Fairbanks Morse Defense completed the acquisition of Rolls-Royce Naval Propulsors and Handling in July 2025, integrating facilities in Pascagoula and Walpole, and Nakashima Marine Propulsion expanded its European presence by acquiring the European business of Michigan Wheel, including United Kingdom operations, in April 2025. These steps are strengthening localized manufacturing and service capability, particularly for naval-grade and high-spec propeller programs where controlled alloy production, certification, and lead-time management are central.
Competitive Landscape
The top five players collectively hold a substantial market share. Margin pressure from nickel volatility and dry-dock scarcity is prompting majors to adopt lifecycle contracts that bundle hardware, coatings, and predictive analytics. Wärtsilä’s Fleet Operations Solution and Rolls-Royce’s Intelligent Asset Management exemplify this shift, recovering 3% fuel via data-guided blade maintenance. Composite technology is the next battleground: Sharrow Marine’s looped-blade geometry delivers 9% fuel savings in independent trials, forcing incumbents to accelerate CFD-driven designs.
M&A activity underlines this shift. Fairbanks Morse Defense acquired Rolls-Royce’s Naval Propulsors & Handling unit in 2024 to secure its only United States facility capable of casting large Navy-grade propellers. The deal reflects the rising geopolitical emphasis on localized manufacture and controlled alloy production.[3]Fairbanks Morse Defense, “Fairbanks Morse Defense Completes Acquisition of Rolls-Royce Naval Propulsors & Handling,” fairbanksmorsedefense.com
Patent filings related to digital-twin modeling and composite hubs are increasing, particularly from Rolls-Royce and Schottel, which target upcoming EU acoustic regulations. Smaller foundries lacking funds for USD 2-5 million bio-fouling trials risk exit or acquisition, consolidating share toward vertically integrated conglomerates capable of amortizing certification expenses.
Marine Propeller Industry Leaders
Wärtsilä Oyj Abp
Schottel GmbH
HD Hyundai Heavy Industries Co., Ltd.
MITSUBISHI HEAVY INDUSTRIES, LTD.
Nakashima Propeller Co., Ltd.
- *Disclaimer: Major Players sorted in no particular order

Market Opportunities and Future Outlook
Compliance-driven efficiency upgrades are creating room for solutions that pair hydrodynamic improvements with verifiable performance and easier installation, particularly where dry-dock capacity remains tight. The retrofit bottleneck in the market context (limited global yards capable of large-vessel propeller work and long queues) supports opportunities for modular blade concepts, quayside-capable service models, and materials or coatings that help maintain surface condition for longer between dockings. The 2026 manufacturing evidence in the market context also points to alternative production routes that can complement traditional casting, as the Digitally Enabled Efficient Propeller (D.E.E.P) project reported completion of a wire arc additive manufacturing (WAAM) prototype section for a nickel-aluminum bronze propeller blade under a consortium led by Enki Marine.
Product performance and durability pathways are also widening, especially for cavitation and smoothness retention, which influence fuel burn and noise. In June 2026, GIT Coatings launched XGIT-Vortex, a multi-layer graphene-based propeller coating system positioned around long-term surface smoothness and cavitation-stress resistance, supporting aftermarket adoption where operators want measurable efficiency preservation. On propulsion architecture, efficiency-focused configurations such as contra-rotating systems are being commercialized into packaged offerings, including Veth Propulsion by Twin Disc unveiling its Streamline-CRP contra-rotating propulsion system in June 2026, which aligns with the report trend toward integrated propulsion solutions that bundle propulsors with controls and service support.
Recent Industry Developments
- July 2026: Wärtsilä announced it was selected to supply propulsion solutions, including controllable-pitch propellers and remote control systems, for Grimaldi Group's nine newbuild ferry vessels. The award reinforces OEM demand for integrated propulsion packages tied to efficiency and compliance needs, while also expanding the installed base for lifecycle service and digital performance support.
- May 2026: Schottel secured a contract to supply SRP 460 LE RudderPropellers for two 20,000 cbm LNG bunkering vessels under construction at Jiangnan Shipyard in China. The win extends Schottel's footprint in specialized gas-related support tonnage, where maneuverability, reliability, and propulsion-package integration influence vessel operability and charter acceptance.
- July 2025: HD Hyundai Heavy Industries secured a patent for controllable-pitch propeller technology designed to enable a 5% to 15% downsizing of the propeller hub. This development focuses on hydrodynamic and mechanical optimization that can translate into fuel-efficiency gains, and it supports differentiated CPP offerings as shipowners prioritize propulsion upgrades under tighter efficiency mandates.


Research Methodology Framework and Report Scope
Market Definition and Coverage
This market covers the revenue generated from marine propellers used to provide main propulsion for seagoing vessels, including new installations and replacement demand, and counted at the supplier level in USD.
Scope exclusions: Excludes marine thrusters, water-jet propulsion units, and non-marine propellers used in industrial or aerospace applications.
Segmentation Overview
- By Propeller Type
- Fixed Pitch Propeller
- Controllable Pitch Propeller
- Contra-Rotating Propeller
- Ducted/Kort Nozzle Propeller
- Azimuth/Podded Propeller
- Surface-Piercing Propeller
- Others
- By Number of Blades
- 2 Blades
- 3 Blades
- 4 Blades
- 5 Blades
- 6+ Blades
- By Material
- Nickel-Aluminum Bronze
- Stainless Steel
- Aluminium
- Composite/CFRP
- Others
- By Propulsion System
- Inboard
- Outboard
- Sterndrive
- Electric Pod/Azipod
- By Application (Vessel Type)
- Merchant/Cargo Vessels
- Passenger Ferries and Cruise
- Naval and Defense Vessels
- Offshore Support and Tug Boats
- Recreational and Leisure Boats
- Inland Waterway Vessels
- By Sales Channel
- Original Equipment Manufacturer (OEM)
- Aftermarket
- By Geography
- North America
- United States
- Canada
- Rest of North America
- South America
- Brazil
- Argentina
- Rest of South America
- Europe
- Germany
- United Kingdom
- Norway
- France
- Italy
- Spain
- Russia
- Rest of Europe
- Asia-Pacific
- China
- Japan
- South Korea
- India
- Australia
- Rest of Asia Pacific
- Middle East and Africa
- GCC
- Turkey
- South Africa
- Rest of Middle East and Africa
- North America
Data Sources, Market Sizing, and Validation
Desk Research
Desk research was used to build a realistic demand and supply picture before any calculations were finalized. We reviewed public releases and statistics such as IMO decarbonization guidance (including EEXI and CII context), UNCTAD maritime transport indicators, World Bank trade and macro series, U.S. Census Bureau trade statistics for relevant marine parts, and EU Eurostat external trade tables to understand shipbuilding output, fleet activity, and retrofit triggers.
To translate those signals into a workable model, we also used company annual reports, investor presentations, and updates from port and shipbuilding associations to sense-check ordering cycles and aftermarket intensity. Patent databases were selectively referenced to track design activity around controllable pitch, ducted, and high-efficiency designs, and an import and export shipment-level database was used where it helped confirm directional trade flows of key components. The sources mentioned above are illustrative and not exhaustive, and additional public documents were also used for collection, validation, and clarification.
Primary Interviews and Surveys
Primary work focused on interviews and structured questionnaires with propeller manufacturers, distributors, shipyards, and vessel operators, so assumptions on replacement rates, lead times, and pricing could be confirmed against how the aftermarket actually runs. Since this is a global market, inputs were checked across APAC, EMEA, and the Americas to reduce regional bias and to capture differences in build and retrofit patterns.
Distribution of primary research fieldwork respondents
| Company type | Respondent position | Region |
|---|---|---|
| Top tier: 37% | CXOs: 13% | APAC: 46% |
| Mid tier: 47% | Functional/Unit leaders: 42% | EMEA: 31% |
| Smaller Players: 16% | Managers: 45% | Americas: 23% |
Market-Sizing & Forecasting
Sizing was built using a top-down and bottom-up combination, where shipbuilding output, active fleet counts, and retrofit triggers were used to reconstruct the addressable propeller demand pool, and then converted into value using typical unit needs and pricing bands. Once that structure was stable, selective bottom-up checks were added using sampled supplier revenues, channel feedback on OEM versus aftermarket mix, and ASP times volume approximations for common vessel classes.
Key inputs that helped the model behave like the real market included newbuild deliveries by major ship categories, share of vessels undergoing efficiency retrofits linked to EEXI and CII compliance timelines, typical replacement intervals by operating profile, shifts in material preference (such as nickel-aluminum bronze versus stainless variants), and observed pricing movement tied to metal costs and machining capacity. Where bottom-up data was missing for smaller ports or niche vessel types, gaps were handled through ratio-based allocation using nearby fleet intensity and shipyard activity, then rechecked with interview feedback.
For forecasting, scenario analysis was used so baseline growth followed consensus expectations on newbuild cycles, regulation-led retrofits, and trade-driven utilization. Upside or downside cases were applied when macro and ship ordering indicators moved away from normal ranges. Assumptions were kept transparent so each driver can be re-run when new fleet or shipbuilding updates come in.
Data Validation & Update Cycle
Totals were validated through triangulation across multiple signals, including implied units per vessel, OEM order momentum, aftermarket replacement logic, and regional fleet profiles. When outliers appeared, the calculations were revisited step by step, and follow-up questions were sent to interviewees to confirm whether the variance came from scope, timing, or pricing assumptions.
Before sign-off, the model and its key inputs go through multi-stage analyst reviews so arithmetic, currency conversions, and year alignment are consistent across regions. The report is refreshed annually, and interim updates are made when major events occur, such as regulation changes, sudden shipbuilding cycle shifts, or large changes in input material pricing. Right before delivery, a final review pass is completed so clients receive an updated view based on the latest available public indicators.
Mordor Intelligence's Marine Propeller Market Size Compared With Other Published Estimates
Published market values for marine propellers can look different because each publisher draws the line around what counts as a propeller sale, the year used as the starting point, and how retrofit demand is treated versus newbuild demand.
Thrusters and water-jet propulsion units sit outside Mordor Intelligence's scope for this market, which is one clear reason some published totals come out higher when adjacent propulsion hardware is bundled together. Other gaps also come from how OEM and aftermarket revenues are combined, whether inland craft are counted, the exchange-rate timing used to convert regional revenues, and how fast pricing is assumed to move with metal costs and machining capacity.
Benchmark comparison
| Source | Market Size | Gaps in Research Methodology |
|---|---|---|
| Mordor Intelligence | USD 4.78 B (2026) | |
| Global Consultancy A | USD 5.26 B (2026) | Uses a broader propulsion definition that can group propellers together with thruster-related categories, and it applies wider vessel and propulsion system buckets, which can lift totals for the same year. |
| Industry Data Publisher B | USD 4.88 B (2024) | Anchors the model on a different base year and a lower growth curve, and it also indicates inclusion of thrusters within the market definition, which changes what is counted as marine propeller revenue. |
The spread in the table is mainly explained by scope edges and timing, not by a simple math difference. By keeping the demand pool tied to seagoing main-propulsion propellers and then validating price and replacement assumptions with interviews, the total stays traceable to shipbuilding activity, fleet utilization, and retrofit intensity.


Key Questions Answered in the Report
What is the current size of the marine propeller market, and how fast is it growing?
The market stands at USD 4.78 billion in 2026 and is projected to reach roughly USD 6.57 billion by 2031, advancing at a 6.6% CAGR.
Which propeller type is expanding the fastest?
Controllable-pitch propellers lead growth with a 6.70% CAGR due to their ability to improve fuel efficiency and meet IMO EEXI and CII targets.
Which regions matter most for demand today and tomorrow?
Asia-Pacific, accounting for 43.7% of 2025 revenue, is poised to be the fastest-growing region, with projections of a 6.76% CAGR expansion from 2026 to 2031, bolstered by robust shipbuilding and retrofit activities.
What is the single most important market driver?
Mandatory IMO EEXI and CII regulations that link propulsion efficiency to operating licenses and financing, prompting widespread retrofit activity.
What cost or supply challenge most affects manufacturers?
Volatile prices for nickel-aluminum bronze and composite materials can account for up to 60% of a premium propeller’s cost, pressuring margins and complicating long-term contracts.
How concentrated is the competitive landscape?
The top five suppliers hold more than half of the combined share, giving the market a moderate concentration score of 6 while leaving room for regional specialists.
Page last updated on:


 Your data is secure and never sold or shared.


