
Marine Biotechnology Market Size and Share
Market Overview
| Study Period | 2020 - 2031 |
|---|---|
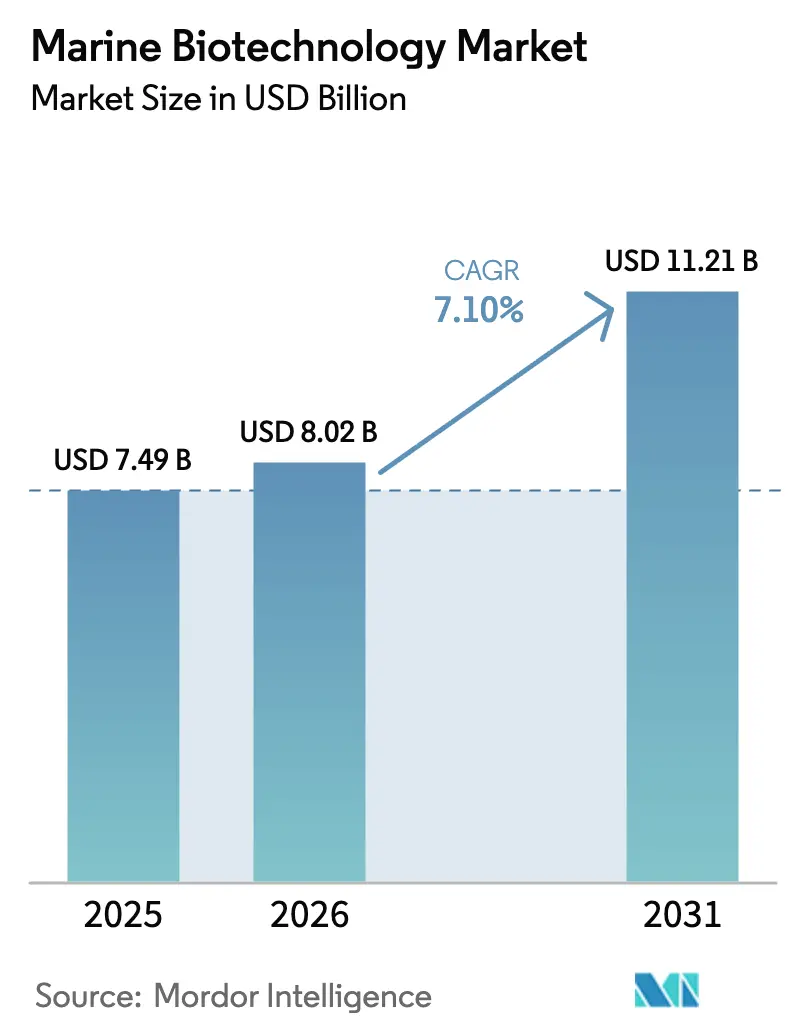
| Market Size (2026) | USD 8.02 Billion |
| Market Size (2031) | USD 11.21 Billion |
| Growth Rate (2026 - 2031) | 7.10 % |
| Fastest Growing Market | Asia-Pacific |
| Largest Market | North America |
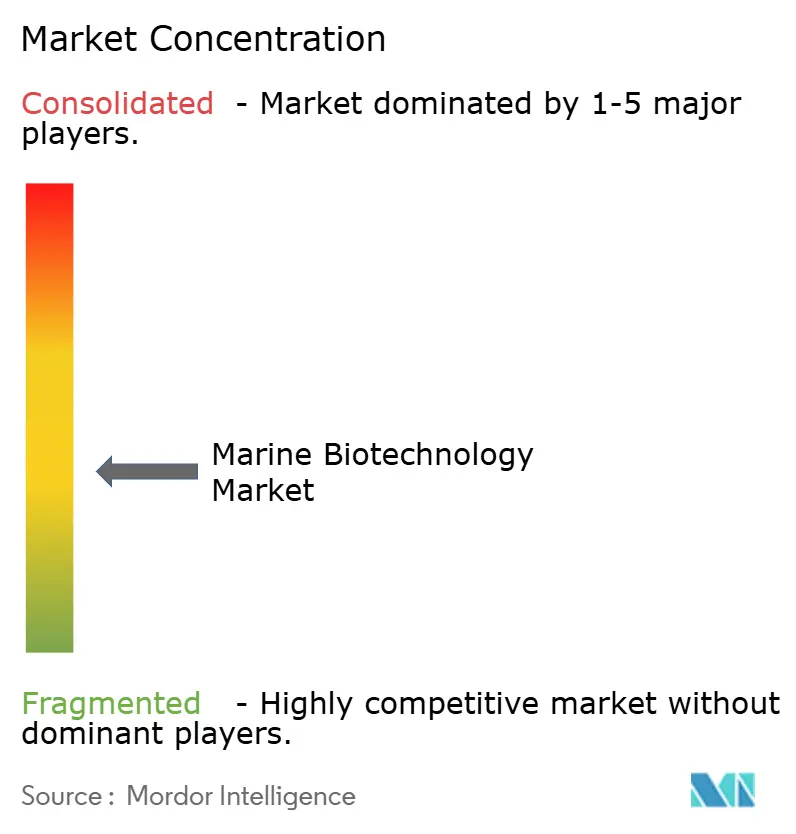
| Market Concentration | Medium |
Major Players *Disclaimer: Major Players sorted in no particular order Image © Mordor Intelligence. Reuse requires attribution under CC BY 4.0. | |
Marine Biotechnology Market Analysis by Mordor Intelligence
The marine biotechnology market size is projected to be USD 7.49 billion in 2025, USD 8.02 billion in 2026, and reach USD 11.21 billion by 2031, growing at a CAGR of 7.10% from 2026 to 2031. Surging demand for marine-sourced oncology actives, clean-label cosmetics ingredients, and carbon-negative bioplastics is widening commercial pipelines, while vertical-integration strategies help leading suppliers secure feedstock and margin. North America defends the largest regional share thanks to NIH and NOAA funding, yet Asia-Pacific is accelerating on the back of large-scale offshore bioreactors and functional-food adoption. Despite solid top-line growth, the marine biotechnology market faces two near-term headwinds: low laboratory cultivability of deep-sea microbes and synthetic-biology routes that recreate high-volume metabolites in terrestrial hosts. Even so, the market’s medium-term opportunity set remains compelling as pharmaceutical approvals, aquaculture genomics tools, and net-zero mandates unlock new revenue pools.
Key Report Takeaways
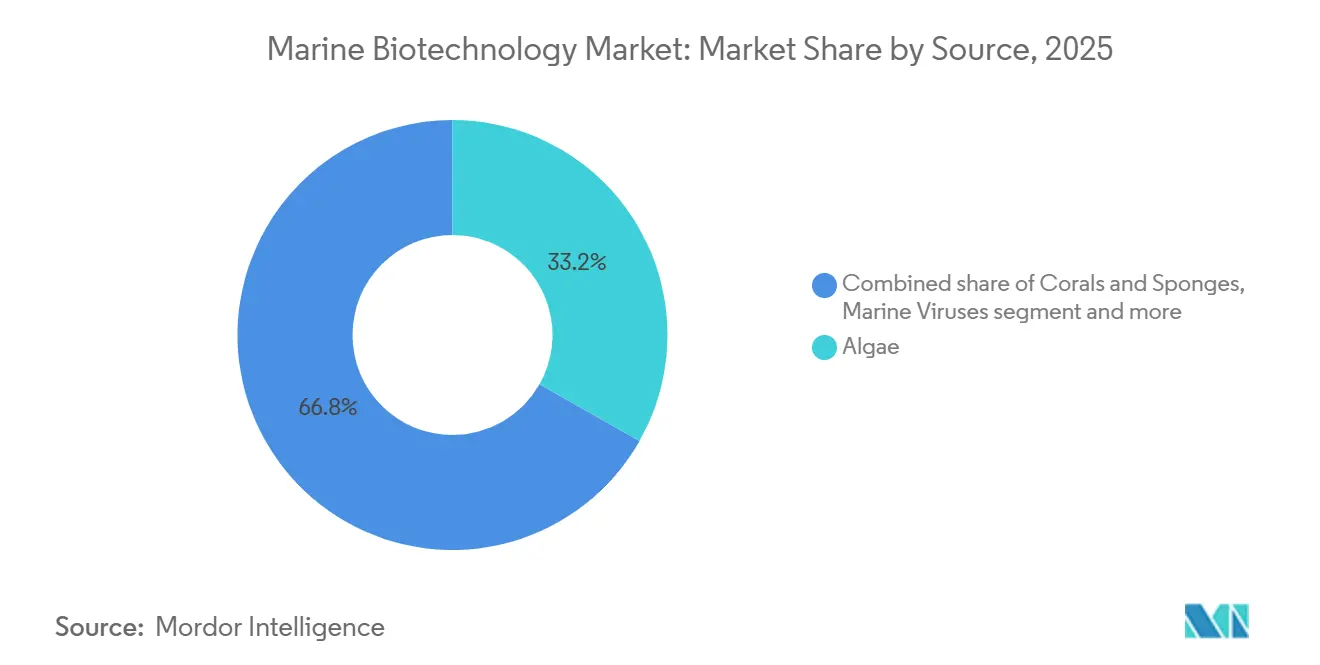
- By source, algae dominated with 33.2% of the marine biotechnology market share in 2025, whereas corals and sponges are forecast to expand at a 9.24% CAGR through 2031.
- By application, pharmaceuticals led with 35.6% revenue share of the marine biotechnology market size in 2025; nutraceuticals remain the fastest-growing application at a 9.54% CAGR over the same horizon.
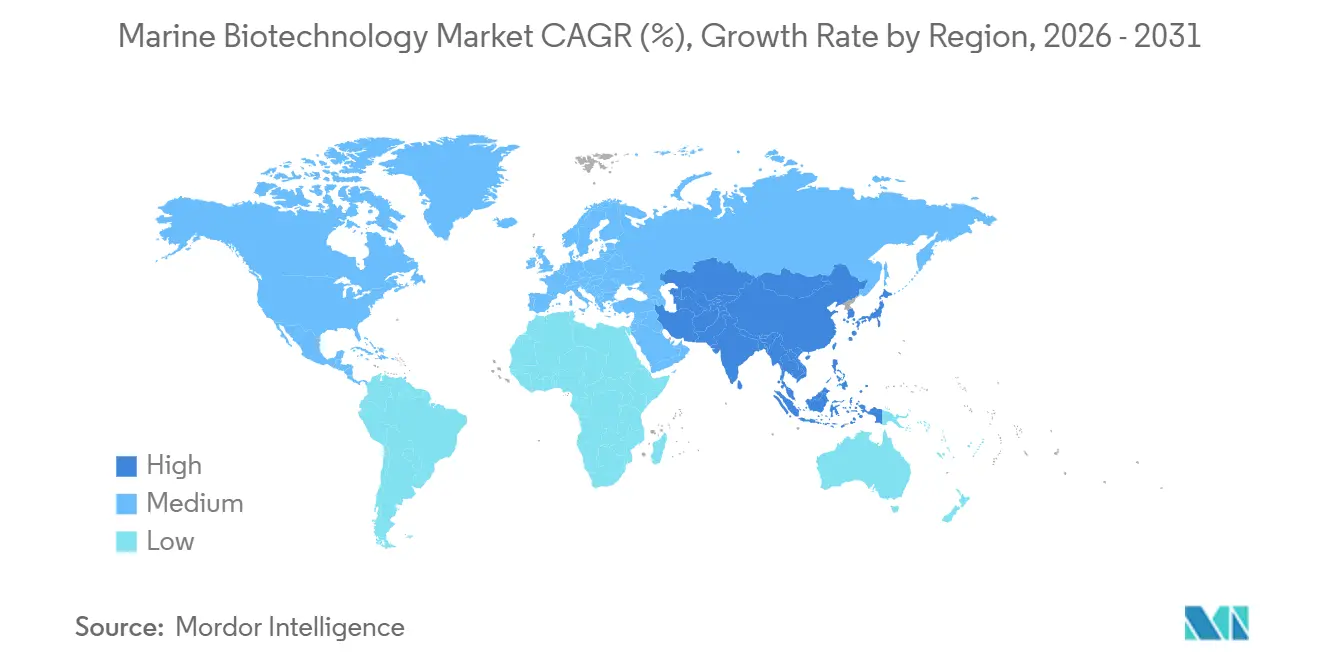
- By geography, North America commanded 45.56% of the marine biotechnology market revenue in 2025, while Asia-Pacific is set to record the fastest 8.98% regional CAGR to 2031.
Note: Market size and forecast figures in this report are generated using Mordor Intelligence’s proprietary estimation framework, updated with the latest available data and insights as of January 2026.
Market Trends and Insights
Drivers Impact Analysis of Marine Biotechnology Market*
| Driver | (~) % Impact on CAGR Forecast | Geographic Relevance | Impact Timeline |
|---|---|---|---|
| Increase in Marine-Sourced Actives for Pharmaceuticals & Cosmetics | +1.2% | North America, Europe | Medium term (2-4 years) |
| Rising Demand for Marine-Derived Nutritional Supplements | +1.0% | North America, Asia-Pacific | Short term (≤ 2 years) |
| Advances in Fisheries Genomics & Drug-Discovery Platforms | +0.9% | Asia-Pacific core, spillover to North America | Medium term (2-4 years) |
| AI-Enabled Bioprospecting Accelerates Novel Compound Discovery | +0.8% | North America, Europe | Long term (≥ 4 years) |
| Net-Zero Policies Stimulating Algae-Based Bioplastics Investment | +0.7% | Europe, North America | Long term (≥ 4 years) |
| EU Blue Economy Funds Scaling Early-Stage Blue-Biotech Start-Ups | +0.6% | Europe, Mediterranean | Medium term (2-4 years) |
| Source: Mordor Intelligence | |||
Increase in Marine-Sourced Actives for Pharmaceuticals & Cosmetics
Clinical pipelines are pivoting toward ocean-derived scaffolds as terrestrial natural-product libraries plateau; PharmaMar’s tunicate-origin lurbinectedin gained U.S. approval for small-cell lung cancer in 2024. Clean-beauty brands now command price premiums for kelp peptides and sponge polysaccharides, and the FDA’s 2024 excipient guidance has trimmed drug-delivery approval timelines by up to nine months. These combined regulatory and efficacy advantages underpin the driver’s 1.2% positive impact on the marine biotechnology market.
Rising Demand for Marine-Derived Nutritional Supplements
Vegan omega-3 capsules from micro-algae captured 22% of the global EPA/DHA segment in 2025 as consumers pivot away from fish oil[1]. Schizochytrium-based DHA earned EU Novel Food clearance, unlocking infant-formula channels, while astaxanthin products posted double-digit growth after clinical validation of sports-recovery benefits. Regulatory tailwinds and superior bioavailability sustain a 1.0% boost to CAGR.
Advances in Fisheries Genomics & Drug-Discovery Platforms
Whole-genome sequencing of Atlantic salmon identified 47 loci for sea-lice resistance, allowing breeders to trim generation intervals by 18 months. Concurrently, marine-microbiome cloning kits shorten enzyme discovery cycles from 18 to six months, widening industrial-biocatalyst portfolios. Together, these breakthroughs raise aquaculture productivity and pharmaceutical hit rates, contributing 0.9% to growth.
AI-Enabled Bioprospecting Accelerates Novel Compound Discovery
Algorithms trained on 12,000-species metabolomic data predict high-value leads before field sampling; Insilico Medicine pinpointed a marine kinase inhibitor in 18 months versus the historical four-year average. Proprietary models from GlycoMar screened coral glycosaminoglycans and generated three anti-inflammatory candidates in 2025, tripling the company’s historical output. Long-term, digital tools lower discovery costs, adding 0.8% to CAGR.
Restraints Impact Analysis of Marine Biotechnology Market*
| Restraint | (~) % Impact on CAGR Forecast | Geographic Relevance | Impact Timeline |
|---|---|---|---|
| Limited Ocean Exploration Depth & Sample Collection | -0.5% | Global hot spots | Long term (≥ 4 years) |
| Low Cultivability of Many Marine Micro-Organisms | -0.4% | Global, pharma pipelines | Medium term (2-4 years) |
| Forthcoming BBNJ Access-And-Benefit-Sharing Compliance Costs | -0.3% | Global, SMEs hardest hit | Short term (≤ 2 years) |
| Competition From Terrestrial Synthetic-Biology Alternatives | -0.3% | North America, Europe | Medium term (2-4 years) |
| Source: Mordor Intelligence | |||
Limited Ocean Exploration Depth & Sample Collection
Only one-fifth of the ocean floor has high-resolution mapping, and hadal-zone sampling costs USD 50,000 per dive day, limiting biodiversity access for start-ups[2]. Autonomous drones from Ocean Infinity trimmed costs by two-thirds in 2025, yet throughput still trails terrestrial surveys by two orders of magnitude. This bottleneck subtracts 0.5% from market CAGR.
Low Cultivability of Many Marine Micro-Organisms
Fewer than 5% of marine bacteria grow in standard media, extending development timelines; heterologous expression of sponge enzymes takes up to five years versus under 12 months for terrestrial strains. Single-cell genomics offers a workaround at USD 10,000 per gene cluster, restricting use to high-value pharma targets and cutting 0.4% off CAGR.
*Our forecasts treat driver/restraint impacts as directional, not additive. The impact forecasts reflect baseline growth, mix effects, and variable interactions.
Marine Biotechnology Market Segment Analysis
By Source:
Corals & Sponges Gain Momentum Over AlgaeCorals and sponges are projected to advance at a 9.24% CAGR from 2026-2031, the swiftest rate among source categories in the marine biotechnology market. Their halogen-rich metabolites underpin oncology and antiviral breakthroughs; PharmaMar’s tunicate-origin plitidepsin finished Phase III COVID-19 trials in 2025. GlycoMar’s sponge library yielded a heparan-sulfate analog that outperformed enoxaparin in thrombosis models, confirming high therapeutic potential.
Algae maintained a 33.2% marine biotechnology market share in 2025, anchored by spirulina protein, chlorella, and astaxanthin in supplements. Yet growth is moderating as synthetic biology clones high-volume algal metabolites. Marine viruses and fungi remain niche but promising; a 2024 Arctic fungal isolate produced a novel beta-lactamase inhibitor.

By Application:
Nutraceuticals Capture Volume, Pharmaceuticals Capture ValueNutraceuticals will register a 9.54% CAGR to 2031, driven by preventive-health consumers migrating from fish oil to algae EPA-DHA concentrates and functional-food fortification strategies. The marine biotechnology market size for supplements is reinforced by AstaReal’s demonstrated 34% reduction in oxidative stress at 12 mg astaxanthin daily. Pharmaceuticals, while growing at a lower rate, command top-line value; lurbinectedin alone generated EUR 120 million across 15 jurisdictions in 2025. Regulatory fast-tracks for marine-derived excipients further entice drug-delivery innovators to substitute ocean polysaccharides for synthetic carriers, maintaining pipeline momentum.
Cosmetics leverage marine peptides and collagen to meet reef-safe and microplastic-free mandates, as illustrated by BASF’s EU-approved marine UV filter now bundled into premium sunscreen SKUs. Industrial enzymes and algae-based bioplastics deepen application diversification: Novozymes’ krill protease reduces leather-tanning energy loads by 20%, and AirCarbon polyhydroxybutyrate lines Dell laptop casings while locking in a carbon-negative material balance.
Geography Analysis
North America Marine Biotechnology Market
North America captured 45.56% of the marine biotechnology market revenue in 2025 as NIH allocated USD 85 million to a marine natural-products screening program and NOAA launched grants that drew USD 18 million in private seaweed investment to Maine. Regulatory clarity and FDA guidance on marine excipients shorten commercialization cycles, while Canada’s Ocean Supercluster co-funds AI-enabled genomics databases.
APAC Marine Biotechnology Market
Asia-Pacific will post an 8.98% regional CAGR, the fastest globally, underpinned by China’s USD 200 million deep-sea enzyme initiative and Japan’s 500-t Euglena facility that now supplies biojet fuel for 12-month ANA trials. South Korea earmarked KRW 120 billion in 2025 for marine-derived oncology pipelines[3], and India scales Kappaphycus seaweed farms to cut carrageenan imports.
EMEA and South America Marine Biotechnology Market
Europe benefits from EUR 800 million in EMFAF blue-biotech grants and stringent net-zero policies that elevate algae-bioplastic demand. Norway’s public salmon pangenome expedites global breeding programs, the UAE pilots algae carbon-capture at desalination plants, South Africa grows kelp for abalone feed, and Brazil’s Embrapa assays native seaweeds for carrageenan, rounding out diversified regional contributions.
Regulatory Landscape
Marine biotechnology operates in a tightening access-and-benefit-sharing (ABS) environment that shapes how marine genetic resources are collected, used, and commercialized across jurisdictions. In 2026, Australia enacted the High Seas Biodiversity Act 2026 to establish a framework for marine genetic resources and associated digital sequence information, and the United Kingdom passed the Biodiversity Beyond National Jurisdiction Act 2026, enabling the Secretary of State to implement international obligations on marine genetic resources and benefit-sharing. These national moves reinforce the need for companies to document origin, permissions, and benefit-sharing terms earlier in discovery and scale-up, especially for cross-border R&D programs.
For commercialization, regulatory pathways remain application-specific, with pharmaceuticals and food and supplements most exposed to formal approvals. In the European Union, the ABS framework under the Nagoya Protocol (and related due-diligence requirements) intersects with the Novel Foods Regulation for marine-derived foods and ingredients, while EU blue-biotech priorities are also reflected through Horizon Europe calls that require compliance with international biodiversity governance. In the United States, FDA’s established development and approval process for drugs continues to shape marine-derived therapeutics and excipient use cases, and the report context highlights the 2024 FDA excipient guidance as an example of process clarity that can shorten development cycles for marine-sourced drug-delivery materials.
Competitive Landscape
The marine biotechnology industry remains moderately fragmented: the top-10 players hold roughly the majority of revenue, leaving room for specialized entrants. Incumbents such as BASF and Lonza pursue vertical integration, controlling cultivation through formulation to secure feedstock and margin; BASF’s 2024 Algenol stake safeguards algae-ethylene supply. Niche firms employ proprietary IP, including Marinova’s fucoidan extraction and GlycoMar’s sponge glycosaminoglycan library - to command high-value pharmaceutical and nutraceutical niches.
Technology adoption divides the field: leaders deploy CRISPR strain-engineering, continuous bioreactors, and AI hit-discovery, whereas smaller players rely on wild harvests that cap throughput. Patent data show Lonza filed 12 marine-enzyme patents in 2024 focused on thermostable proteases, while PharmaMar protects tunicate metabolites with composition-of-matter claims expiring 2028-2032.
Regulatory readiness is emerging as a moat; companies fluent in BBNJ and Nagoya compliance can advance faster than newcomers. Early access to EU Novel Food and FDA guidance have accelerated DSM-Firmenich’s Schizochytrium DHA and BASF’s reef-safe UV-filters. Disruptive AI platforms may level the playing field, as Insilico’s Pharma.AI shortened discovery cycles to 18 months, allowing capital-light start-ups to compete.
Marine Biotechnology Industry Leaders
-
Cyanotech Corporation
-
BASF SE
-
Lonza Group Ltd
-
Aker BioMarine ASA
-
Euglena Co., Ltd.
- *Disclaimer: Major Players sorted in no particular order
Marine Biotechnology Market Companies Covered in this Report
- Aker BioMarine ASA
- Algatechnologies Ltd
- Aqua Bio Technology ASA
- AstaReal Co., Ltd.
- BASF
- Bluebiotech International
- CP Kelco U.S., Inc.
- Cyanotech
- Euglena Co., Ltd.
- GlycoMar Ltd.
- Lonza Group
- Marinomed Biotech
- Marinova Pty Ltd
- New England Biolabs
- Nutrex Hawaii Inc.
- PharmaMar S.A.
- Royal DSM-Firmenich N.V.
- Sea Run Holdings Inc.
- SEPPIC
Market Opportunities and Future Outlook
Near-term whitespace is emerging where regulated, traceable supply chains and higher-value functionality intersect, particularly in omega-3 alternatives, enzyme biocatalysis, and circular bioeconomy inputs from marine side streams. In Europe, Horizon Europe provides concrete commercialization targets and infrastructure alignment, with the BLUETOOLS project focused on bringing at least 400 enzymes to market for biocatalysis and delivering at least two solutions for plastic and polymer degradation, while MARMADE targets extraction and processing routes (including supercritical CO2 and high-pressure homogenization) to valorize crustacean residues and seaweed into food and feed ingredients. These programs clarify the path from biodiscovery to industrial validation, and they support partnerships among ingredient suppliers, biotech developers, and downstream formulators.
Drug discovery and translational research opportunities also broaden through formal international collaborations and country-level blue economy priorities. In January 2026, the University of Florida (CNPD3), Duke-NUS Medical School, and Indonesia’s BRIN formalized a trilateral partnership to develop marine natural products from Indonesian waters into therapeutic products, indicating continued pipeline building beyond traditional North America and Europe hubs. In parallel, China has positioned pharmaceutical development from marine bioresources as a growth point for the marine economy during the 15th Five-Year Plan period (2026-2030), supporting demand for enabling capabilities such as compliant sampling, omics, and scaled production. Across regions, the same constraint emphasized in the report context, low cultivability of marine microorganisms, keeps demand focused on workarounds such as metagenomics, heterologous expression, and AI-enabled target selection that can reduce trial-and-error in wet labs.
Recent Industry Developments in Marine Biotechnology Market
- July 2026: Aker BioMarine secured a major new Superba Krill Oil contract, with deliveries scheduled to begin in Q4 2026. The win improves visibility for downstream nutraceutical customers and supports capacity planning across harvesting, processing, and finished-ingredient logistics.
- April 2026: Cyanotech Corporation announced a commercial-scale manufacturing agreement with ZIVO Bioscience to cultivate and process ZIVO’s proprietary algal biomass for the Zivolife product line. The agreement highlights demand for contract manufacturing and scale-up partners that can bridge the gap between proprietary strains and consistent commercial output.
- March 2025: Marine Biologics announced the commercial launch of SuperCrude, a seaweed-derived programmable biomass positioned for next-generation ingredient applications. The launch broadens the menu of standardized seaweed-based inputs for formulators seeking alternatives to wild-harvest variability.
Marine Biotechnology Market Report Scope and Research Methodology
Market Definition and Coverage
For this study, the marine biotechnology market covers the value of products and enabling technologies that use marine organisms or marine bioresources to develop commercial outputs in health, nutrition, personal care, and related applications.
Scope exclusions: We exclude conventional seafood processing, marine capture and aquaculture production value, and non-biotech commodity marine ingredients unless a biotech-driven conversion or bioactive is being sold.
Segments Covered in This Report
- By Source
- Corals & Sponges
- Algae
- Marine Viruses
- Marine Fungi
- Other Sources
- By Application
- Pharmaceuticals
- Nutraceuticals & Dietary Supplements
- Cosmetics & Personal Care
- Others
- Geography
- North America
- United States
- Canada
- Mexico
- Europe
- Germany
- United Kingdom
- France
- Italy
- Spain
- Rest of Europe
- Asia-Pacific
- China
- Japan
- India
- Australia
- South Korea
- Rest of Asia-Pacific
- Middle East and Africa
- GCC
- South Africa
- Rest of Middle East and Africa
- South America
- Brazil
- Argentina
- Rest of South America
- North America
Data Sources, Market Sizing, and Validation
Desk Research
Desk work started with defining what counts as marine biotech revenue and what does not, since many marine products sit close to food, chemicals, or basic extraction businesses. We reviewed public and official sources such as NOAA and other national ocean agencies, the FAO for fisheries and aquaculture context, OECD ocean economy publications, WIPO patent statistics, and peer reviewed journals that track marine natural products and bioprocessing activity.
To translate the context into a sizing model, we also used company annual reports, investor presentations, regulator and clinical registry summaries for marine derived therapeutics, and reputable press releases on product launches and funding. Where available, paid subscriptions were used only to speed up company financial capture, patent screening, and shipment level checks for selected inputs. The sources listed here are illustrative, and many other documents were referred to for data collection, validation, and clarification during the work.
Primary Interviews and Surveys
Primary calls and surveys were used to pressure test what is truly commercialized today versus what sits in research pipelines, and to confirm typical pricing logic for marine bioactives and biomaterials. We spoke with a mix of ingredient suppliers, biotech developers, downstream formulators, and channel specialists across major regions so our assumptions on adoption timing and revenue attribution could be tightened.
Distribution of primary research fieldwork respondents
| Company type | Respondent position | Region |
|---|---|---|
| Top tier: 27% | CXOs: 15% | APAC: 46% |
| Mid tier: 57% | Functional/Unit leaders: 34% | EMEA: 30% |
| Smaller Players: 16% | Managers: 51% | Americas: 24% |
Market-Sizing & Forecasting
Our market sizing used a top down build where end use demand pools were reconstructed from observable signals, and then allocated to marine biotech outputs based on adoption and value capture. This was then checked with selective bottom up approximations like sampled company revenue splits, channel discussions on volume movement, and price per kilogram or price per dose ranges for common marine bioactives.
The model is steered by a few practical inputs that can be traced and refreshed, such as patenting intensity for marine strains and processes, clinical and regulatory progress for marine derived drugs, cosmetic and nutraceutical launch activity that mentions marine bioactives, cultivation and extraction capacity expansion signals, and price movement patterns for higher value ingredients. When company disclosures were not granular enough, revenue splits were inferred using product mix cues and then rechecked with interviews so gaps did not inflate totals.
For forecasting, scenario analysis was used because the market is sensitive to pipeline conversion and scale up timing, which can swing results more than simple trend lines. Key variables were stepped forward with expert consensus from interviews, and the final CAGR path was adjusted only after the supplier and downstream checks landed within a reasonable variance band.
Data Validation & Update Cycle
Outputs were validated through triangulation across independent signals, including innovation activity, commercialization announcements, and region level demand momentum in key end uses. Large variances were flagged, and the underlying drivers like price assumptions, adoption shares, and geography splits were revisited before sign off.
A multi step review is followed where another analyst challenges the logic, spot checks calculations, and confirms that exclusions are consistently applied. Reports are refreshed annually, and interim updates are triggered when material events occur (for example, major approvals, capacity additions, or regulation shifts). Before delivery, a fresh pass is completed so the numbers reflect the latest available public information and recent primary feedback.
Mordor Intelligence's Marine Biotechnology Market Size Measured Against Other Published Estimates
Published market sizes for marine biotechnology often vary because groups do not count the same revenue streams, and they also differ on how they treat early stage pipelines versus commercial sales. The time window used, currency timing, and how quickly assumptions are refreshed can also shift the final number.
The main gap comes from whether marine derived ingredients are counted only when they are sold as biotech-enabled bioactives or biomaterials, or whether broader marine ingredients and adjacent processing value are folded in. Some estimates also lean heavily on a single demand proxy or on limited company lists, while others use a slower price progression method that can understate value in higher margin applications. The table below shows this spread, and it explains how scope and assumption choices flow into different totals, a modeling choice applied by Mordor Intelligence.
Benchmark comparison
| Source | Market Size | Gaps in Research Methodology |
|---|---|---|
| Mordor Intelligence | USD 8.02 B (2026) | |
| Trade Publisher A | USD 6.64 B (2025) | Uses a nearer term base year and mixes historic and forecast periods, and it can also pull in broader marine bioeconomy revenue that is not always tied to biotech-derived commercialization. |
| Industry Report B | USD 5.79 B (2024) | Leans on a narrower company and product interpretation and applies a slower growth curve, which can miss higher value bioactive expansions that show up in launch and pricing checks. |
Overall, the spread is mainly explained by what is included, how pricing is carried forward, and how quickly assumptions are revisited as pipelines move toward sales. By keeping the model tied to clear commercialization signals and repeatable input variables, we keep the estimate easier to audit and simpler to update when new evidence arrives.
Key Questions Answered in the Report
How large will be the marine biotechnology market in 2026?
How large will the marine biotechnology market be in 2026?
Which source segment is expanding the fastest?
Corals and sponges are projected to grow at a 9.24% CAGR to 2031 as their metabolites feed oncology and antiviral pipelines.
What drives rapid growth in aquaculture applications?
Genomic selection, disease-resistant breeding, and probiotic feeds are boosting productivity and cutting antibiotic use, propelling a 9.78% CAGR for aquaculture users.
Why does Asia-Pacific outpace other regions?
Large-scale offshore bioreactors, functional-food adoption, and government funding in China, Japan, and South Korea underpin an 8.98% regional CAGR.
How do net-zero policies affect marine bioplastics?
EU carbon tariffs and California compostable-packaging mandates make algae-based polymers cost-competitive, accelerating investment in bio-ethylene and compostable films.