
Global Marine Battery Market Size and Share
Market Overview
| Study Period | 2020 - 2031 |
|---|---|
| Market Size (2026) | USD 0.97 Billion |
| Market Size (2031) | USD 1.45 Billion |
| Growth Rate (2026 - 2031) | 8.29 % |
| Fastest Growing Market | Asia Pacific |
| Largest Market | Europe |
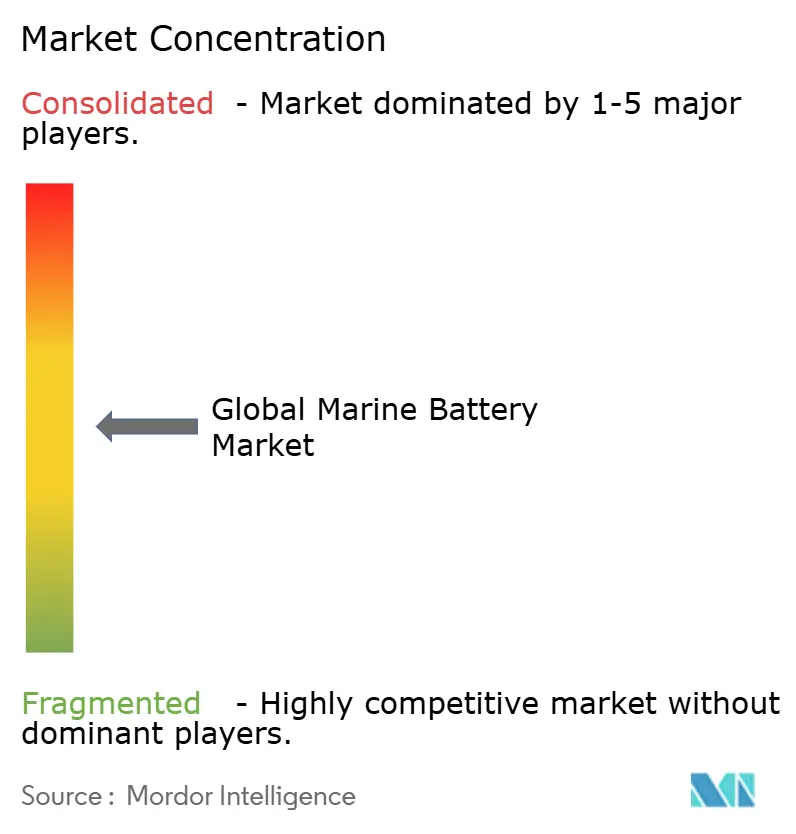
| Market Concentration | Medium |
Major Players *Disclaimer: Major Players sorted in no particular order Image © Mordor Intelligence. Reuse requires attribution under CC BY 4.0. | |
Global Marine Battery Market Analysis by Mordor Intelligence
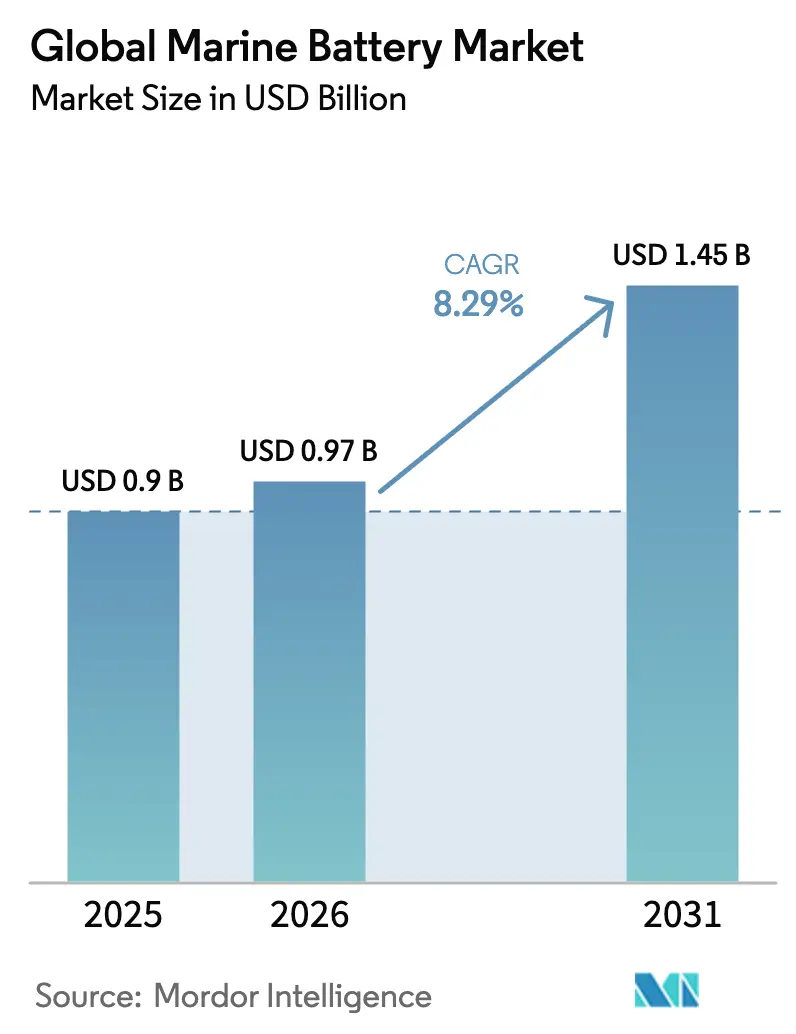
The marine battery market size is expected to grow from USD 0.90 billion in 2025 to USD 0.97 billion in 2026 and is forecast to reach USD 1.45 billion by 2031 at 8.29% CAGR over 2026-2031. Compliance pressure from the FuelEU Maritime Regulation and the IMO’s updated zero-carbon strategy pushes operators toward electric and hybrid propulsion. Lower cell costs, broader shore-power coverage at European and Asian ports, and the proven reliability of ferry retrofits all motivate owners to install large packs. Supply-chain partnerships between shipbuilders and automotive cell makers are also trimming lead times, while solid-state chemistry breakthroughs are broadening the vessel types that can sail on batteries alone.
Key Report Takeaways
- By battery type, lithium-ion led with 65.62% revenue share in 2025, while solid-state batteries are forecast to expand at a 9.14% CAGR to 2031.
- By propulsion type, hybrid-electric systems held 63.72% of the marine battery market share in 2025, and fully electric designs are projected to grow at a 10.39% CAGR through 2031.
- By ship type, commercial vessels accounted for 71.68% of the marine battery market size in 2025; defense applications are projected to post the fastest 10.26% CAGR over the forecast period.
- By function, dual-purpose systems captured 44.98% revenue share in 2025 and are advancing at an 11.15% CAGR to 2031.
- By capacity, the 1–5 MWh range represented 54.10% share of the marine battery market size in 2025 and is set to rise at a 9.28% CAGR to 2031.
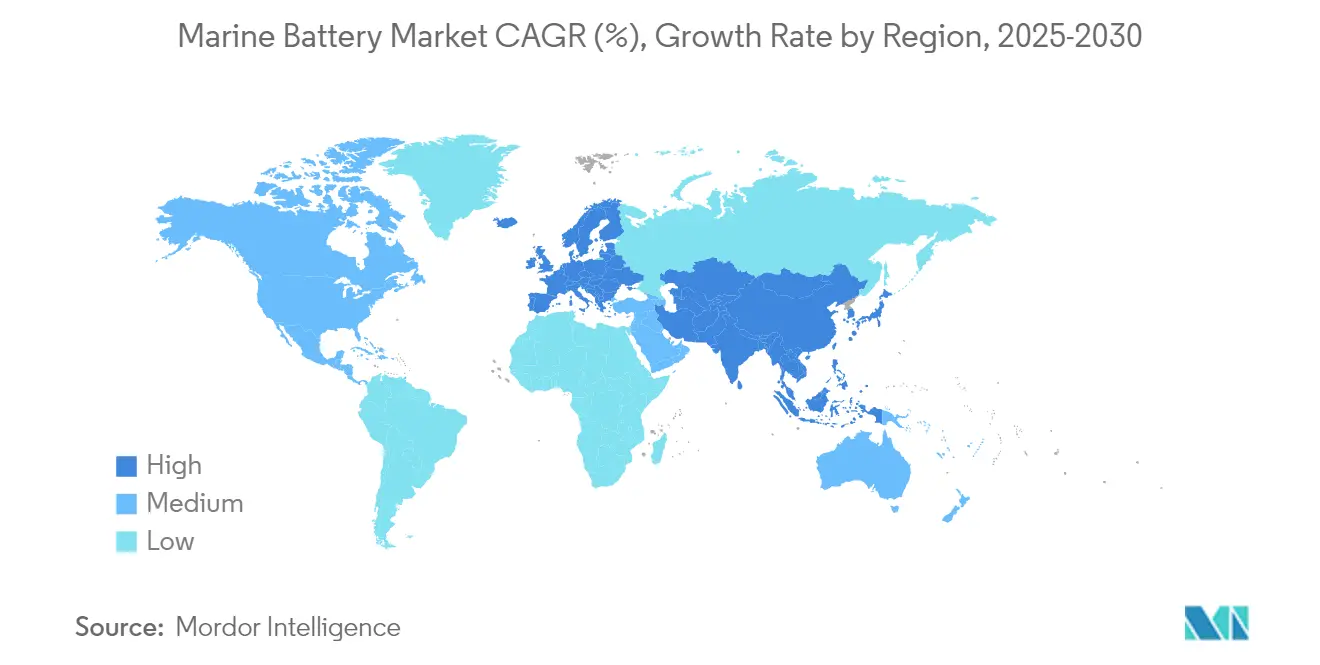
- By geography, Europe dominated with 42.20% revenue share in 2025, while Asia-Pacific is expected to record a 11.36% CAGR through 2031.
Note: Market size and forecast figures in this report are generated using Mordor Intelligence’s proprietary estimation framework, updated with the latest available data and insights as of 2026.
Market Trends and Insights
Drivers Impact Analysis of Global Marine Battery Market*
| Driver | (~) % Impact on CAGR Forecast | Geographic Relevance | Impact Timeline |
|---|---|---|---|
| IMO 2020 and EU Fit-for-55 Mandates | +2.1% | Europe, North America, Global | Medium term (2-4 years) |
| LFP/LTO Cell Price Fall Impacts Ownership Cost | +1.8% | Asia-Pacific, Europe | Short term (≤ 2 years) |
| Green-Port Incentives for Zero-Emission Berthing | +1.2% | Europe, spillover to North America | Medium term (2-4 years) |
| Inland-Waterways Adopt Battery Barges | +0.9% | Asia-Pacific, North America | Long term (≥ 4 years) |
| Silent-Running Submarine Demand | +0.7% | Developed markets | Long term (≥ 4 years) |
| Battery-Hybrid Adopts Offshore-Wind Services | +0.6% | Europe, Asia-Pacific | Medium term (2-4 years) |
| Source: Mordor Intelligence | |||
IMO 2020 & EU Fit-for-55 Emission Mandates Accelerating Electrification
Global and regional climate policies have aligned, making marine batteries an essential compliance tool. From 2025, FuelEU Maritime forces ships at berth to connect to shore power or use zero-emission technologies, and the IMO sets a 20% greenhouse-gas reduction target by 2030 [1]“FuelEU Maritime Regulation,” European Commission, ec.europa.eu. Operators, therefore, see battery packs as a direct route to avoid escalating carbon penalties, protect port access, and unlock lower running costs over the vessel's life.
Rapid Cost Decline of LFP/LTO Chemistries Improves TCO for Short-Sea Vessels
Cell prices for lithium iron phosphate and lithium titanate oxide continue to fall despite metal volatility, with a 40-50% drop expected by 2030. Real-world ferry data shows electric boats run for EUR 600-800 per year versus EUR 3,000-4,000 for similar diesel craft, cutting operating costs by up to 80%. The long cycle life, inherent safety, and lower maintenance of LFP-based packs deliver compelling economics on routes below 100 nautical miles.
European Green-Port Incentives for Zero-Emission Berthing
Northern European ports secured EUR 18.8 million in EU funding to build high-capacity shore-power systems and now offer tariff rebates for battery-equipped vessels [2]“EU-Funded Shore-Power Projects,” GAC Group, gac.com . Gothenburg plans a 70% CO₂ cut by 2030, while Portsmouth and Antwerp have upgraded berths that can recharge multi-megawatt packs during routine calls. Shore-side charging turns idle time into energy replenishment and extends zero-emission range on subsequent voyages.
Expansion of Inland-Waterway Logistics Corridors in China & U.S. Pushes Battery Barges
China has prioritized zero-carbon shipping on the Yangtze, and the United States is piloting battery cargo barges on the Mississippi network. Predictable routes, calm waters, and easy access to land-based chargers make inland waterways an ideal launchpad for multi-megawatt battery systems. National incentives in Beijing and Washington have therefore accelerated orders for large packs designed for barges and push-boats.
Restraints Impact Analysis of Global Marine Battery Market*
| Restraint | (~) % Impact on CAGR Forecast | Geographic Relevance | Impact Timeline |
|---|---|---|---|
| Retrofits Delayed by Limited Shipyard Slots | -1.4% | Europe, North America, Global | Short term (≤ 2 years) |
| Thermal-Runaway Concerns in Battery Rooms | -0.8% | Global, stricter in developed markets | Medium term (2-4 years) |
| High Cost of Marine-Certified Batteries | -0.6% | Global | Medium term (2-4 years) |
| South American Policy Shifts Threaten Limited Supply | -0.4% | Global | Long term (≥ 4 years) |
| Source: Mordor Intelligence | |||
Scarce Shipyard Capacity for Retrofits Causing Installation Bottlenecks
Yards that handle offshore wind and LNG carrier orders are close to capacity, pushing day rates up to USD 350,000 for specialized vessels and lengthening booking windows. Ferry operators now face multi-year waits for battery conversions, which defers near-term demand for the marine battery market [3]“Hybrid Marine Power System Performance,” Wärtsilä Corporation, wartsila.com.
Thermal-Runaway Safety Concerns for Large Battery Rooms
Lithium-ion fires on ro-ro carriers have highlighted unique hazards at sea. Class societies now mandate dedicated enclosures, gas extraction, and advanced suppression for installations above 1 MWh, raising costs and approval times.
*Our forecasts treat driver/restraint impacts as directional, not additive. The impact forecasts reflect baseline growth, mix effects, and variable interactions.
Global Marine Battery Market Segment Analysis
By Battery Type:
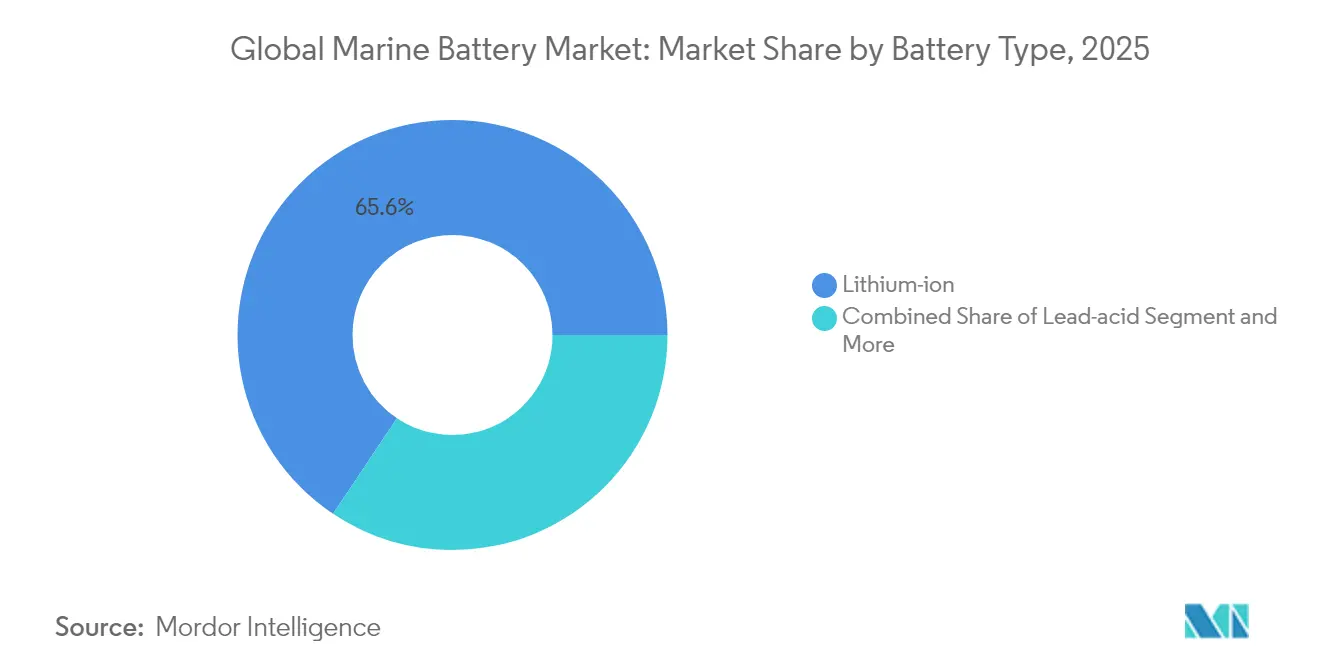
Solid-State Packs Redefine PerformanceLithium-ion chemistry held 65.62% revenue share in 2025 and remains the baseline for ferry and short-sea electrification. The marine battery market size for lithium-ion systems is projected to expand at high single-digit rates through 2031 as pack prices decline and cycle life improves. Solid-state variants, however, present a 9.14% CAGR opportunity by delivering up to triple energy density and an inherently safer solid electrolyte. Demonstrator modules charging to 80% in under 15 minutes are now entering pilot ferries, signaling an inflection point for the marine battery market.
Greater tolerance to temperature swings and elimination of liquid electrolytes reduce the need for bulky cooling gear in tight engine rooms. Several large shipyards expect production-scale solid-state packs to reach USD 100 per kWh around 2029, which should narrow the upfront premium. Lead-acid systems persist in backup roles where cost sensitivity outweighs weight penalties, while nickel-cadmium remains limited to niche defense programs. Fuel-cell hybrids, although promising for trans-ocean routes, continue to trail batteries in capital efficiency for sub-1,000 nautical-mile operations.


By Propulsion Type:
Hybrid Systems Bridge the TransitionHybrid-electric configurations captured 63.72% marine battery market share in 2025 because they cut fuel burn by up to 25% while retaining diesel range. Fleet data shows crew familiarization, class-approval processes, and port-charging windows are simpler when combustion engines remain on board. Still, fully electric newbuilds post a 10.39% CAGR thanks to rapidly expanding shore infrastructure and the falling cost of high-capacity packs. The marine battery market, therefore, follows a two-speed path where hybrids dominate retrofits and fully electric designs lead newbuilds on fixed ferry routes.
Energy-management software now orchestrates battery, generator, and hotel loads in real time, improving asset utilization and reducing maintenance. Conversion projects in Northern Europe demonstrate that once ports install megawatt-scale chargers, owners often plan to switch from hybrid to full electric within the first dry-dock cycle. Modular DC-hub architecture further simplifies the transition by allowing extra racks to be slotted in without major rewiring.
By Ship Type:
Commercial Fleet Remains Core While Defense SurgesCommercial vessels maintained 71.68% marine battery market size in 2025, driven by ferries, coastal feeders, and offshore service boats. Predictable timetables allow frequent charging, and public funding de-risks capital outlay. In contrast, defense programs show a 10.26% CAGR because navies pay a premium for silent-running craft. Battery-only silent running extends mission envelopes, reduces detection risk, and aligns with net-zero mandates for government fleets.
Passenger-ferry tenders in California, Greece, and Japan now specify battery propulsion as a prerequisite, reinforcing baseline demand. Inland barges on river corridors in China and the United States provide another commercial growth pocket. On the military side, lithium-ion packages in new-generation submarines and the first battery-boosted destroyers validate high-energy chemistries under extreme duty cycles, creating spill-over confidence for commercial owners.
By Function:
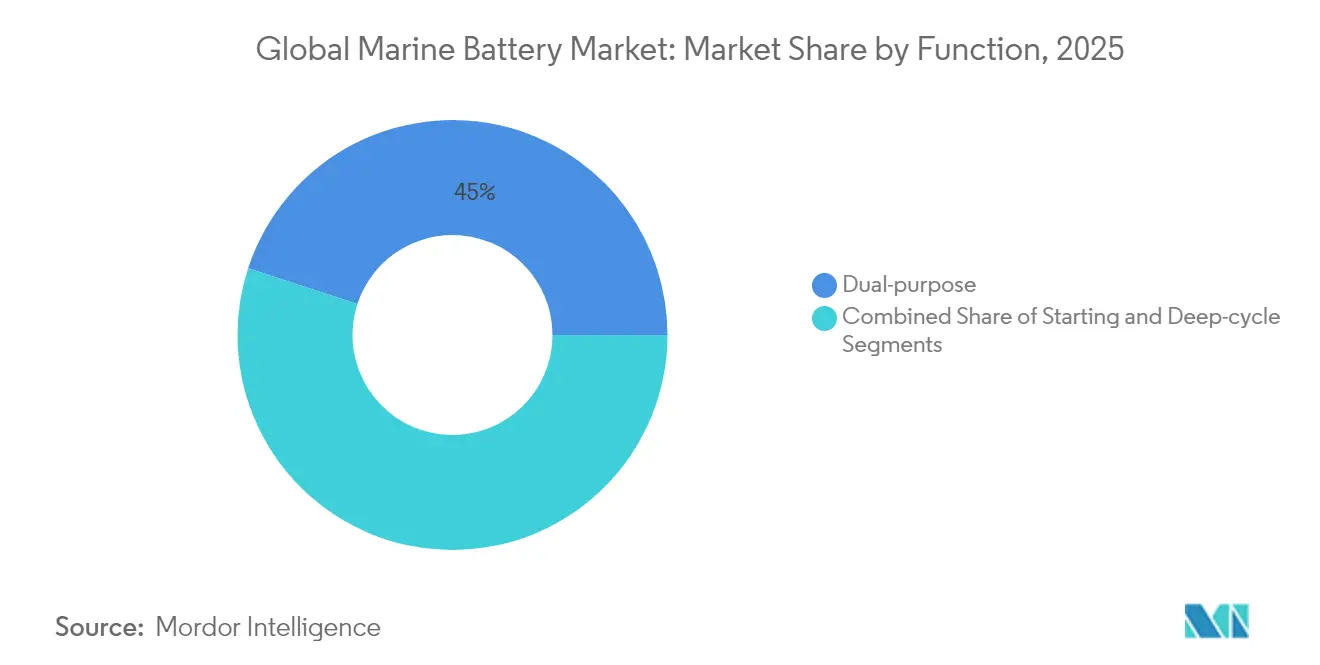
Dual-Purpose Packs Streamline InstallationsDual-purpose systems that handle both starting and deep-cycle duties represented 44.98% of revenue in 2025 and are growing at a 11.15% CAGR. The marine battery market values space and weight savings from consolidating separate starters and house banks into a single modular rack. Modern battery-management software balances charge profiles and prevents premature ageing. Operators gain lower weight, easier wiring, and shorter installation time.
Deep-cycle-only packs hold steady in cruise ships where hotel loads dwarf propulsion demand, but dual-purpose packs will dominate workboats, ferries, and tugs. Classification approvals for multi-role lithium iron phosphate modules signal broad acceptance. As a result, the marine battery market will see faster adoption among small-to-mid vessels that lacked space for separate banks in the past.
By Capacity Range:
1–5 MWh Is the Market’s Center of GravitySystems between 1 MWh and 5 MWh captured a 54.10% share of the marine battery market size in 2025 and grew at a 9.28% CAGR. This capacity fits most ferry crossings, offshore service duty cycles, and barge missions. Containerized skids speed up yard work and allow bolt-on additions during future refits. Above 5 MWh, engineering complexity escalates; only offshore wind service vessels and small container ships currently justify those packs.
Under-1 MWh systems power harbor craft, pilot boats, and emergency hotel loads. Although numerous in unit terms, they add less value. The mid-scale bracket, therefore, attracts the greatest manufacturing focus, driving down cost per kilowatt-hour and cementing its dominance within the marine battery market.
Geography Analysis
Europe Marine Battery Market
Europe commanded 42.20% revenue share in 2025 owing to legally binding greenhouse-gas caps and generous port subsidies. The marine battery market in the bloc benefits from a dense short-sea network where ferries and feeders call at ports several times a day, making shore-charging practical. Northern Europe tops early adoption, yet Mediterranean yards are now inserting battery rooms into cruise-ferry newbuilds to meet the 2030 berth-emission rule.
APAC Marine Battery Market
Asia-Pacific posts the fastest 11.36% CAGR for the marine battery market, led by China’s zero-carbon Yangtze program and the launch of a 50 MWh electric container ship. South Korean and Japanese yards contribute design know-how and domestic lithium supply. ASEAN countries follow, with Malaysia’s planned Johor plant targeting regional demand for fishing boats, tugs, and inter-island ferries.
North America, LATAM and MEA Marine Battery Market
North America shows steady growth on the back of defense contracts and state ferry upgrades in Washington, Alaska, and New York. Inland waterways add further momentum, as barge operators trial battery push-boats on fixed grain and coal routes. Latin America and Africa remain small today but possess lithium resources and new port modernization plans that could lift long-term uptake. Middle Eastern offshore operators also explore battery-hybrid service craft to cut emissions near rigs.

Regulatory Landscape
Marine battery installations are increasingly governed by classification-society rules and safety codes layered on top of SOLAS and the IMDG Code, with prescriptive requirements for battery-space protection, ventilation, gas detection, and environmental controls. In April 2024, ABS updated its Requirements for Use of Lithium-ion Batteries in the Marine and Offshore Industries, reinforcing risk-assessment and system-design expectations that feed into approval timelines and the cost of marine-certified packs.
In Asia, Korean Register (KR) has tightened the compliance bar through its Guidance for Battery Systems Onboard Ships, with mandatory compliance applying to construction contracts signed on or after 1 July 2026. Standardization is also moving ahead at the equipment level, with ISO 18962:2026 defining installation and operational requirements for swappable batteries on ships, supporting more repeatable designs and clearer interfaces for operators, shipyards, and integrators.
Value Chain Analysis
The marine battery value chain spans upstream cell supply, marine-grade module and rack design, system integration, and through-life services tied to certification and onboard power management. Large cell and battery suppliers (for example, BYD Energy Storage) supply pack builders and marine specialists, while integrators such as Corvus Energy, Wärtsilä, and Siemens package batteries into complete propulsion and power systems, typically retaining electrical integration, safety engineering, and class-approval documentation.
Downstream, shipyards and vessel OEMs bring turnkey energy storage into newbuild or retrofit scopes, while operators and ports shape specifications through charging constraints and berth-emissions requirements. Recent cooperation models, such as Corvus Energy aligning with BYD Energy Storage on next-generation LFP marine systems, show how integrators use supply and co-development agreements to stabilize lead times, improve cost positioning, and scale standardized platforms across ferries, workboats, and offshore vessels.
Competitive Landscape
Industry estimates indicate that the leading five companies collectively manage about half of the globally installed marine battery capacity. Corvus Energy remains the reference brand for high-capacity packs, having secured deals for hybrid tugs in the Panama Canal and a 25 MWh offshore vessel system. Siemens, Wartsila, and Rolls-Royce Power Systems wrap batteries into integrated propulsion packages, leveraging global servicing footprints.
Automotive giants such as CATL and BYD are entering through joint ventures with shipbuilders, promising mass-production scale and cost advantages. EST-Floattech, Echandia, and Shift carve niches by tailoring packs to smaller workboats and ferries with rapid delivery and specialized marine safety features. Competitive focus increasingly lies in thermal management, plug-and-play modularity, and class-friendly documentation rather than raw cell chemistry.
Joint development programs with yards and port authorities are emerging as a strategic lever. Vendors that can assure spare-part pipelines, 24 × 7 remote monitoring, and training services gain customer stickiness. Over the next five years, consolidation may rise as larger OEMs acquire niche pack integrators to fill technology gaps and secure footholds in the expanding marine battery market.
Global Marine Battery Industry Leaders
Siemens AG
Wartsila Corporation
Corvus Energy
EST-Floattech B.V
Akasol AG
- *Disclaimer: Major Players sorted in no particular order
Global Marine Battery Market Companies Covered in this Report
- Corvus Energy
- Siemens AG
- EST-Floattech B.V
- Wartsila Corporation
- Akasol AG
- Saft Batteries
- EnerSys
- Tesvolt Ocean GmbH
- AYK Energy
- Leclanche SA
- Shift Clean Energy (PBES)
- Echandia Marine
- CATL Marine
- Kokam (SolarEdge)
- Rolls-Royce Power Systems (MTU)
- ABB Ltd

Market Opportunities and Future Outlook
Large, mission-defined vessels are expanding use of batteries beyond short-sea ferries into higher-duty applications, where hybridization and high-rate charging support operational gains. Evidence includes offshore wind support and commissioning vessels adopting battery-hybrid architectures, as well as research and ice-class use cases such as the Polarstern program specifying a 16 MWh battery system for silent and low-emission scientific operations, which broadens the range of vessels that justify multi-megawatt-hour packs.
Opportunity is also centering on industrialization and modularity, supported by partnerships that combine marine integration know-how with scaled cell supply. Corvus Energy and BYD Energy Storage signed a strategic cooperation agreement in May 2026 to advance next-generation LFP maritime battery technology, and modular product approaches such as Lehmann Marine AQUBE/CUBE enable scaling from kWh-class systems to multi-MWh configurations across different vessel types. Alongside tightening class guidance, including KR making its battery-system guidance mandatory for certain contracts signed from 1 July 2026 and ISO 18962:2026 for swappable batteries, these shifts create room for standardized, certifiable platforms, faster project replication across fleets, and service-led offerings such as monitoring, spares, and safety upgrades.
Recent Industry Developments in Global Marine Battery Market
- June 2026: Corvus Energy scheduled delivery of battery systems for an electric tugboat for NYK Line. The scheduled delivery signals growing electrification of large work-vessel segments in offshore and port operations. The move reinforces Corvus’s position in high-capacity marine packs for tugs and expands NYK’s electrified service portfolio.
- June 2026: Corvus Energy announced a record-breaking order for seven fully electric ferries for Caledonian Maritime Assets Limited in Scotland. The order demonstrates scale-up of fully electric ferry deployments in public fleets. It catalyzes CMAL’s fleet electrification program and validates Corvus as a supplier for large-scale passenger vessel electrification.
- May 2026: Corvus Energy signed Strategic Cooperation Agreement with BYD Energy Storage to co-develop LFP marine battery systems. The partnership reinforces integration of LFP chemistries in maritime batteries and accelerates supply-chain collaboration. It expands access to BYD’s storage technology for marine applications and could lower cost and lead times for future shipyards.


Global Marine Battery Market Report Scope and Research Methodology
Market Definition and Coverage
The marine battery market is defined as the revenue generated from batteries and battery packs that are purpose-built or specified for use on boats and ships, where they supply onboard power or support electric and hybrid propulsion.
Scope exclusions: This scope excludes shore-side charging infrastructure, vessel power electronics outside the battery pack, and non-marine battery sales that are not deployed on marine vessels.
Segments Covered in This Report
- By Battery Type
- Lithium-ion
- LFP
- NMC/NCA
- LTO
- Lead-acid
- Nickel-cadmium
- Fuel Cell (PEM, SOFC)
- Solid-state
- Lithium-ion
- By Propulsion Type
- Hybrid Electric
- Fully Electric
- Auxiliary / Hotel Loads
- By Ship Type
- Commercial
- Ferries & RoPax
- Cargo & Container
- Offshore Support & Wind SOV
- Inland Waterway & Barges
- Passenger & Leisure Craft
- Defense
- Naval Surface Combatants
- Submarines & UUVs
- Commercial
- By Function
- Starting
- Deep-cycle
- Dual-purpose
- By Capacity Range
- Less than 1 MWh
- 1 - 5 MWh
- Greater than 5 MWh
- By Geography
- North America
- United States
- Canada
- Rest of North America
- South America
- Brazil
- Chile
- Rest of South America
- Europe
- Germany
- United Kingdom
- France
- Italy
- Spain
- Rest of Europe
- Asia-Pacific
- China
- Japan
- South Korea
- India
- Australia
- Rest of Asia-Pacific
- Middle East and Africa
- United Arab Emirates
- Saudi Arabia
- Israel
- South Africa
- Rest of Middle East and Africa
- North America
Data Sources, Market Sizing, and Validation
Desk Research
Desk work starts with mapping the demand side for marine power and propulsion, and then linking it to battery adoption signals and technical constraints. We rely on public, non-paywalled sources such as International Maritime Organization publications, International Energy Agency energy transition materials, and World Bank and UN trade statistics that help cross-check maritime activity and electrification direction.
To ground assumptions, additional checks are pulled from sources such as national transport and energy agencies, port authority releases on shore power readiness, and classification society guidance notes and safety rules for onboard energy storage. Company filings, investor presentations, and reputable maritime press are used to understand product positioning, pricing direction, and where deployments are happening. A paid subscription for company financials and news and a patent database are also used selectively to confirm activity levels and technology focus. These desk sources are illustrative and not exhaustive, and many other public references are reviewed to collect, validate, and clarify the data used in the model.
Primary Interviews and Surveys
Primary work is used to validate what desk sources cannot show clearly, especially adoption timing, typical pack sizing, and pricing behavior by vessel type and duty cycle. We speak with a mix of battery ecosystem participants, marine integrators, shipyard-linked experts, and vessel operators across major regions, so assumptions on retrofits, newbuild fitment, and replacement cycles can be aligned to real buying patterns.
Distribution of primary research fieldwork respondents
| Company type | Respondent position | Region |
|---|---|---|
| Top tier: 36% | CXOs: 13% | APAC: 52% |
| Mid tier: 45% | Functional/Unit leaders: 33% | EMEA: 29% |
| Smaller Players: 19% | Managers: 54% | Americas: 19% |
Market-Sizing & Forecasting
Sizing is built using a top-down demand pool approach where vessel activity and electrification adoption are reconstructed through marine fleet additions, retrofit intensity, and the share of electric and hybrid propulsion across key vessel classes, and then translated into battery value. The totals are corroborated with selective bottom-up approximations, including sampled pack price per kWh times estimated installed kWh per vessel, plus channel checks on typical order sizes, before the final numbers are locked.
Key inputs used in the model include indicative battery chemistry mix (lead-acid versus lithium-based), average installed capacity ranges for common use cases (hotel loads versus propulsion support), replacement cycles driven by duty profile, and observed pricing direction by capacity class. Where public series are thin, gaps are handled by using interview-led ranges, then applying conservative mid-points that are stress-tested against known build rates and retrofit announcements.
For forecasting, scenario analysis is used so the outlook can reflect different speeds of maritime decarbonization, port electrification readiness, and battery cost progression. Assumptions are adjusted only after primary feedback is consistent across multiple respondent types and geographies, and then the updated drivers are rolled forward year by year.
Data Validation & Update Cycle
Validation is done in a few passes so the outputs do not rely on a single set of assumptions. We compare results against independent signals such as regional vessel delivery trends, announced electrification programs, and typical capacity sizing discussed in safety and regulatory guidance, and then any large variances are reviewed and corrected before sign-off.
If an input moves sharply, such as battery pricing, regulatory timelines, or retrofit activity, the team re-contacts sources to confirm whether it is a short-term swing or a structural change. Reports are refreshed annually, with interim updates when material events occur, and a final review is performed right before delivery so clients receive the latest updated view.
Mordor Intelligence's Marine Battery Market Size Compared Against Other Published Estimates
Published market values for marine batteries can differ widely because each publisher draws the line around products and use cases in a different way, and then updates assumptions on adoption and pricing at different times. The main differences usually come from what is counted as marine-only versus adjacent vessel energy storage items, plus the year used as the starting point and the currency timing used for conversions.
The spread often becomes larger when estimates fold in shore-side equipment, broader vessel energy storage hardware, or non-propulsion battery demand that is not tied to a defined marine install base. The table points to this gap, where counting only batteries and packs installed on vessels, and refreshing pack price per kWh and fitment timing based on recent ferry and workboat deployments, explains why the baseline lands where it does for Mordor Intelligence.
Benchmark comparison
| Source | Market Size | Gaps in Research Methodology |
|---|---|---|
| Mordor Intelligence | USD 0.90 B (2025) | |
| Global Consultancy A | USD 0.88 B (2024) | Uses a different base year and can be closer to shipment timing for the prior year, and in some cases treats pilot deployments as full-year demand without smoothing for commissioning and utilization lag. |
| Trade Journal B | USD 0.62 B (2030) | Appears to track a narrower set of applications and slower uptake assumptions, which can undercount hybrid propulsion retrofits and higher-capacity packs used in commercial workboats and ferries. |
Overall, the comparison shows that the biggest driver is scope and timing, not a single magic variable. By keeping the demand pool tied to vessel installations and checking it against pack sizing and realistic adoption schedules, the resulting market size stays traceable to repeatable steps and practical inputs.


Key Questions Answered in the Report
What is the projected marine battery market size by 2031?
The marine battery market size is forecast to reach USD 1.45 billion by 2031, growing at an 8.29% CAGR over 2026-2031.
Which battery chemistry dominates ship applications today?
Lithium-ion packs hold 65.62% revenue share thanks to established supply chains, proven ferry retrofits, and falling cell prices.
Why do many operators start with hybrid instead of full electric propulsion?
Hybrid systems reduce fuel use by up to 25.0% while preserving diesel range, offering an easier first step toward full electrification as shore-charging networks expand.
Which region shows the fastest growth for marine batteries?
Asia-Pacific is set to post a 11.36% CAGR, driven by China’s inland-waterway plans, Japanese shipbuilder innovations, and new manufacturing capacity in Southeast Asia.
Page last updated on:


 Your data is secure and never sold or shared.


