
Marble Market Size and Share
Market Overview
| Study Period | 2020 - 2031 |
|---|---|
| Market Size (2026) | USD 24.03 Billion |
| Market Size (2031) | USD 30.11 Billion |
| Growth Rate (2026 - 2031) | 4.61 % |
| Fastest Growing Market | Asia Pacific |
| Largest Market | Asia Pacific |
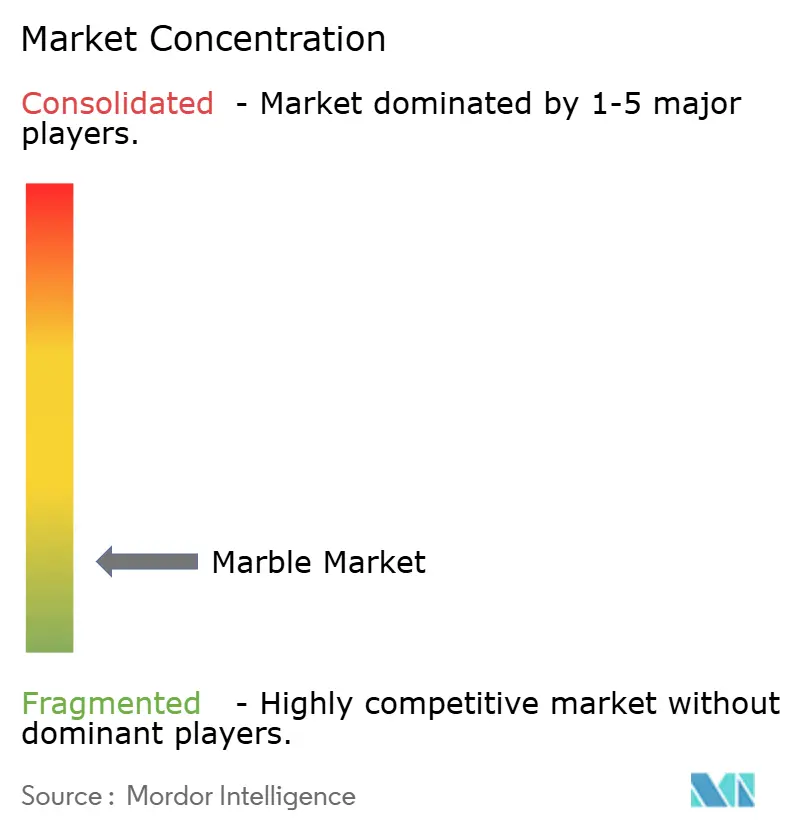
| Market Concentration | Low |
Major Players *Disclaimer: Major Players sorted in no particular order Image © Mordor Intelligence. Reuse requires attribution under CC BY 4.0. | |
Marble Market Analysis by Mordor Intelligence
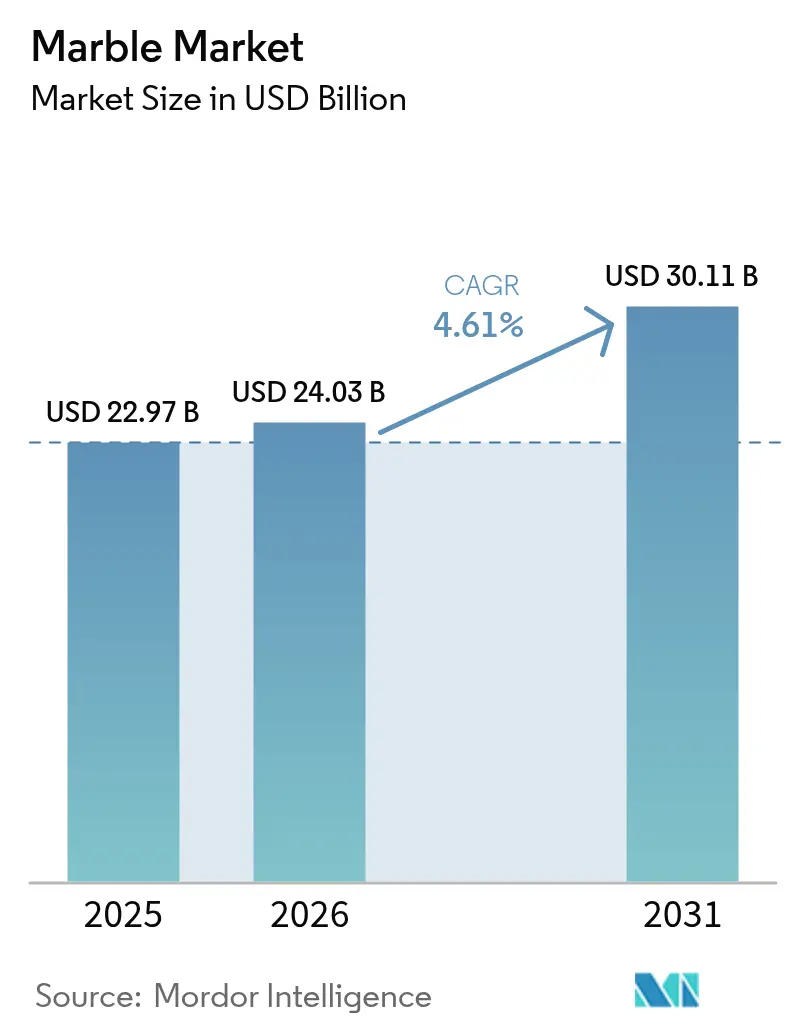
The Marble Market size was valued at USD 22.97 billion in 2025 and estimated to grow from USD 24.03 billion in 2026 to reach USD 30.11 billion by 2031, at a CAGR of 4.61% during the forecast period (2026-2031). Growth in Asia-Pacific, where the marble market is driven by rapid urban expansion and infrastructure spending, is predicted to outpace all other regions at a 6.16% CAGR. Intensifying consolidation among established quarriers and processors is intersecting with agile technology-led entrants that apply digital extraction, water recycling, and predictive maintenance to cut costs and waste. At the same time, stricter silica-dust regulations are reshaping operating practices and capital budgets, particularly in North America and Europe.
Key Report Takeaways
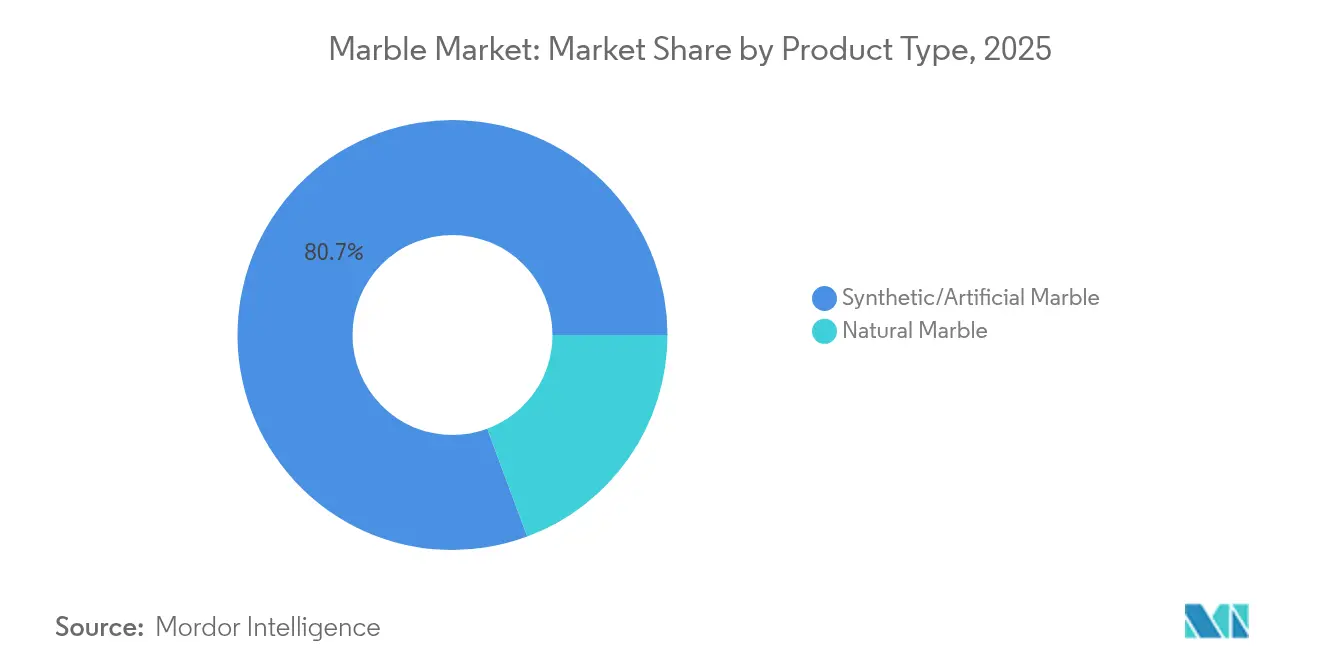
- By product type, synthetic marble led with 80.65% of marble market share in 2025 and is expected to post a 4.72% CAGR through 2031, slightly ahead of total market growth.
- By color, white marble accounted for 36.02% of the marble market size in 2025 and is projected to expand at a 5.60% CAGR to 2031.
- By application, construction and decoration captured 56.72% of the marble market in 2025 and is expected to grow at a CAGR of 5.28%.
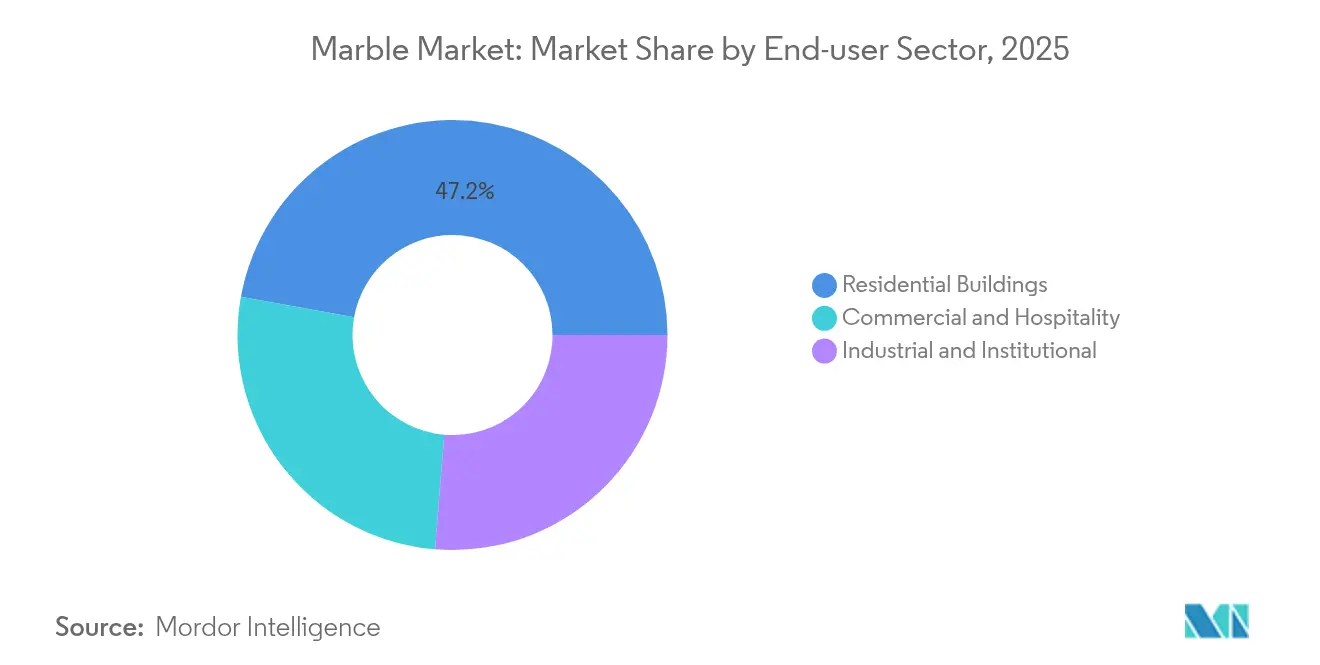
- By end-user sector, residential buildings held 47.15% marble market revenue share in 2025; commercial and hospitality facilities are forecast to register the fastest 4.86% CAGR through 2031.
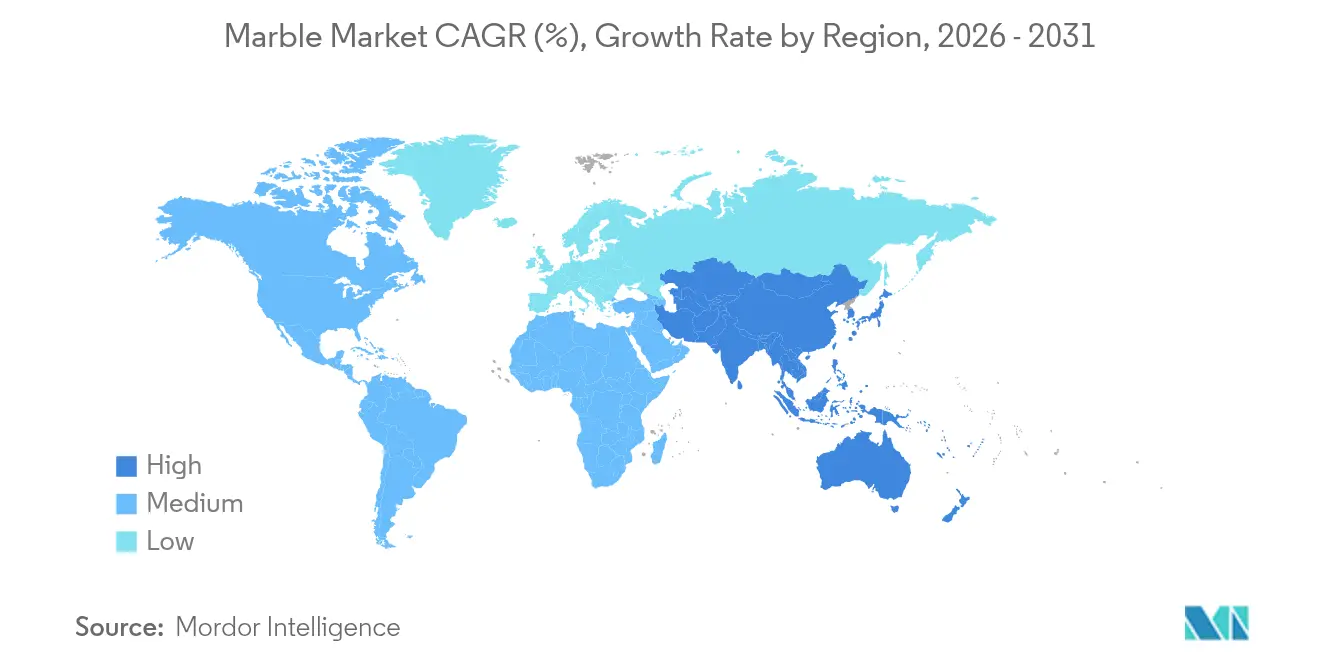
- By geography, Asia-Pacific occupied 33.62% of the marble market in 2025 and is set to remain the highest-growth region at 6.10% CAGR to 2031.
Note: Market size and forecast figures in this report are generated using Mordor Intelligence’s proprietary estimation framework, updated with the latest available data and insights as of 2026.
Market Trends and Insights
Drivers Impact Analysis of Marble Market*
| Drivers | (~) % Impact on Market CAGR Forecast | Geographic Relevance | Impact Timeline |
|---|---|---|---|
| Rapid Growth in the Construction Industry | +1.8% | Global, with a concentration in Asia-Pacific | Medium term (≈3-4 yrs) |
| Increase in Luxury Real Estate and Infrastructure Projects | +1.2% | North America, Europe, Middle East | Medium term (≈3-4 yrs) |
| Rising Adoption of Marble Powder as SCM | +0.8% | Global, with early adoption in Europe | Long term (≥5 yrs) |
| Growing Inclination on Marble as a Natural Material | +0.6% | North America, Europe | Medium term (≈3-4 yrs) |
| Technological Advancements in Extraction and Processing | +1.5% | Global, with a concentration in developed markets | Medium term (≈3-4 yrs) |
| Source: Mordor Intelligence | |||
Rapid Growth in the Construction Industry
Construction spending is cascading into higher marble demand as developers specify premium stone for floors, walls, and countertops in luxury homes and mixed-use towers. Governments across Asia-Pacific continue to funnel budget into transport hubs and civic buildings that feature large-format stone cladding, lifting structural as well as decorative usage. Prefabricated marble panels, factory-cut to tight tolerances, are saving installation time and reducing on-site breakage, helping contractors meet schedule guarantees. Thin 3-5 mm veneers are opening high-rise façades to lighter loads, and marble-concrete composites are appearing in projects seeking green-building certifications due to weight and embodied-carbon advantages, supporting the growth in the marble market.
Increase in Luxury Real Estate and Infrastructure Projects
Luxury hospitality groups and premium office developers are turning to distinctive stone to craft memorable entrances, wellness areas, and dining venues. Designers working on five-star hotels in Dubai, Singapore, and New York specify statement slabs with dramatic veining because natural variance signals exclusivity to guests. Boutique brands extend the same ethos to small properties, boosting demand for rare colors that differentiate from engineered look-alikes, reflecting growth in the marble market.
Rising Adoption of Marble Powder as Supplementary Cementitious Material
Carbon-reduction targets are prompting cement producers to substitute up to 15% of clinker with finely ground marble waste, delivering both lower emissions and stronger concrete. Laboratory trials show compressive strength gains of 25.6% at 10% replacement, while chloride penetration drops sharply, extending the service life of marine and bridge structures. Predictive machine-learning models now enable mix designers to forecast performance with R² values above 0.98, accelerating commercial adoption. Producers of marble market in Spain, Germany, and Japan are installing dedicated grinding lines to valorize quarry fines that were previously landfilled.
Technological Advancements in Extraction and Processing
Computer numerical control saws and robotic polishers fitted with smart sensors cut marble blocks with micron-level accuracy while minimizing off-cuts. Energy-and-exergy audits at modern Italian plants report efficiency rates of 87.43% after tuning spindle speed and coolant flow. Closed-loop water filtration yields an 80% reduction in make-up water demand, easing compliance with local discharge limits. Early adopters enjoy lower unit energy cost and market their greener profile to architects selecting materials for LEED and BREEAM projects, ein the marble market.
Restraints Impact Analysis of Marble Market*
| Restraints | (~) % Impact on Market CAGR Forecast | Geographic Relevance | Impact Timeline |
|---|---|---|---|
| Health Hazard Related to Marble Dust | -1.2% | Global, with a stricter impact in North America and Europe | Short term (≤2 yrs) |
| Competition from Synthetic Alternatives | -1.4% | Global | Medium term (≈3-4 yrs) |
| Waste Generation and Recycling Challenges | -0.7% | Global, with higher impact in major producing regions | Long term (≥5 yrs) |
| Source: Mordor Intelligence | |||
Health Hazard Related to Marble Dust
Respirable crystalline silica generated during cutting and polishing is under heightened scrutiny after California recorded 127 silicosis cases and 13 fatalities by April 2024, prompting new exposure limits and mandated wet-cutting protocols. Although natural marble contains less than 10% silica, regulators are applying similar controls across all stone operations. Compliance costs include enclosed workstations, high-vacuum extraction, and personal monitoring systems, pressuring small fabricators that lack the capital to upgrade in the marble market.
Competition from Synthetic Alternatives
Engineered marble and quartz surfaces keep capturing share because of uniform color, stain resistance, and thinner profiles fit modern aesthetics and industrial scale production. Manufacturers now deliver ultra-thin 6 mm slabs and book-matched patterns that imitate quarry blocks without natural imperfections. Pricing remains favorable thanks to automated resin casting and lower transport weight, undercutting many mid-range natural stones. Traditional marble suppliers answer by emphasizing geological uniqueness, provenance, and craftsmanship to retain luxury buyers, yet volume continues to migrate to synthetics and dynamics in the marble market
*Our forecasts treat driver/restraint impacts as directional, not additive. The impact forecasts reflect baseline growth, mix effects, and variable interactions.
Marble Market Segment Analysis
By Product Type:
Synthetic Strength, Natural NicheSynthetic grades dominated 80.65% of the marble market in 2025 as industrial resin systems reproduced the look of premium Carrara and Calacatta while providing hardness and stain resistance. The segment is projected to extend leadership at a 4.72% CAGR, supported by home-center channels and accelerated fabrication. Natural marble stays relevant in projects where authenticity and long-term patina outweigh maintenance concerns. Designers of flagship hotels and bespoke residences still specify large blocks for reception desks, staircases, and sculpture. Countries such as Brazil have improved quarry yield through wire saws and drone mapping, bringing new white marble varieties to global showrooms.

By Color:
White Marble’s Timeless PremiumWhite stones captured 36.02% of demand in 2025 and are on track for a 5.60% CAGR through 2031, significantly above the marble market. Designers cite neutrality, light reflectance and association with classical architecture as key reasons for preference, particularly in wellness spas and minimalist corporate lobbies. The marble market size for white varieties is expanding in China and the Gulf, where bright interiors counter hot climates.
Black marbles, led by Nero Marquina, secure orders for contrast features in retail flagships and penthouse kitchens. Yellow, red, and green types cater to regional tastes in the Middle East and parts of Asia, often tied to local cultural symbolism. Multicolored and brecciated stones attract avant-garde architects seeking statement walls. Color choice is increasingly curated through digital twin libraries that allow clients to preview entire slabs at the design stage, reducing uncertainty and waste.
By Application:
Construction Mass, Decorative ValueConstruction and decoration remained the backbone, delivering 56.72% of marble market revenue in 2025 and projected to climb at a 5.28% CAGR. Flooring, wall cladding, and countertops account for bulk volume, while prefabricated panels introduce factory precision that trims site labor and speeds high-rise envelope completion.
Statues and monuments sustain steady demand linked to civic memorials and religious architecture, supporting specialty sculptors. Furniture makers rediscover marble as both a structures and an accent material, blending it with metal and wood in contemporary tables and lighting. Novel usage in 3D-printed décor leverages waste fines blended with biodegradable PLA, pointing to a potential circular line of business.
By End-user Sector:
Residential Base, Commercial UpsideHomeowners continue to favor marble in kitchens and bathrooms because stone is perceived to boost property value. The segment held 47.15% of consumption in 2025 and remains a stable foundation for producers and fabricators. Growth is moderating in many mature markets, yet kitchen remodeling activity in the United States and Europe offers constant replacement demand.
Commercial and hospitality spaces are the fastest-growing buyers at 4.86% CAGR. Hotel brands create Instagram-friendly interiors that rely on dramatic stone backdrops, and co-working firms differentiate offices with natural materials that support occupant wellness. Institutional buyers, including universities and hospitals, specify marble for high-traffic areas that require durability and easy sanitation. These sectors value lifecycle cost benefits, bolstering case studies that support budget approvals.
Geography Analysis
APAC Marble Market
Asia-Pacific held 33.62% of the marble market in 2025 and is forecast to post the highest 6.10% CAGR. India’s smart-city roll-out and Indonesia’s new capital development add fresh demand for flooring and façade stone. Producers in Vietnam and Pakistan are expanding quarry output to meet regional specifications.
Europe Marble Market
Europe is anchored by Italy and Turkey. Carrara delivers iconic whites, yet waste remains a pain point, with up to 70% of extracted mass discarded as sludge. Regulation and social pressure are catalyzing investment in water recycling, dry shaping, and waste-to-product initiatives such as marble-based 3D printing filament. German and Spanish processors market verified low-emission stone to architects pursuing green certifications.
North America Marble Market
North America maintains premium pricing and a tight supply of distinctive varieties. Demand centers on luxury residential towers, boutique hotels, and upmarket retail.
South America and MEA Marble Market
South America is emerging as a supply hub, with Brazil’s white quartzites and marble winning specifications in US and European projects. The Middle East and Africa show robust demand linked to mega-projects in Saudi Arabia, the United Arab Emirates and South Africa.
Mordor Intelligence provides coverage of the marble market across other key regional markets. Detailed country-level analysis extends to China incorporating local coverage and market participation, as required.
Value Chain Analysis
The marble value chain begins with resource identification and quarry licensing, followed by extraction (drilling, wire-saw cutting, block handling) and primary processing such as gang sawing, resin treatment, and calibration. Downstream conversion then covers slab distribution, fabrication into tiles, countertops, and panels using CNC cutting and polishing, and final project installation through contractor and fabricator networks for residential buildings and commercial and hospitality projects.
Value capture increasingly shifts toward processors and fabricators that can control quality, lead times, and compliance. This is most visible where silica-dust controls require wet cutting, enclosed workstations, and high-vacuum extraction. Logistics and breakage also stay central cost drivers, since blocks and slabs are heavy and brittle. Technology upgrades such as robotic polishers, sensor-led predictive maintenance, and closed-loop water filtration (noted as cutting make-up water demand by 80% in modern operations) reduce scrap and improve throughput, widening the cost gap between automated plants and small workshops.
Competitive Landscape
The marble market is highly fragmented, yet concentration is slowly rising as integrated quarries acquire regional fabricators to ensure channel control. Leading operators secure exclusive rights to premium deposits and invest in multi-wire saws, CNC routers, and automated polishers that cut defects and energy use. Energy-efficient lines demonstrate 87.43% efficiency after process optimization, creating cost gaps that smaller rivals struggle to match.
Marble Industry Leaders
-
Fox Marble
-
Antolini Luigi & C. S.p.a.
-
Mohawk Industries, Inc.
-
Polycor Inc.
-
Levantina y Asociados de Minerales, S.A.
- *Disclaimer: Major Players sorted in no particular order
Marble Market Companies Covered in this Report
- Antolini Luigi & C. S.p.a.
- BC Marble Products Ltd
- Best Cheer Stone Group
- China Kingstone Mining Holdings Limited
- Dimpomar
- Eco Buildings Group Plc
- F.H.L.
- Fox Marble
- HELLENIC GRANITE Co
- Hilltop Stones Pvt. Ltd.
- Kangli stone group
- Levantina y Asociados de Minerales, S.A.
- Mohawk Industries, Inc.
- Mumal Marbles Pvt. Ltd.
- NQ Acrylic and Stone
- Polycor Inc.
- Santucci Group Srl
- TEKMAR MERKEZ OF?S
- Temmer Marble
- Topalidis S.A.
- UMGG
- XISHI GROUP LTD.
Market Opportunities and Future Outlook
Circular use of marble waste is a clear whitespace area, shaped by policy and industry initiatives such as the EU Circular Economy Action Plan. It supports circular approaches to mineral waste, including marble fines, and creates demand for grinding and classification lines near quarrying and cutting hubs to convert sludge and off-cuts into standardized inputs for concrete producers.
A second opportunity centers on higher-performance, compliance-ready fabrication and prefabrication. As construction and decoration demand expands, growth in thin veneers and prefabricated panels favors players that deliver tighter tolerances, lower breakage, and verifiable workplace controls for dust and water. In North America, Polycor's 2024 USD 15 million investment across facilities in Quebec and Indiana highlights modernization efforts tied to more integrated, digital, and automated processing, which supports premium residential and hospitality segments.
Recent Industry Developments in Marble Market
- April 2026: Fireclay Tile completed the acquisition of Richmond, California-based Fox Marble, adding a 50,000 sq. ft. stone fabrication facility and expanding in-house installation capabilities. This acquisition strengthens vertical integration from surfacing specification through fabrication and field execution, helping tighten lead times and quality control for high-end projects.
- November 2025: Polycor announced an agreement to sell its business in France to HBI (parent of Iribarren Pierres Naturelles). The divestment simplifies Polycor's footprint and reallocates management focus and capital toward North American operations in natural stone.
- October 2024: Polycor disclosed a USD 15 million investment in advanced manufacturing across its facilities in Quebec and Indiana, including marble processing units. The upgrades in processing capability and automation are geared toward higher throughput and more consistent product quality for architectural and construction customers.
Marble Market Report Scope and Research Methodology
Market Definition and Coverage
For this study, the marble market is defined as the value of marble products sold for use in construction and decorative applications, covering natural marble and synthetic or artificial marble across major consuming regions.
Scope exclusions: We exclude installation labor, adhesives and grouts, sealants, tools, and broader natural stone categories that are not sold as marble.
Segments Covered in This Report
- By Product Type
- Natural Marble
- Synthetic/Artificial Marble
- By Color
- White
- Black
- Yellow
- Red
- Other Colors
- By Application
- Building and Construction
- Statues and Monuments
- Furniture
- Other Applications (Decorative Infrastructure)
- By End-user Sector
- Residential Buildings
- Commercial and Hospitality
- Industrial and Institutional
- By Geography
- Asia-Pacific
- China
- India
- Japan
- South Korea
- Rest of Asia-Pacific
- North America
- United States
- Canada
- Mexico
- Europe
- Germany
- United Kingdom
- France
- Italy
- Turkey
- Rest of Europe
- South America
- Brazil
- Argentina
- Rest of South America
- Middle-East and Africa
- Saudi Arabia
- South Africa
- Rest of Middle-East and Africa
- Asia-Pacific
Data Sources, Market Sizing, and Validation
Desk Research
Desk research was used to map the supply chain from quarrying to processing, fabrication, and distribution, and to set initial assumptions for volumes and pricing. Public sources such as UN Comtrade trade statistics, national geological surveys (for example, USGS-style mineral summaries), construction output and housing indicators from the World Bank and national statistics offices, and standards references (such as ASTM and ISO guidance that is publicly summarized) helped us align marble flows with where demand forms in practice. We also reviewed technical papers and journals to understand typical product forms, thickness norms, and quality parameters that influence pricing.
To convert these signals into a usable market model, we cross-checked the trade and production context with company filings, investor presentations, and reputable trade press on capacity additions, project pipelines, and pricing pressure in key regions. In a few cases, paid subscriptions were used for company financials and intelligence, shipment-level import and export checks were reviewed, and patent databases were scanned to spot material shifts and product innovation. The sources listed here are illustrative rather than exhaustive, and we relied on other public documents to collect data, validate assumptions, and clarify open questions.
Primary Interviews and Surveys
Primary interviews and surveys were carried out with stakeholders across the chain, including quarry operators, processors, fabricators, distributors, contractors, and procurement teams that specify stone for projects. These interviews helped confirm how synthetic versus natural marble is purchased, how quotes are built (including finishing and wastage), and how demand moves by project type and region, so that desk research assumptions could be adjusted before finalizing totals.
Distribution of primary research fieldwork respondents
| Company type | Respondent position | Region |
|---|---|---|
| Top tier: 29% | CXOs: 15% | APAC: 49% |
| Mid tier: 53% | Functional/Unit leaders: 36% | EMEA: 32% |
| Smaller Players: 18% | Managers: 49% | Americas: 19% |
Market-Sizing & Forecasting
Market sizing starts with a top-down and bottom-up model structure, where a top-down build reconstructs demand from construction activity and stone-use intensity, and is then translated into marble value using realistic price bands for natural and synthetic grades. For example, we track inputs such as residential and non-residential floor area additions, renovation direction, import reliance for slabs and blocks, the typical mix between natural and synthetic marble, and observed price movement by finish and thickness. Since marble demand is project-led, we also consider indicators like premium housing starts, commercial fit-out cycles, and public infrastructure awards that pull decorative stone into the market.
Those totals are then checked using selective bottom-up approximations, where supplier and channel feedback is used to validate volume ranges and average selling prices in each region. When primary inputs showed gaps, such as limited visibility on small fabricators or local trading, we adjusted the bottom-up checks using import penetration signals and distributor throughput estimates rather than forcing a complete roll-up. Forecasting is built using scenario analysis supported by near-term construction outlook and price expectations shared by interviewed experts, and it is refined with year-by-year adjustments for expected mix shifts between natural and synthetic marble.
Data Validation & Update Cycle
Validation is done through repeated cross-checks across independent signals, so the final totals align with the direction of trade flows, construction activity, and industry feedback at the same time. Analysts review outliers such as sudden ASP jumps, unrealistic region shares, or growth rates that do not match construction cycles, and then the underlying assumptions are revisited and re-tested. If a major variance is found, respondents are re-contacted to confirm what changed, such as a policy shift, a construction slowdown, or a material substitution trend.
Reports are refreshed annually, and interim updates are made when material events occur that can move demand or pricing. Before delivery, we run a final pass to ensure the latest public statistics and the newest primary inputs are reflected in the model outputs.
Mordor Intelligence's Marble Market Estimate Compared With Other Published Estimates
Published marble market numbers often differ because the counted product set and pricing layers are not the same, even when the titles look identical. Differences also come from how synthetic marble is treated, what form factors are included (blocks, slabs, tiles, and fabricated pieces), and whether values are stated at producer level or closer to the installed project price.
Some published estimates bundle a wide set of construction surface materials or add large downstream layers like fabrication and installation margins. In the Mordor Intelligence approach, the value is limited to natural marble plus synthetic or artificial marble products, and it stays tied to construction output signals, trade flows, and primary checks on price by finish and thickness.
Benchmark comparison
| Source | Market Size | Gaps in Research Methodology |
|---|---|---|
| Mordor Intelligence | USD 22.97 B (2025) | |
| Global Consultancy A | USD 73.03 B (2025) | The figure appears to use a broader value capture that can include downstream construction pricing layers, and it also emphasizes natural marble without clearly separating synthetic marble value logic in the headline sizing. |
| Trade Analytics Publisher B | USD 14.60 B (2024) | This estimate tracks marble and travertine trade-focused categories (blocks and slabs) and reports nominal wholesale value, which can understate finished marble consumption and excludes parts of synthetic marble demand. |
The table shows that most of the spread is explained by what is counted and where pricing is captured in the chain, not only by different growth views. By keeping inclusions clear and then validating with construction indicators, trade flows, and primary checks on mix and pricing, we deliver a number that is easier to trace back to real demand drivers and repeatable steps.
Key Questions Answered in the Report
What is the current size of the marble market?
The marble market was valued at USD 24.03 billion in 2026 and is projected to reach USD 30.11 billion by 2031, reflecting a 4.61% CAGR.
Which region is growing fastest in the marble market?
Asia-Pacific leads growth with a forecast 6.10% CAGR through 2031, driven by urban infrastructure and high-rise construction.
How dominant is synthetic marble compared with natural varieties?
Synthetic grades accounted for 80.65% of marble market share in 2025 and are expected to strengthen their position due to cost, consistency and thin-slab technology.
What are the main health challenges facing the marble industry?
Respirable silica dust generated during cutting and polishing has led to stricter exposure limits after documented silicosis cases, compelling factories to adopt wet-cutting and advanced ventilation.