
Manufacturing Execution Systems Market Size and Share
Market Overview
| Study Period | 2020 - 2031 |
|---|---|
| Market Size (2026) | USD 18.87 Billion |
| Market Size (2031) | USD 29.35 Billion |
| Growth Rate (2026 - 2031) | 9.23% CAGR |
| Fastest Growing Market | Asia Pacific |
| Largest Market | North America |
| Market Concentration | Medium |
Major Players *Disclaimer: Major Players sorted in no particular order Image © Mordor Intelligence. Reuse requires attribution under CC BY 4.0. | |
Manufacturing Execution Systems Market Analysis by Mordor Intelligence
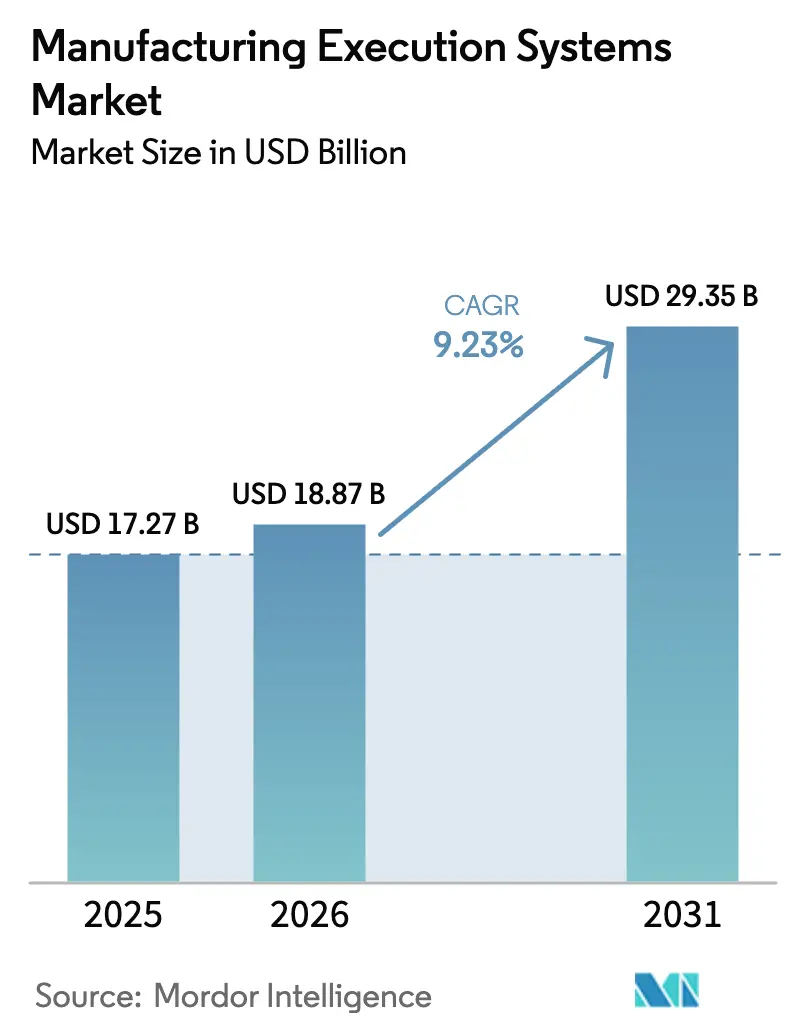
The Manufacturing Execution Systems Market size is expected to grow from USD 17.27 billion in 2025 to USD 18.87 billion in 2026 and is forecast to reach USD 29.35 billion by 2031 at 9.23% CAGR over 2026-2031. This trajectory is anchored by sovereign industrial policies such as the United States’ USD 52.7 billion CHIPS and Science Act and India’s USD 30 billion Production Linked Incentive schemes, both of which convert policy intent into capital-equipment orders that require real-time production orchestration. Enterprises are also racing to satisfy traceability mandates tied to pharmaceutical serialization, electric-vehicle battery passports, and food-safety protocols, further stimulating the manufacturing execution systems (MES) market. Low-code platforms and subscription pricing models are lowering adoption barriers for smaller factories, while cybersecurity certifications like IEC 62443 are shaping vendor short-lists. On the technology front, edge-native architectures that synchronize with cloud analytics are emerging as the default choice for plants seeking latency control without forfeiting remote visibility.
Key Report Takeaways
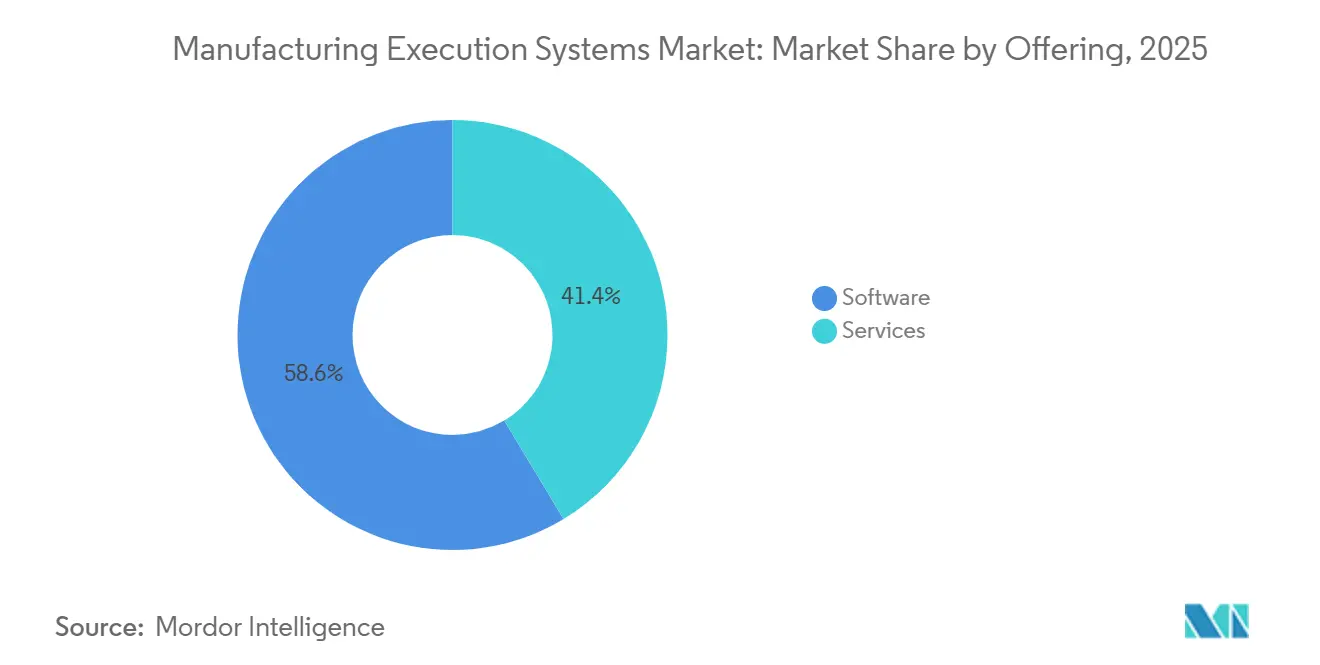
- By offering axis, software captured 58.64% of 2025 revenue, whereas services are projected to expand at an 11.78% CAGR through 2031.
- By deployment modes, on-premise installations commanded 62.46% of 2025 spending, while cloud solutions are advancing at a 10.12% CAGR.
- By end-user industries, automotive led with 27.68% revenue share in 2025, but pharmaceutical and life sciences are forecast to grow at a 10.78% CAGR.
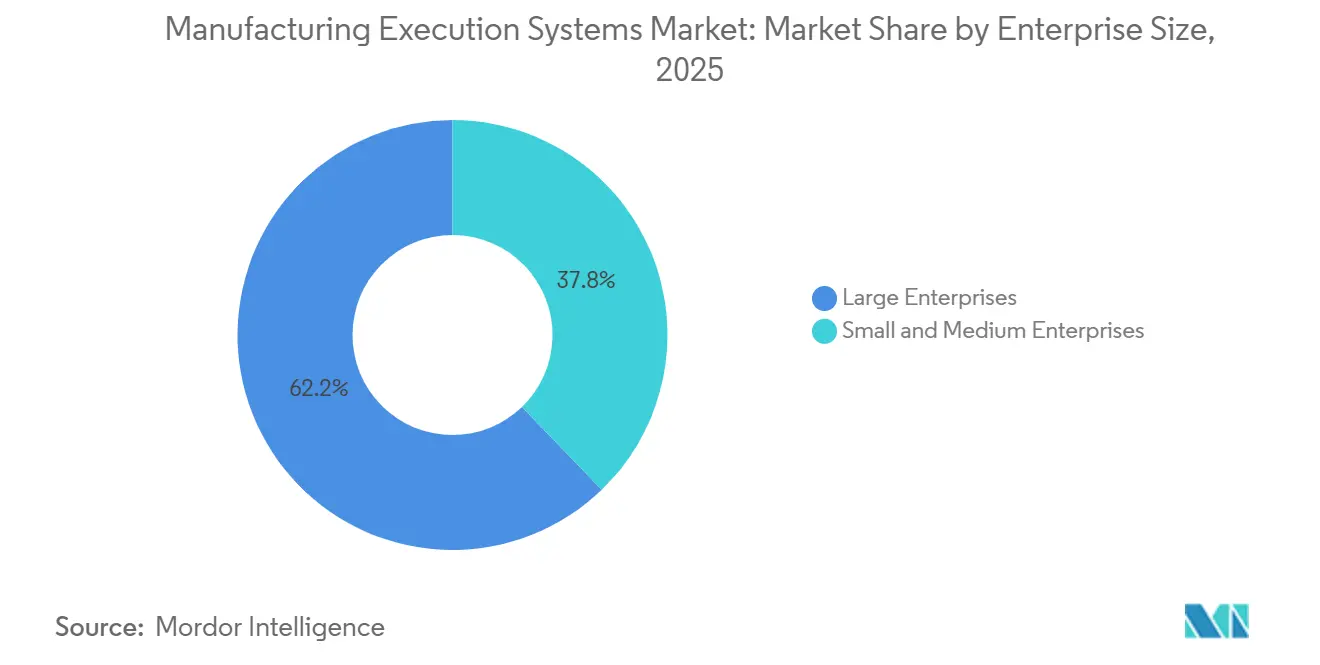
- By enterprise size, large companies held 62.22% of 2025 revenue, yet small and medium enterprises are pacing at a 12.46% CAGR.
- By process type, discrete manufacturing accounted for 50.76% of 2025 spending, whereas hybrid environments are expanding at a 10.49% CAGR.
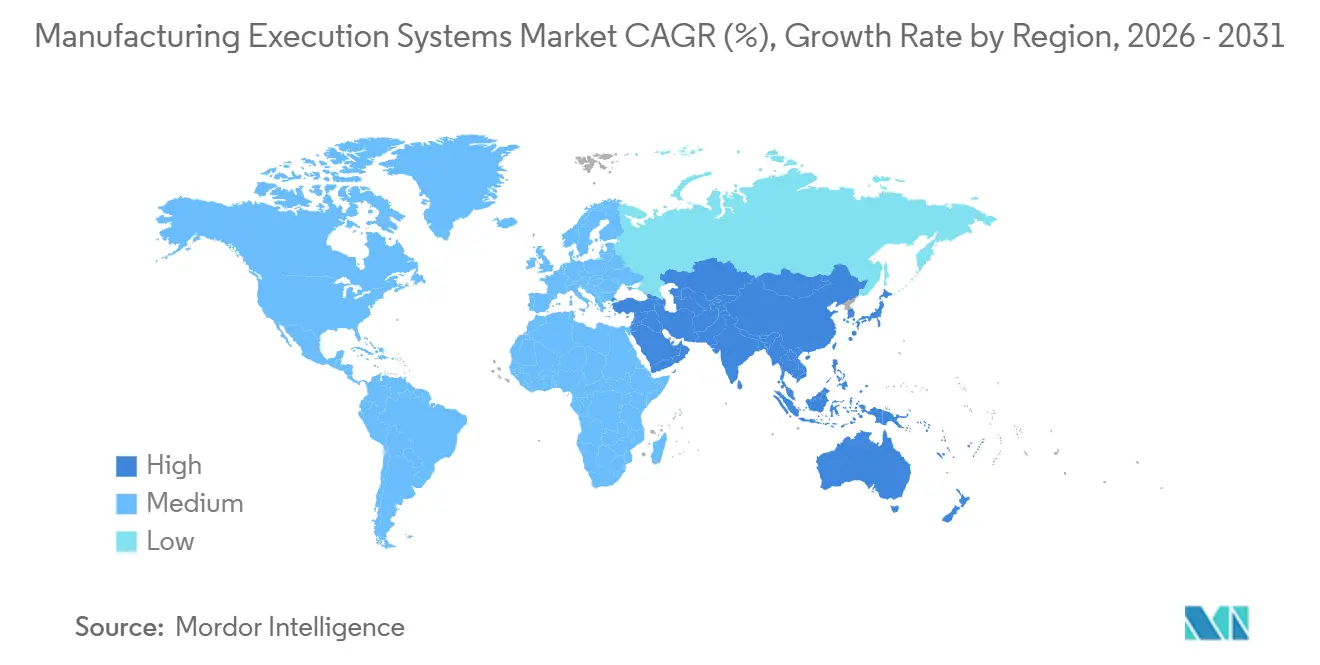
- By geography, North America controlled 36.74% of 2025 value, but Asia Pacific is on track for an 11.94% CAGR to 2031.
Note: Market size and forecast figures in this report are generated using Mordor Intelligence’s proprietary estimation framework, updated with the latest available data and insights as of January 2026.
Global Manufacturing Execution Systems Market Trends and Insights
Drivers Impact Analysis*
| Driver | ( ~ ) % Impact on CAGR Forecast | Geographic Relevance | Impact Timeline |
|---|---|---|---|
| Industry 4.0 and Smart-Factory Roll-outs | +2.1% | Germany, United States, China, Japan | Medium term (2-4 years) |
| Need for Real-Time Production Visibility | +1.8% | North America and Europe automotive and semiconductor clusters | Short term (≤ 2 years) |
| Compliance-Driven Digital Traceability | +1.6% | North America and Europe pharma, Europe automotive battery, Global F&B | Medium term (2-4 years) |
| SaaS Pricing Lowers CapEx Barriers | +1.3% | Asia Pacific and South America SMEs | Short term (≤ 2 years) |
| Rise of Low-Code Composable MES | +1.0% | North America and Europe SME hubs | Medium term (2-4 years) |
| OEE-as-a-Service Linked to IIoT Analytics | +0.9% | Global discrete manufacturing | Long term (≥ 4 years) |
| Source: Mordor Intelligence | |||
Industry 4.0 And Smart-Factory Roll-outs
National manufacturing agendas continue to de-risk digital-twin investments. In the United States, the Department of Energy’s Smart Manufacturing Innovation Institute funded live production trials in 2025 that cut energy intensity by double-digit percentages.[1]U.S. Department of Energy, “Smart Manufacturing Innovation Institute Awards,” energy.gov Germany’s Manufacturing-X framework requires interoperable asset-administration shells, ensuring that each connected machine can publish status without revealing proprietary know-how. Ireland earmarked grants for pharmaceutical clusters in Cork and Limerick, prompting contract manufacturers to swap spreadsheets for modular execution platforms. The United Kingdom tied innovation vouchers to verifiable scrap-rate reductions, prompting mid-tier suppliers to adopt platform-agnostic data models. Collectively, these initiatives convert abstract policy into direct demand for the manufacturing execution systems (MES) market.
Need For Real-Time Production Visibility
Supply-chain disruptions in 2024 exposed the cost of delayed shop-floor data. Automotive OEMs now require hourly electronic data interchange from tier-1 suppliers, an expectation that paper logs cannot meet. Semiconductor fabs deploy edge gateways that stream metrology readings to advanced process-control algorithms, shrinking excursion detection windows from hours to seconds. By 2025, sensor costs fell below USD 5 per node, enabling high-mix job shops to justify continuous monitoring. Energy-management layers now link machine utilization with time-of-use tariffs, carving 15%-20% off peak charges in regions with interval metering. As a result, live dashboards are becoming table stakes rather than differentiators in the manufacturing execution systems market.
Compliance-Driven Digital Traceability
Regulators are codifying electronic audit trails. The U.S. Food and Drug Administration’s 21 CFR Part 11 demands tamper-evident logs and versioned recipes. The Drug Supply Chain Security Act phases culminated in 2024, compelling unique identifiers down to the unit level. Europe’s Battery Regulation introduced mandatory digital product passports in 2024, forcing electric-vehicle cell makers to reveal chemistry, carbon footprint, and recycled content. Beginning January 2026, the Food Safety Modernization Act obliges food processors to furnish lot genealogy within 24 hours of recall notice. Such statutes directly expand the addressable manufacturing execution systems market size, because manual or legacy tools cannot satisfy serialized, time-stamped data requirements.
SaaS Pricing Lowers CapEx Barriers
Monthly subscription tiers from vendors such as Plex and AVEVA start below USD 100 per user, eliminating the USD 500,000–USD 2 million up-front licenses typical of on-premise suites. Tier-2 suppliers in Mexico and Southeast Asia now deploy core work-order and quality modules in 8-12 weeks, riding multi-tenant architectures maintained by the vendor. Automatic version upgrades deliver machine-learning anomaly detection without renegotiating contracts, tightening capability gaps between small shops and multinational peers. As a result, the manufacturing execution systems market is broadening beyond traditional capital-rich buyers.
Restraints Impact Analysis*
| Restraint | ( ~ ) % Impact on CAGR Forecast | Geographic Relevance | Impact Timeline |
|---|---|---|---|
| Up-Front Integration Cost With Legacy OT and ERP | -1.4% | North America and Europe brownfield plants | Short term (≤ 2 years) |
| Cyber-Security Risks In Cloud-Connected Plants | -1.1% | Pharmaceutical and defense sectors worldwide | Medium term (2-4 years) |
| OT and IT Skill-Gap Stalling Roll-outs | -0.8% | North America and Europe | Long term (≥ 4 years) |
| IP-Exposure Fears Among Contract Manufacturers | -0.6% | Asia Pacific CMO hubs | Medium term (2-4 years) |
| Source: Mordor Intelligence | |||
Up-Front Integration Cost With Legacy OT And ERP
Brownfield facilities often rely on proprietary fieldbus networks such as Modbus or Profibus that predate modern APIs. Bridging these islands requires protocol gateways and custom scripts, inflating project budgets by 40%-60% according to a 2025 MESA survey.[2]Manufacturing Enterprise Solutions Association, “2025 Integration Cost Survey,” mesa.org Pharmaceutical sites add validation overhead, where every change triggers installation, operational, and performance qualifications that consume months and hundreds of thousands of dollars. Such integration burdens can exhaust the first year of ROI models, delaying board approval for incremental modules and tempering growth in the manufacturing execution systems (MES) market.
Cyber-Security Risks In Cloud-Connected Plants
In 2025, the U.S. Cybersecurity and Infrastructure Security Agency issued 14 advisories covering Siemens, Schneider Electric, Rockwell, and ABB vulnerabilities that enabled remote code execution.[3]U.S. Cybersecurity and Infrastructure Security Agency, “ICS Advisories 2025,” cisa.gov Cloud misconfigurations compound the problem, potentially leaking production schedules or proprietary formulations. Fewer than 30% of installed systems meet IEC 62443’s zone-and-conduit segmentation rules. Defense and aerospace primes, bound by ITAR and CMMC, frequently default to air-gapped networks, sacrificing cloud analytics for risk containment. This trust deficit restrains full-scale adoption despite functional advantages.
*Our forecasts treat driver/restraint impacts as directional, not additive. The impact forecasts reflect baseline growth, mix effects, and variable interactions.
Segment Analysis
By Offering: Capture Momentum In A Complex Landscape
Services revenue is set to outpace software through 2031 as manufacturers outsource integration, validation, and analytics. In 2025, software generated 58.64% of topline demand, yet the growing complexity of multi-plant roll-outs is unlocking double-digit expansion for managed services. Validation-as-a-service bundles shorten pharmaceutical qualification phases from nine months to twelve weeks, illustrating why professional support is eclipsing license fees in the manufacturing execution systems (MES) market size. Remote monitoring packages embedding predictive maintenance and changeover optimization are especially popular among automotive tiers that lack in-house data scientists.
Managed services also act as a talent bridge. Scarcity of ISA-95 architects and cloud-native DevOps engineers prompts factories to contract outcome-based agreements. Vendors assume responsibility for uptime, patching, and upgrades, effectively converting capital purchases into opex lines. This realignment aligns corporate cash-flow preferences with continuous improvement cycles, bolstering the manufacturing execution systems market.


By Deployment Mode: Cloud Gains Despite Validation Inertia
On-premise systems held a 62.46% manufacturing execution systems market share in 2025 due to stringent pharma and semiconductor validation rules. Cloud platforms, however, are growing 10.12% annually as SMEs and contract manufacturers favor rapid configuration over server ownership. Edge-native hybrids satisfy latency and data-sovereignty concerns by performing time-critical loops locally while syncing aggregated metrics to cloud dashboards. The CHIPS and Science Act now ties funding to digital-twin yield dashboards accessible to distributed teams, catalyzing cloud adoption in new U.S. fabs.
Cybersecurity remains the chief hurdle. IEC 62443 certification for cloud services trails on-premise norms, and pharma CMOs negotiate data-residency clauses to lock server locations. Even so, Europe’s Digital Product Passport and similar regulations require secure APIs that cloud infrastructure delivers more cost-effectively than on-premise portals. As regulatory glue hardens, the deployment mix within the manufacturing execution systems market is tilting toward hybrid-cloud.
By End-User Industry: Pharma Compliance Drives Fastest Upside
Automotive contributed 27.68% of 2025 revenue, propelled by battery-cell traceability and multi-tier synchrony. Yet pharmaceutical and life-sciences customers exhibit the fastest expansion at 10.78% through 2031, buoyed by serialization laws and continuous-manufacturing adoption. Cell-and-gene therapy plants demand batch genealogy with patient-level precision, a capability only execution systems can deliver at scale. Electronics makers invest heavily to correlate nanoscale process parameters with defect densities, further enlarging the manufacturing execution systems market size.
Food and beverage processors are late but fast movers because the Food Safety Modernization Act now compels lot-level tracking within 24 hours of recall. Continuous process industries like oil and gas deploy historian-centric modules for energy intensity reduction rather than discrete work-order control. Aerospace and defense emphasize configuration management to maintain part pedigree, underscoring vertical nuances in adoption patterns.
By Enterprise Size: SMEs Close The Digital Divide
Large corporations garnered 62.22% of 2025 demand, but SMEs are growing at a 12.46% clip, outpacing their bigger peers by 3.23 percentage points. Subscription models under USD 100 per user per month transform prohibitively large capital projects into manageable opex lines, swelling the addressable manufacturing execution systems market. Low-code environments empower production supervisors to craft dashboards and alerts without writing code, removing systems-integrator bottlenecks.
Policy catalysts amplify this trend. India’s Production Linked Incentive schemes link subsidy eligibility to digitization milestones, pushing tier-2 electronics suppliers in Ahmedabad and Coimbatore to adopt cloud MES rapidly. Mexico’s nearshoring wave is generating a greenfield SME base in the Bajío, each seeking IATF 16949 compliance within tight timelines incompatible with legacy implementations. Together, these forces democratize access across enterprise sizes.
By Process Type: Hybrid Architectures Proliferate
Discrete operations held 50.76% of spending in 2025, with automotive assembly and SMT lines dominating. Hybrid processes are recording a 10.49% CAGR as modular bioreactors and continuous small-molecule reactors reshape pharmaceutical production. The U.S. FDA’s 2024 guidance elevated continuous manufacturing from pilot to mainstream, prompting retrofits that raise software spend per line. Hybrid food plants mixing extrusion and batch packaging add further momentum to the manufacturing execution systems (MES) market.
Modular process units need execution layers that can switch between campaign and continuous modes without losing genealogy or cleaning validation records. Vendors now offer microservice toolkits to handle these context switches in real time. This functional agility differentiates suppliers and drives new license and service revenue, particularly in life sciences and specialty chemicals.
Geography Analysis
North America’s leadership stems from USD 52.7 billion in semiconductor incentives and a robust pharmaceutical base. Intel’s Ohio and Arizona fabs and TSMC’s Phoenix site embed digital-twin yield dashboards, anchoring execution budgets. Pharmaceutical hubs in New Jersey and Puerto Rico retrofit batch suites with continuous reactors to satisfy FDA serialization and process-verification rules. Canada’s Ontario auto corridor now integrates battery-pack traceability as EV volumes scale, while Mexico’s Bajío SMEs deploy cloud suites to meet IATF 16949 audits rapidly.
Asia Pacific’s 11.94% forecast CAGR reflects policy and supply-chain shifts. China’s Ministry of Industry and Information Technology backs industrial-internet pilots that graduate into full-scale deployments. India’s subsidies hinge on proof of digitization, driving adoption among electronics and pharma SMEs. Southeast Asia absorbs electronics and automotive lines relocating from single-source geographies, and each OEM mandates execution-system compliance as supplier entry criteria. Japan focuses on predictive maintenance to counteract labor shortages, while Australia and New Zealand embed traceability to protect food-export brands.
Europe advances under the weight of regulation. Germany retrofits battery-cell lines to meet digital passport rules. United Kingdom pharma centers fund continuous-manufacturing pilots to offset Brexit-related cost pressures. France’s defense plants favor on-premise, air-gapped deployments for ITAR compliance. Italy’s PDO food processors use execution layers to authenticate provenance, and Spain’s tier-1 automotive suppliers adopt cloud platforms to synchronize cross-border plants. Russia’s refinery optimizations rely on historian integrations, even as sanctions curb Western licenses.

Regulatory Landscape
Compliance and standards requirements are tightening around electronic records, traceability, and computerized system controls, which is raising the need for validated MES capabilities across regulated industries. In the United States, FDA requirements such as 21 CFR Part 11 for electronic records and signatures continue to anchor MES validation expectations. Separately, the Food Safety Modernization Act introduces a January 2026 requirement for food processors to provide lot genealogy within 24 hours of a recall notice, increasing emphasis on time-stamped, tamper-evident genealogy captured at the execution layer.
In Europe, digital traceability obligations expand with the 2024 Battery Regulation, which mandates digital product passports and requires battery and automotive supply chains to disclose production and material attributes through interoperable data exchanges. On the cyber and integration side, ISA/IEC 62443 remains a de facto baseline in many industrial RFPs, and IEC 62264 (aligned with ISA-95) continues to standardize the enterprise-to-control integration model that underpins MES data models and interfaces, reducing reliance on bespoke mappings between shop-floor operations and business systems.
Value Chain Analysis
The MES value chain begins with standards and core platform development, including ISA-95/IEC 62264-aligned models, connectors, and cybersecurity controls. It then moves into solution packaging by MES vendors and industrial automation suppliers that bundle execution software with PLC/DCS/SCADA footprints. Implementation and value realization are typically delivered by systems integrators and domain specialists who handle OT connectivity, ERP integration, validation documentation (notably in pharma and medical devices), and multi-site rollout governance. These services are increasingly monetized through managed services and subscription add-ons such as remote monitoring, upgrades, and analytics.
Downstream, manufacturers and their tier suppliers operationalize MES through plant-level deployments that depend on reliable OT hardware availability, including controllers, gateways, and sensors, and stable network infrastructure for edge-to-cloud synchronization. Evidence from Rockwell Automation points to a maturity gap where many plants have an MES instance but still lack enterprise-wide integration, shifting spend toward integration tooling, common data layers, and modernization programs that unify sites rather than adding net-new point deployments. Persistent constraints in industrial automation component supply chains, especially for legacy-node semiconductors used in controllers, can stretch timelines and increase demand for phased deployments, retrofit gateways, and interoperable architectures that reduce rework when hardware substitutions occur.
Competitive Landscape
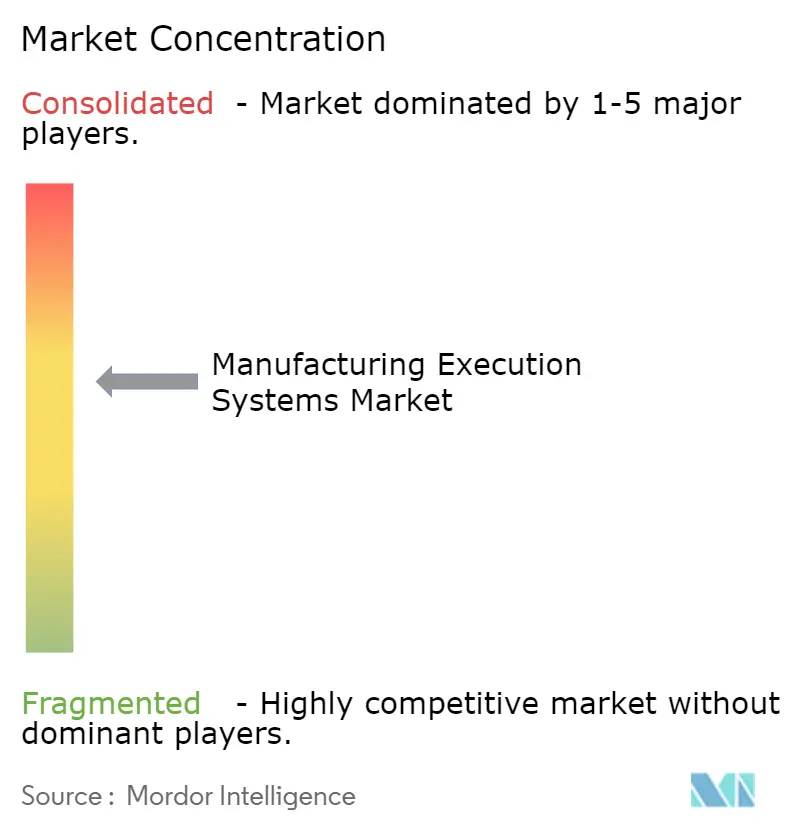
The ten largest vendors hold roughly 55% of global revenue, placing overall concentration in the mid-range. Siemens, Rockwell Automation, Schneider Electric, ABB, and Honeywell exploit their controller footprints to bundle edge-native execution software, simplifying integration for brownfield customers. Enterprise software majors SAP, Oracle, and Dassault Systèmes pitch execution as the operational spine inside broader supply-chain suites, a message that resonates with CIOs tasked with harmonizing ERP and MES layers.
Specialists maintain pricing power by embedding regulatory templates. Emerson’s Syncade dominates pharmaceutical batch records, while Applied Materials automates semiconductor fabs with sub-micron placement constraints. Low-code insurgents Critical Manufacturing and iBASEt court aerospace and semiconductor niches with microservice portfolios, reducing implementation cycles from 18 months to under 12 weeks. Edge-AI modules offering predictive maintenance and dynamic scheduling constitute the next battleground, evidenced by the U.S. Patent Office’s 200-plus 2025 filings on digital-twin synchronization. Cybersecurity posture is now co-equal with functional depth, and IEC 62443 certification appears on nearly every request for proposal.
Manufacturing Execution Systems Industry Leaders
Siemens AG
Rockwell Automation Inc.
SAP SE
ABB Ltd.
Honeywell International Inc.
- *Disclaimer: Major Players sorted in no particular order

Market Opportunities and Future Outlook
A key white space is enterprise-wide MES integration and harmonization across multi-plant networks. Rockwell Automation reported in 2026 that while 93% of manufacturers have deployed MES, only 23% have fully integrated it across operations, suggesting many organizations are still funding integration, standard work models, and cross-site visibility rather than replacing core execution systems. This gap supports opportunities for vendors and integrators offering composable MES modules, standardized templates, and IT/OT data contextualization layers that shorten rollout cycles and improve portability across plants.
Another opportunity area is the expansion of regulated traceability and auditability into more product categories and supplier tiers, where manual or partially digitized execution workflows cannot satisfy compressed response windows and serialized genealogy demands. The January 2026 FSMA 24-hour traceability requirement for food processors, combined with battery digital product passport requirements in Europe, increases demand for MES capabilities that bind production events to secure, time-stamped records and expose data through APIs to customers and regulators. At the same time, cybersecurity posture is increasingly treated as a procurement gate, favoring MES offerings that align with ISA/IEC 62443 controls and support hybrid architectures that keep latency-critical loops at the edge while synchronizing governed datasets to cloud analytics.
Recent Industry Developments
- May 2026: Advantive acquired Insequence to expand its automotive manufacturing and supply chain software footprint, adding sequencing and MES capabilities that are closely tied to plant-level execution and line synchronization. The move strengthens its position in automotive programs where traceability, scheduling, and just-in-sequence delivery require tighter coupling between execution data and supply chain workflows.
- February 2025: Siemens began delivery and implementation of Opcenter Execution Pharma for ZF Polpharma S.A. across multiple manufacturing sites in Poland. The multi-site scope reinforces MES demand in life sciences where validated electronic batch records, genealogy, and controlled recipe execution drive long-duration deployment and services revenue.
- May 2024: Siemens launched Opcenter X, positioning a cloud-enabled MES approach that supports faster deployment and continuous software updates while maintaining shop-floor connectivity requirements. The release supports hybrid execution architectures where plants keep latency-sensitive operations local and synchronize operational data for enterprise visibility and analytics.


Research Methodology Framework and Report Scope
Market Definition and Coverage
For this study, the market covers revenues generated from manufacturing execution systems used to monitor, guide, and optimize shop floor production, including software and the allied services that are typically attached to a standalone MES license across discrete, process, and hybrid manufacturing.
Scope exclusions: Embedded production-management modules bundled only inside PLC or CNC tools, with no separate MES license, are excluded from the market totals.
Segmentation Overview
- By Offering
- Software
- Services
- By Deployment Mode
- On-Premise
- Cloud
- Edge-Based
- By End-User Industry
- Food and Beverage
- Oil and Gas
- Pharmaceutical and Life Sciences
- Automotive
- Electronics and Semiconductor
- Chemicals
- Metals and Mining
- Pulp and Paper
- Aerospace and Defense
- Other End-User Industries
- By Enterprise Size
- Large Enterprises
- Small and Medium Enterprises
- By Process Type
- Discrete Manufacturing
- Process Manufacturing
- Hybrid
- By Geography
- North America
- United States
- Canada
- Mexico
- South America
- Brazil
- Argentina
- Rest of South America
- Europe
- Germany
- United Kingdom
- France
- Italy
- Spain
- Russia
- Rest of Europe
- Asia Pacific
- China
- Japan
- South Korea
- India
- Australia and New Zealand
- Rest of Asia Pacific
- Middle East
- Saudi Arabia
- United Arab Emirates
- Turkey
- Rest of Middle East
- Africa
- South Africa
- Nigeria
- Rest of Africa
- North America
Data Sources, Market Sizing, and Validation
Desk Research
Desk work starts by mapping the demand-side signals that drive MES adoption and replacement cycles, and then aligning them to a realistic commercial scope that can be tracked year to year. We refer to public manufacturing output and investment indicators, plus practical digital manufacturing guidance, to keep assumptions grounded in what plants are actually doing.
Common inputs come from non-paywalled sources such as the US Census Bureau (manufacturing statistics), Eurostat (industrial production), the World Bank and OECD (macro and industry series), UN Comtrade (trade flows for automation related equipment), and NIST publications on smart manufacturing and standards. We also use company annual reports, investor decks, reputable press coverage, patent databases, and, when needed, paid subscriptions for company financials and news context, and for shipment-level import and export checks. The source list is illustrative, and many other references are also used for data collection, validation, and clarification.
Primary Interviews and Surveys
Primary checks are used to validate what is included in an MES deal, how services are priced and recognized, and how cloud versus on-premises delivery changes ASP and renewal patterns. We speak with a mix of software providers, system integrators, manufacturing IT leaders, and plant operations teams across APAC, EMEA, and the Americas, so the model reflects differences by plant footprint and adoption maturity.
Distribution of primary research fieldwork respondents
| Company type | Respondent position | Region |
|---|---|---|
| Top tier: 34% | CXOs: 16% | APAC: 39% |
| Mid tier: 50% | Functional/Unit leaders: 37% | EMEA: 36% |
| Smaller Players: 16% | Managers: 47% | Americas: 25% |
Market-Sizing & Forecasting
Sizing is built mainly from a top-down demand pool, where manufacturing activity and automation digitization signals are translated into an addressable MES spend layer, then split by region using adoption and installed base indicators. To keep the totals credible, we cross-check them with selective bottom-up approximations such as sampled vendor revenue disclosures, channel feedback from integrators, and simple volume times ASP logic for common license and subscription bundles.
The model uses market fingerprints that can be traced and refreshed, including the mix of discrete versus process manufacturing output, the pace of smart factory and IIoT program rollouts, cloud migration readiness in plants, compliance and traceability requirements that raise MES usage, and the typical services attach rate on deployments. Where bottom-up signals are incomplete, gaps are handled through conservative interpolation using peer group ranges and region-level consistency checks.
For forecasting, we rely on multivariate regression with scenario checks. Drivers like industrial production outlook, manufacturing capex cycles, and software subscription penetration are projected and then stress-tested with expert feedback. Assumptions are adjusted when interview inputs flag clear changes in buying behavior, including delayed projects, faster cloud conversions, or higher cybersecurity spend tied to shop floor connectivity.
Data Validation & Update Cycle
Outputs are validated through multiple passes that compare the model against independent signals, such as automation spending direction, manufacturing output trends, and observed pricing movement for enterprise software subscriptions. Large variances are flagged, then we re-check definitions, currency conversions, and region splits before the numbers are finalized.
A second analyst review is completed before sign-off, and re-contacts are triggered when unusual swings appear in growth rates, service shares, or region contribution. Reports are refreshed annually, with interim updates when material events occur, and a final pre-delivery pass is done so clients receive the most current view available at the time of release.
Mordor Intelligence's Manufacturing Execution Systems Market Size Measured Against Other Published Estimates
Published market sizes for MES often differ, even when everyone is looking at the same broad theme, because the boundaries around software, services, and what counts as MES are not set the same way. Differences also show up when providers use different base years, currency timing, and assumptions on cloud migration and service attach rates.
The benchmark table shows a spread around the 2026 starting point. In Mordor Intelligence's model, the total is built from standalone MES software plus allied services revenues, while embedded production modules inside PLC or CNC tools without a separate MES license are not counted.
Benchmark comparison
| Source | Market Size | Gaps in Research Methodology |
|---|---|---|
| Mordor Intelligence | USD 18.87 B (2026) | |
| Global Research Publisher A | USD 17.57 B (2025) | Uses a 2025 base year and does not clearly separate standalone MES revenue from adjacent manufacturing operations software, which can shift totals depending on what modules are grouped under MES. |
| Industry Research Publisher B | USD 16.57 B (2025) | Starts from a different base year and applies a faster growth path, but the public summary does not spell out how services, upgrades, and recurring subscriptions are treated across regions, which can change the counted revenue pool. |
Overall, the spread is mainly explained by what gets included with the MES license, how closely services are tied to the counted scope, and whether adjacent shop floor software categories are blended into the same number. By keeping assumptions tied to observable adoption signals and re-checking them with interview feedback, the estimate stays transparent and can be repeated when new data becomes available.


Key Questions Answered in the Report
What CAGR is projected for the manufacturing execution systems (MES) market from 2026 to 2031?
The market is forecast to grow at 9.23% annually, increasing from USD 18.87 billion in 2026 to USD 29.35 billion in 2031.
Which deployment mode is expanding fastest?
Cloud-based solutions are advancing at a 10.12% CAGR as subscription pricing and rapid configuration attract SMEs and greenfield sites.
Why are life-science firms accelerating MES investment?
Regulatory pressures for electronic batch records and continuous manufacturing workflows push life-science plants toward advanced MES platforms to secure compliance and real-time release.
Why are pharmaceutical manufacturers investing heavily in execution systems?
MES platforms support compliance by enabling electronic batch records, audit trails, controlled recipes, and real-time genealogy to meet serialization requirements, continuous-manufacturing expectations, and Annex 1 contamination-control workflows.
How do low-code platforms affect adoption among small factories?
Low-code tools let supervisors create workflows without writing code, slashing implementation cycles and reducing reliance on external integrators.
What is the main cybersecurity standard influencing procurement?
IEC 62443, which specifies zone segmentation and role-based access controls, is now a de facto requirement in most industrial RFPs.
Which region offers the highest growth opportunity?
Asia Pacific is projected to lead with an 11.94% CAGR, driven by policy incentives in China and India and supply-chain diversification into Southeast Asia.
Page last updated on:


