
Management Decision Market Size and Share
Market Overview
| Study Period | 2020 - 2031 |
|---|---|
| Market Size (2026) | USD 8.05 Billion |
| Market Size (2031) | USD 20.19 Billion |
| Growth Rate (2026 - 2031) | 20.18 % |
| Fastest Growing Market | Asia Pacific |
| Largest Market | North America |
| Market Concentration | Medium |
Major Players *Disclaimer: Major Players sorted in no particular order Image © Mordor Intelligence. Reuse requires attribution under CC BY 4.0. | |
Management Decision Market Analysis by Mordor Intelligence
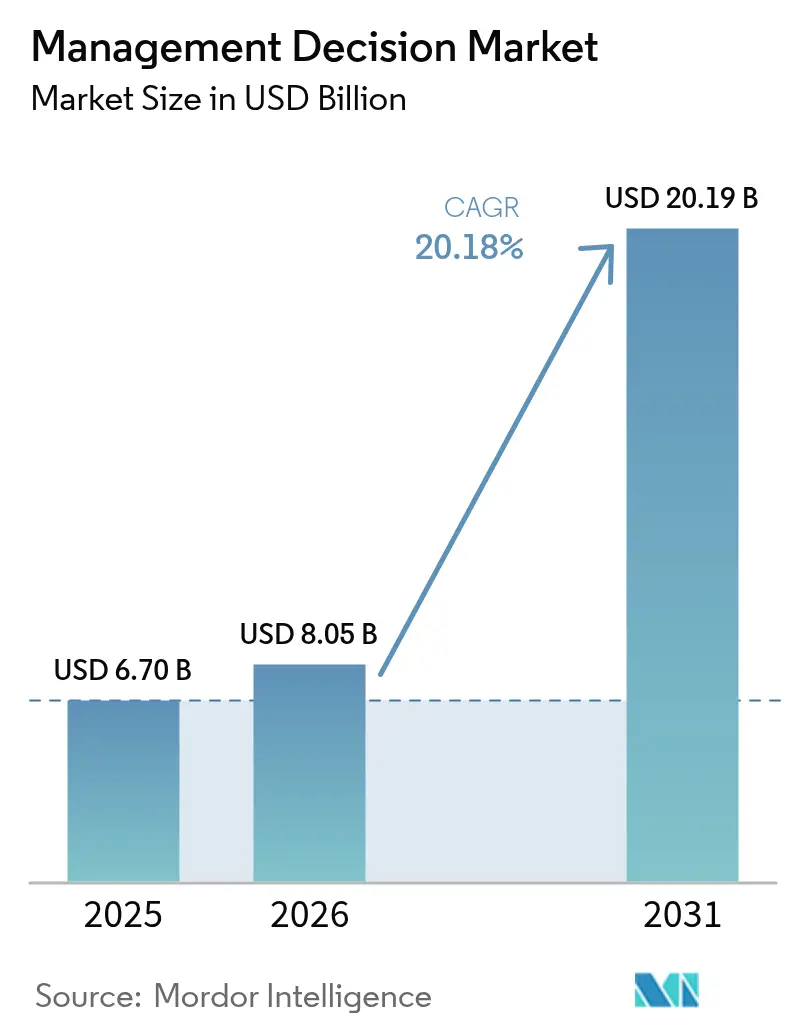
The management decision market size in 2026 is estimated at USD 8.05 billion, growing from 2025 value of USD 6.70 billion with 2031 projections showing USD 20.19 billion, growing at 20.18% CAGR over 2026-2031. Growth reflects the corporate shift from descriptive analytics toward decision intelligence that blends business rules with artificial intelligence (AI) to speed and enhance outcomes. Cloud-native deployment, heightened regulatory scrutiny that requires explainable AI, and the spread of low-code tooling are central drivers as enterprises seek faster insight-to-action cycles.[1] Vendors are now converging decision engines, process orchestration, and machine learning in unified platforms, allowing firms to automate more operational decisions while retaining governance controls.
Key Report Takeaways
- By component, software held 67.20% of the management decision market size in 2025, whereas services are projected to grow at a 21.95% CAGR to 2031.
- By deployment type, the cloud segment captured 79.30% of the management decision market size in 2025, and is advancing at a 21.56% CAGR through 2031.
- By organization size, large enterprises commanded 61.40% of the management decision market size in 2025; small and mid-sized enterprises (SMEs) are forecast to expand at a 21.25% CAGR between 2026-2031.
- By function, risk and compliance led with 32.60% of the management decision market size in 2025; fraud detection is the fastest-growing function at 23.68% CAGR through 2031.
- By end-user industry, banking, financial services, and insurance (BFSI) dominated with a 29.40% of the management decision market size in 2025; healthcare applications are set to grow at a 24.1% CAGR to 2031.
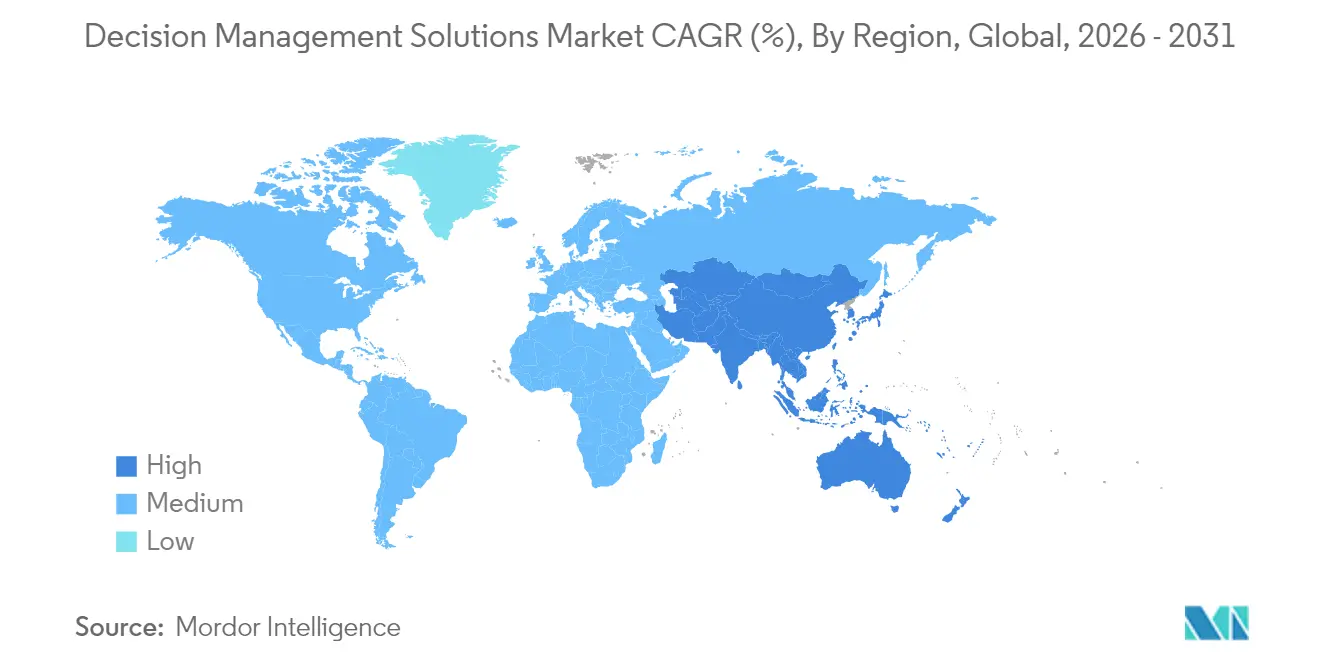
- By geography, North America accounted for 36.50% of the management decision market size in 2025, while the Asia-Pacific region is projected to rise at a 23.95% CAGR between 2026-2031.
Note: Market size and forecast figures in this report are generated using Mordor Intelligence’s proprietary estimation framework, updated with the latest available data and insights as of 2026.
Market Trends and Insights
Drivers Impact Analysis of Management Decision Market*
| Driver | (~) % Impact on CAGR Forecast | Geographic Relevance | Impact Timeline |
|---|---|---|---|
| Increasing Need for Business Agility and Real-Time Insights | +5.8% | Global, led by North America and Western Europe | Short term (≤ 2 years) |
| Surge in Decision Analytics Adoption in BFSI | +4.9% | North America, Europe, APAC financial hubs | Medium term (2-4 years) |
| Compliance-Driven Demand for Explainable AI | +3.7% | Highly regulated markets in US, EU, UK | Medium term (2-4 years) |
| Low-Code/No-Code Platforms Widening User Base | +3.2% | Global, faster uptake in North America and APAC | Short term (≤ 2 years) |
| Embedded Decisioning in Edge and IoT Devices | +2.6% | North America, Europe, advanced APAC economies | Long term (≥ 4 years) |
| Source: Mordor Intelligence | |||
Increasing Need for Business Agility and Real-Time Insights
Market turbulence has turned real-time decisioning into a survival requirement. Modern platforms now fuse predictive analytics with rule engines, enabling organizations to act on signals before they disrupt performance. Enterprises are automating high-volume operational decisions such as pricing and routing through multi-agent systems that coordinate workflows without human delay. Decision flows span departments to keep execution aligned with evolving market conditions while preserving consistent policy enforcement.
Surge in Decision Analytics Adoption in Banking, Financial Services, and Insurance (BFSI)
Banks and insurers are embedding decision engines in credit approval, claims processing and customer interaction journeys. Automated credit decisioning processes loan applications within seconds and enforces uniform compliance checks. Firms are combining internal records with digital behavior to craft individualized financial offerings, extending services to previously underserved borrowers. End-to-end orchestration tools adjust product terms in real time when customer risk factors or market data shift, improving both portfolio quality and user experience.
Compliance-Driven Demand for Explainable Artificial Intelligence (AI)
Rules such as the European Union’s AI Act require transparency for high-risk automated systems. Enterprises, therefore, favor hybrid architectures that layer machine learning predictions with explicit rules so that every outcome can be traced. Governance frameworks document data lineage, model validation, and decision logic. Leading platforms now deliver natural-language explanations that translate algorithmic output into business language, supporting audits and building stakeholder trust.[2]
Low-Code/No-Code Platforms Widening User Base
Visual authoring interfaces allow business specialists to craft and update decision logic without writing code, shortening release cycles and improving model accuracy. Citizen developers gain autonomy while centralized controls maintain standards. Mid-market firms use subscription-based cloud services to access enterprise-grade capabilities once restricted to large Information Technology (IT) teams. As user communities broaden, vendors embed role-based guardrails so multiple contributors can safely collaborate on decision assets.
Restraints Impact Analysis of Management Decision Market*
| Restraint | (~) % Impact on CAGR Forecast | Geographic Relevance | Impact Timeline |
|---|---|---|---|
| High implementation and integration cost | -3.2% | Global, with greater impact in emerging markets | Medium term (2-4 years) |
| Shortage of domain-specific data for model training | -2.8% | Global, with higher impact in less digitized industries | Medium term (2-4 years) |
| Vendor lock-in concerns with cloud-native stacks | -2.1% | Global, with greater sensitivity in regulated industries | Long term (≥ 4 years) |
| Regulatory uncertainty around automated decisions | -1.9% | Global, with particular impact in EU, UK, and US | Medium term (2-4 years) |
| Source: Mordor Intelligence | |||
High Implementation and Integration Cost
Comprehensive decision programs demand sizable outlays for platform licenses, process redesign and change management. Integration can be complex where legacy systems lack standard Application Programming Interfaces (APIs), forcing middleware development and prolonged testing. Smaller firms bear a higher cost burden relative to their budgets, which slows adoption. A phased approach that first targets a few high-value use cases helps generate quick wins and funds expansion while building internal expertise.
Shortage of Domain-Specific Data for Model Training
The effectiveness of AI-powered management decision systems depends heavily on the availability of high-quality, domain-specific training data that accurately represents the decision context. Many organizations struggle to accumulate sufficient historical decision examples, particularly for rare but critical scenarios that most benefit from decision support. This challenge is compounded by data privacy regulations that restrict the use of personal information for model training, forcing organizations to develop synthetic data generation capabilities or federated learning approaches. The data quality issue is particularly acute in sectors undergoing rapid transformation, where historical patterns may not reflect emerging realities. Organizations are addressing this constraint through active learning approaches that prioritize human review of edge cases, gradually building more comprehensive decision models while maintaining operational performance. The most successful implementations combine machine learning with explicit business rules that encode domain knowledge where data is insufficient, creating hybrid systems that leverage both data-driven insights and human expertise.
*Our forecasts treat driver/restraint impacts as directional, not additive. The impact forecasts reflect baseline growth, mix effects, and variable interactions.
Management Decision Market Segment Analysis
By Component:
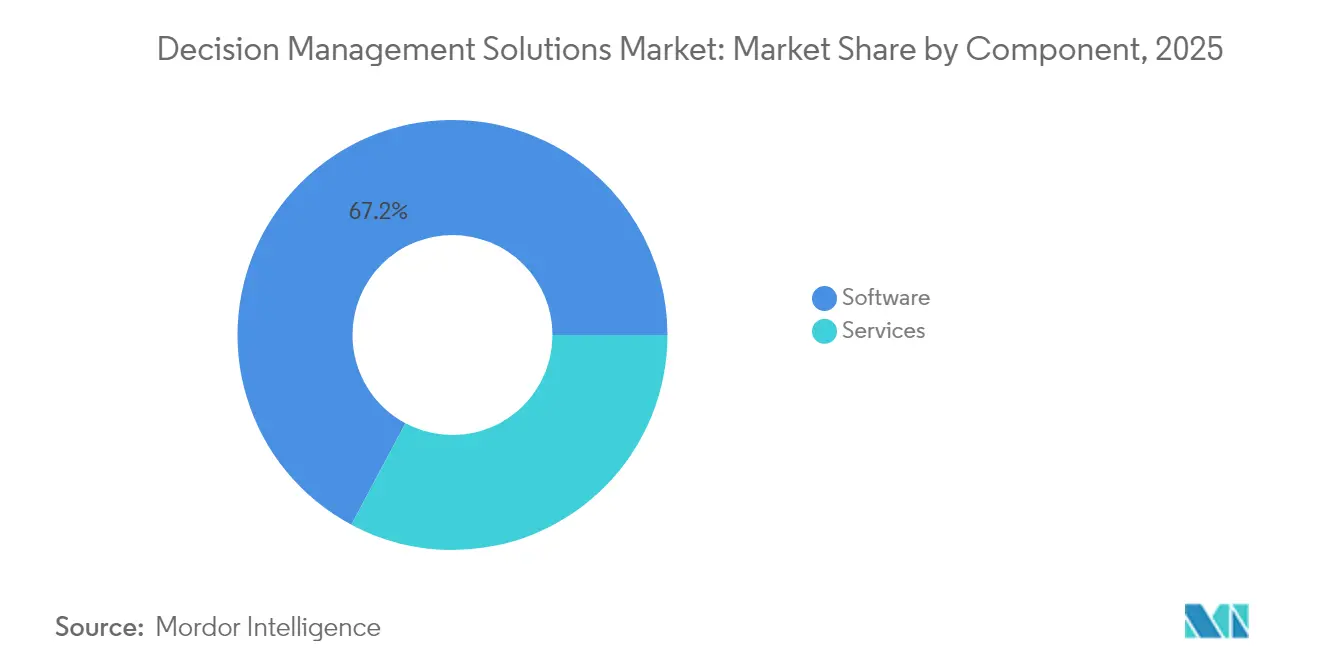
Software Dominates, Services AccelerateSoftware accounted for a commanding 67.20% management decision market share in 2025, underpinned by engines that merge rule management with analytics and natural-language interfaces. Vendors increasingly embed generative AI that suggests rule optimizations and flags compliance gaps. Services, though smaller, are on a 21.95% CAGR path as organizations seek advisory, deployment, and continuous optimization expertise. Providers are evolving industry accelerators that compress rollout timelines by packaging proven decision templates.
Implementation partners redesign processes, create governance playbooks, and run managed optimization programs that keep decision performance aligned with changing regulations and business goals. Firms lacking in-house data science tap these offerings to maintain decision quality. As AI scaling tops executive agendas, demand for continuous model monitoring and recalibration services is rising, supporting sustained expansion for service specialists.

By Deployment Type:
Cloud Preference DeepensCloud captured 79.30% of the management decision market in 2025 and is growing at 21.56% CAGR through 2031 as organizations favor elastic capacity and consumption-based pricing. Cloud platforms allow instant scaling to meet volatile decision workloads, important for seasonal transaction spikes. Even regulated sectors adopt virtual private clouds to meet sovereignty requirements. Some enterprises, however, repatriate sensitive workloads to private environments, creating hybrid estates that blend cloud flexibility with on-premise control.
Decision architects now evaluate each workload along criteria such as latency, data locality, and licensing commitments rather than choosing a single hosting model. Multi-cloud adoption is rising to avoid lock-in and to exploit specialized capabilities from different providers. Vendors respond with portable services built on container technology so clients can shift deployments without rewriting decision logic.
By Organization Size:
Small and Medium Enterprises (SMEs) Gain MomentumLarge enterprises owned 61.40% of the market in 2025, leveraging mature data ecosystems and budget depth to embed decision management widely. They coordinate decisions across units via centralized governance groups that ensure policy alignment. Complex environments demand orchestration layers capable of chaining multiple decision services into a coherent execution flow.
SMEs are catching up, expanding at a 21.25% CAGR as subscription-based cloud platforms lower entry costs. Low-code authoring and industry-specific templates help firms with modest IT staff deploy robust decision flows. Vendors courting the mid-market emphasize simplified pricing, guided configuration and managed services that shoulder model upkeep, closing the capability gap between small and large enterprises.
By Function:
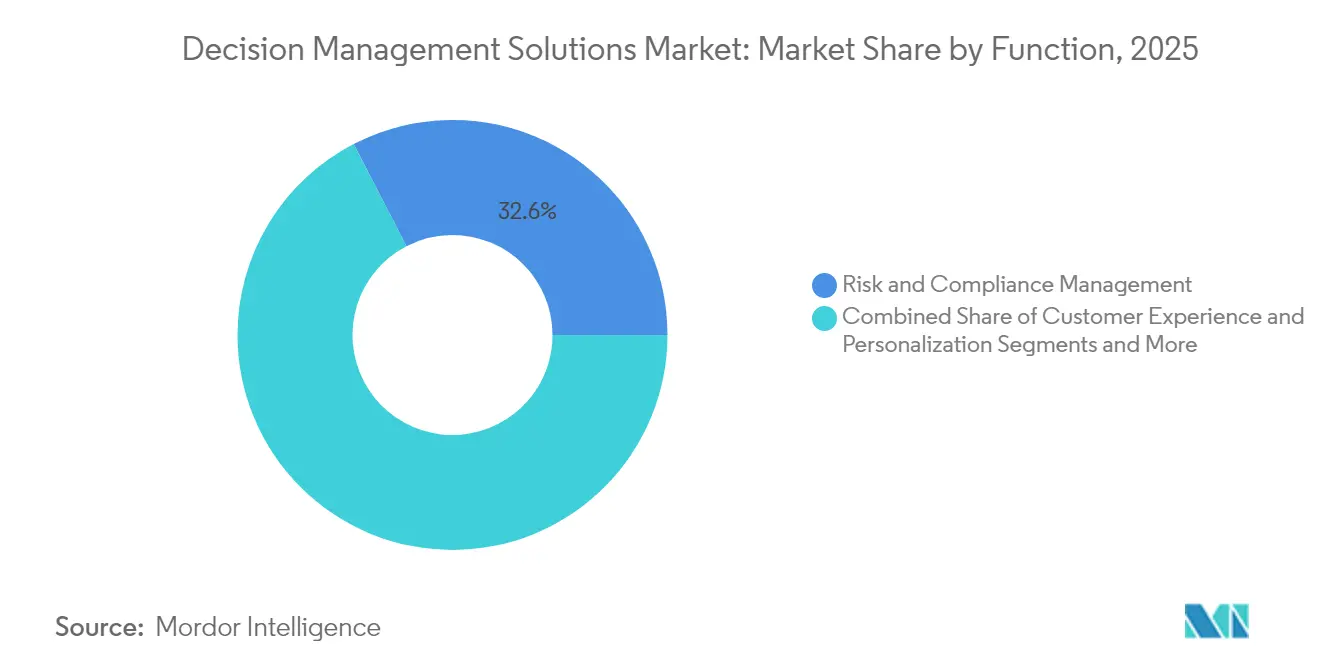
Fraud Detection SurgesRisk and compliance remained the largest function with 32.60% of 2025 revenue, as institutions require consistent regulatory adherence and proactive risk mitigation. Platforms ingest legal texts, convert requirements into executable logic and flag non-compliance before issues escalate. Natural-language features help compliance teams update rules swiftly when regulations change.
Fraud detection is the fastest-growing use case, advancing at 23.68% CAGR through 2031. Machine-learning models monitor transaction streams and behavioral biometrics in milliseconds, blocking illicit activity while keeping false positives low. Multimodal analytics that analyse text, images and geospatial signals are emerging to counter sophisticated synthetic-identity and deepfake schemes. Organizations report steep drops in chargebacks and substantial rises in approved orders when AI-driven fraud engines are deployed, further propelling adoption.
By End-User Industry:
Healthcare Accelerates AdoptionBFSI held a leading 29.40% share in 2025, embedding decision platforms in credit origination, pricing, liquidity management, and customer engagement. Banks combine predictive models with rule frameworks to personalize offers, speed approvals, and prove compliance. The sector’s appetite grows as firms compete with fintech challengers and face increasingly complex regulatory mandates.
Healthcare is expanding fastest at a 24.1% CAGR as providers deploy decision support to improve care quality and revenue integrity. Clinical systems surface treatment recommendations and flag adverse drug interactions, while revenue cycle tools automate coding, prior-authorizatio,n and denial management. The US Department of Health and Human Services' strategic plan highlights AI as a catalyst for equitable, efficient health delivery, encouraging hospitals to embed decision intelligence across operations.
Geography Analysis
North America Management Decision Market
North America dominated the management decision market with 36.50% revenue in 2025. Early adoption of AI, deep cloud infrastructure, and a concentration of leading vendors underpin leadership. Financial institutions use decision engines to refine credit scoring and fraud controls, while hospitals apply them to clinical pathways and billing. Regulatory focus on algorithmic fairness reinforces demand for transparent, governable decision platforms. Business specialists increasingly adopt low-code tools, broadening the user community beyond IT and amplifying regional growth momentum.
APAC Management Decision Market
Asia-Pacific is the fastest-growing region, set to advance at a 23.95% CAGR from 2026 to 2031. Governments across China, Japan, and India invest heavily in AI infrastructure and skills, fostering an environment conducive to large-scale decision deployments. Banks deploy real-time credit and fraud engines to expand financial inclusion, manufacturers embed decision logic in digital production lines, and public agencies roll out citizen-facing services powered by automated decisions. Diverse regulatory regimes spur the adoption of configurable governance modules that adapt to local compliance mandates without fragmenting enterprise standards.
Europe Management Decision Market
Europe retains a significant share on the back of stringent regulatory frameworks that prioritize explainability. The EU AI Act imposes rigorous obligations for high-risk systems, prompting financial and healthcare organizations to adopt platforms capable of detailed audit trails and natural-language rationale. Multinational firms require cross-border decision consistency, driving demand for centralized rule repositories and language-agnostic governance. Strong implementation partner ecosystems with domain and compliance expertise support steady growth across the region.
Regulatory Landscape
Regulation shaping the management decision market focuses on automated decision transparency, cyber resilience, and cross-border data movement. In the European Union, the AI Act (Regulation (EU) 2024/1689) sets enforceable requirements for high-risk AI use and transparency obligations, with initial provisions taking effect on 2 August 2026. This raises expectations around explainability, documentation, and market surveillance readiness in decision intelligence deployments.
Alongside AI governance, digital trade and security frameworks influence how cloud-based decision management operates for multinational data processing. For example, the EU-Singapore Digital Trade Agreement entered into force on 1 February 2026, providing a structure for digital trade rules that apply to cross-border services. Cybersecurity obligations also affect platform selection and operating models in Europe as NIS2 moved into enforcement after the 17 October 2024 transposition deadline, pushing regulated enterprises and their technology suppliers to strengthen security controls and incident readiness.
Value Chain Analysis
The value chain for management decision solutions covers data sourcing and integration, decision modeling and governance, application and workflow orchestration, deployment infrastructure, and ongoing optimization services. Upstream, enterprises use data platforms, connectors, and streaming capabilities to ingest transactional and behavioral data. Midstream, vendors package rule management, ML models, monitoring, and explainability in software, often delivered via cloud, which remains the dominant deployment mode. Downstream, system integrators and managed service providers implement and tune solutions, while business teams use low-code interfaces to maintain decision logic under centralized governance.
Infrastructure dependencies have become more visible as decision platforms are embedded into always-on operations and AI-heavy workloads. Supply constraints cited in 2026 for critical inputs beyond semiconductors, including advanced substrates and power components, and shipping disruptions around key routes such as the Strait of Hormuz, can affect data center and network rollout timelines tied to cloud delivery and real-time decisioning. At the connectivity layer for AI data centers, supplier actions such as the February 2026 multi-source agreement among US Conec, Hakusan, and Sanwa Technologies for MMC connectors and TMT ferrules indicate efforts to stabilize components used in high-density interconnects, which matter for scaling decision workloads on modern infrastructure.
Competitive Landscape
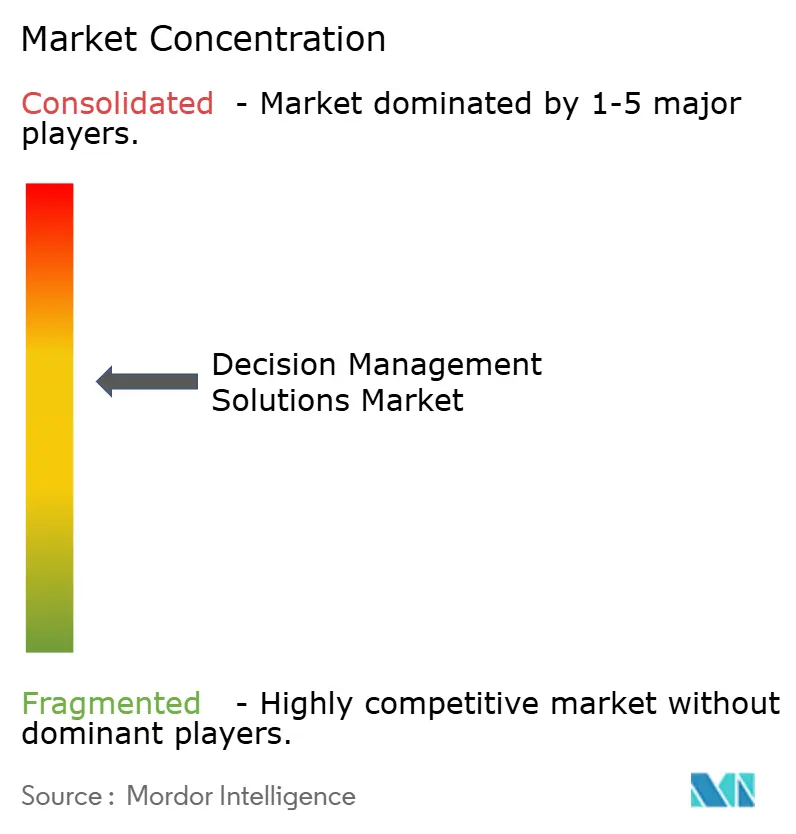
The management decision market features moderate concentration. IBM Corporation, Oracle Corporation, SAS Institute Inc., and FICO (Fair Isaac Corporation) anchor the field with broad platforms, global service networks, and deep industry templates. They bundle business rules, optimization, machine learning, and monitoring in unified suites and leverage longstanding enterprise relationships. Cloud-native entrants and AI-first startups compete with lighter, domain-focused offerings that emphasize speed of deployment and low-code configurability. Differentiation increasingly hinges on industry content, governance depth, and ease of use for non-technical roles.
Partnerships are critical as vendors integrate data ingestion, process automation, and monitoring components into end-to-end solutions. Leading providers cultivate marketplaces where specialist partners contribute decision assets such as risk scorecards or healthcare pathways. Mid-market customers are a priority segment where simplified pricing and turnkey accelerators resonate. Established vendors respond with modular packaging and consumption-based billing to repel insurgent competitors.
Generative AI both disrupts and enriches the competitive arena. Vendors introduce features that convert natural-language policies into executable rules or summarize model behavior for auditors. Leaders embed guardrails to prevent model drift and ensure reproducibility, maintaining trust. Players that balance innovation with rigorous governance are poised to capture share as enterprises scale decision automation across critical functions.
Management Decision Industry Leaders
-
IBM Corporation
-
Oracle Corporation
-
SAS Institute Inc.
-
TIBCO Software Inc.
-
FICO (Fair Isaac Corporation)
- *Disclaimer: Major Players sorted in no particular order
Management Decision Market Companies Covered in this Report
- IBM Corporation
- Oracle Corporation
- SAS Institute Inc.
- SAP SE
- FICO (Fair Isaac Corporation)
- Pegasystems Inc.
- TIBCO Software Inc.
- Actico GmbH
- Sapiens International Corp.
- Equifax Inc.
- Experian plc
- Scorto Inc.
- Sparkling Logic Inc.
- InRule Technology Inc.
- RapidMiner Inc.
- Teradata Corp.
- Alteryx Inc.
- DataRobot Inc.
- Decision Management Solutions
Market Opportunities and Future Outlook
Opportunities are expanding where organizations need to operationalize AI at scale while demonstrating governance, auditability, and resilience in automated decisions. In regulated environments, EU AI Act obligations taking effect from 2 August 2026 increase demand for platforms that combine machine learning with explicit rules, maintain decision logs, and generate human-readable rationales. This supports whitespace for vendors and service partners that provide implementation playbooks, model-risk controls, and compliance-ready decision documentation across BFSI, healthcare, and public sector workflows.
A second opportunity area is tied to ongoing buildout of digital and AI infrastructure that expands real-time decisioning use cases across networks, customer operations, and fraud controls. In 2026, telecom and infrastructure investors have announced large programs linked to AI and cloud delivery, including AT&T’s March 2026 commitment of USD 250 billion over five years for high-speed network infrastructure and TELUS’s May 2026 investment plan of CAD 66 billion through 2030 in Canada, which includes expanding AI compute facilities. These programs create demand for decision automation in capacity planning, service assurance, customer experience, and risk controls, while also encouraging hybrid and multi-cloud architectures that reduce lock-in concerns and raise integration requirements across ecosystems.
Recent Industry Developments in Management Decision Market
- July 2026: IBM was selected as one of four organizations supporting the US Internal Revenue Service (IRS) seven-year, USD 2.6 billion Enterprise Development Operations Services (EDOS) contract. The award reinforces demand for governed decision automation and data-driven operations in large public sector programs that require auditability, security, and long-term service delivery.
- May 2026: IBM expanded its partnership with Oracle, including making IBM Envizi available as a SaaS offering on Oracle Cloud Infrastructure (OCI) and adding managed services for Maximo on OCI. The move strengthens ecosystem-driven deployment options for enterprise decision workflows that depend on interoperable cloud platforms and shared governance.
- May 2025: IBM launched Watson Decision Platform 2.0, adding generative AI to help automate model creation from natural-language policies and enabling a shared workspace for business and IT governance. The release reflects vendor convergence of decision engines, orchestration, and AI explainability to shorten the insight-to-action cycle while keeping controls in place.
Management Decision Market Report Scope and Research Methodology
Market Definition and Coverage
This market covers revenues earned from commercially sold management decision software and related services that help organizations recommend or automate decisions inside business workflows by using data, rules, and analytics.
Scope exclusions: We exclude purely in-house tools that are built for internal use and are not licensed or sold to external customers.
Segments Covered in This Report
- By Component
- Software
- Services
- By Deployment Type
- On-premises
- Cloud
- By Organization Size
- Large Enterprises
- Small and Medium-size Enterprises (SMEs)
- By Function
- Risk and Compliance Management
- Customer Experience and Personalization
- Fraud Detection and Prevention
- Pricing and Revenue Optimization
- Other Function
- By End-User Industry
- Banking, Financial Services, and Insurance (BFSI)
- Information Technology (IT) and Telecom
- Healthcare
- Retail and E-commerce
- Manufacturing
- Government and Public Sector
- Other End-User Industry
- By Geography
- North America
- United States
- Canada
- South America
- Brazil
- Argentina
- Rest of South America
- Europe
- Germany
- United Kingdom
- France
- Spain
- Russia
- Rest of Europe
- Asia-Pacific
- China
- Japan
- India
- South Korea
- Australia and New Zealand
- Rest of Asia-Pacific
- Middle East and Africa
- Middle East
- Saudi Arabia
- United Arab Emirates
- Rest of Middle East
- Africa
- South Africa
- Egypt
- Rest of Africa
- Middle East
- North America
Data Sources, Market Sizing, and Validation
Desk Research
Desk work starts with getting the widest view of where decisioning spend is happening, how fast budgets are moving, and which industries are adopting automation. We used public sources such as the US Bureau of Labor Statistics, the US Census Bureau, OECD digital economy indicators, World Bank data series, and ISO or NIST publications that explain governance and standards around data and AI use.
After that, we reviewed company annual reports, earnings transcripts, investor decks, product documentation, and credible press coverage to understand typical buying motions and how software and services revenues are packaged. A paid subscription for company financials and intelligence was used selectively to fill private-company gaps, and a patent database was used to sanity-check where innovation activity is concentrating. These examples are illustrative only, and we also relied on other public sources for data collection, validation, and clarification.
Primary Interviews and Surveys
Primary work focused on converting published narratives into usable inputs, such as typical pricing approaches, adoption timing, and how much implementation and support is bundled into customer contracts. We spoke with a mix of software providers, service partners, and enterprise users across key industries, and we gathered feedback across major regions so regional deployment patterns and buying cycles could be reflected in the final model.
Distribution of primary research fieldwork respondents
| Company type | Respondent position | Region |
|---|---|---|
| Top tier: 38% | CXOs: 20% | APAC: 47% |
| Mid tier: 40% | Functional/Unit leaders: 36% | EMEA: 35% |
| Smaller Players: 22% | Managers: 44% | Americas: 18% |
Market-Sizing & Forecasting
For sizing, we first rebuilt the demand pool using a top-down approach that links enterprise software and analytics spending patterns to the share reasonably attributable to decision automation and decisioning workflow use cases. Once that structure was in place, selective bottom-up checks were used, such as sampled vendor revenue disclosures, channel conversations on typical deal sizes, and simple ASP times volume approximations, which helped adjust totals when a gap looked too wide.
Key inputs in the model include cloud adoption of decisioning tools, the pace of AI and automation program rollout inside enterprises, pricing and packaging shifts between software and services, the intensity of regulated decisioning use cases (for example, credit and fraud decisions), and the average implementation effort per deployment. For forecasting, scenario analysis was used so growth paths could be tested under different budget environments, and assumptions were then aligned to what interviewees described as realistic procurement cycles. Where bottom-up signals were incomplete for a country or vertical, we filled the gap through proxy ratios from similar adoption markets and then re-checked the result with primary feedback.
Data Validation & Update Cycle
Outputs are checked in more than one way before sign-off, including variance checks against independent indicators such as software budget growth, cloud migration rates, and observed shifts in automation-led programs. If a region or end-use looks unusually high or low, the assumptions are reviewed again, and targeted follow-up calls are triggered to confirm whether pricing, bundling, or adoption timing caused the swing.
The report is refreshed annually, and interim updates are made when material events change demand signals or pricing behavior. Before delivery, an analyst runs a final refresh pass so the numbers reflect the latest public information and the most recent expert feedback.
Mordor Intelligence's Management Decision Market Size Compared Against Other Published Estimates
Published market sizes for management decision often differ because the scope line is not the same, and because firms make different choices on what to count as software revenue versus services that sit next to it. Differences also come from base-year selection, currency timing, and whether the forecast assumes faster or slower enterprise adoption.
Contract packaging signals, buyer feedback on what is actually budgeted as decisioning, and cross-checks versus software spend indicators are the evidence points that keep Mordor Intelligence tied to commercially sold platforms plus related integration and support, instead of mixing in broader AI categories that do not always map to decision workflows.
Benchmark comparison
| Source | Market Size | Gaps in Research Methodology |
|---|---|---|
| Mordor Intelligence | USD 8.05 B (2026) | |
| Industry Publisher A | USD 10.55 B (2026) | Uses a wider definition that can pull in broader decision-making AI and adjacent analytics spending, and it may treat services as a larger add-on even when not directly tied to decisioning deployments. |
| Industry Publisher B | USD 11.73 B (2024) | Anchors on a different base year and a neighboring category labeled as decision-making AI, which can include general AI software that supports decisions but does not directly run decision workflows. |
The spread across sources mainly comes from how narrowly the decisioning workflow boundary is drawn, plus how services and adjacent AI tooling are counted. By keeping the inputs traceable to adoption and pricing checks, the final number stays repeatable, and the assumptions can be re-tested as packaging and cloud delivery models evolve.
Key Questions Answered in the Report
What is the current value of the management decision market?
The market is valued at USD 8.05 billion in 2026 and is on track to reach USD 20.19 billion by 2031.
Which component segment is growing fastest?
Services are expanding at a 21.95% CAGR through 2031 due to rising demand for implementation, governance and continuous optimization expertise.
Why is Asia-Pacific the fastest-growing region?
Strong government support for AI infrastructure, rapid digital transformation in banking and manufacturing, and a need for adaptable governance frameworks drive a 23.95% regional CAGR.
How are low-code platforms affecting adoption?
Visual authoring tools let business specialists build and update decision logic without coding skills, widening the user base and accelerating deployment across industries.
What makes explainable AI important for decision management?
Regulations such as the EU AI Act require that organizations can justify automated outcomes, so platforms that provide natural-language explanations and documented data lineage are preferred.
Which end-user industry shows the highest growth potential?
Healthcare is forecast to advance at a 24.1% CAGR as providers deploy decision support for clinical pathways and revenue cycle optimization while aligning with new AI guidelines.