
Managed MPLS Market Size and Share
Market Overview
| Study Period | 2020 - 2031 |
|---|---|
| Market Size (2026) | USD 19.55 Billion |
| Market Size (2031) | USD 25.37 Billion |
| Growth Rate (2026 - 2031) | 5.34% CAGR |
| Fastest Growing Market | Asia Pacific |
| Largest Market | North America |
| Market Concentration | Medium |
Major Players *Disclaimer: Major Players sorted in no particular order Image © Mordor Intelligence. Reuse requires attribution under CC BY 4.0. | |
Managed MPLS Market Analysis by Mordor Intelligence
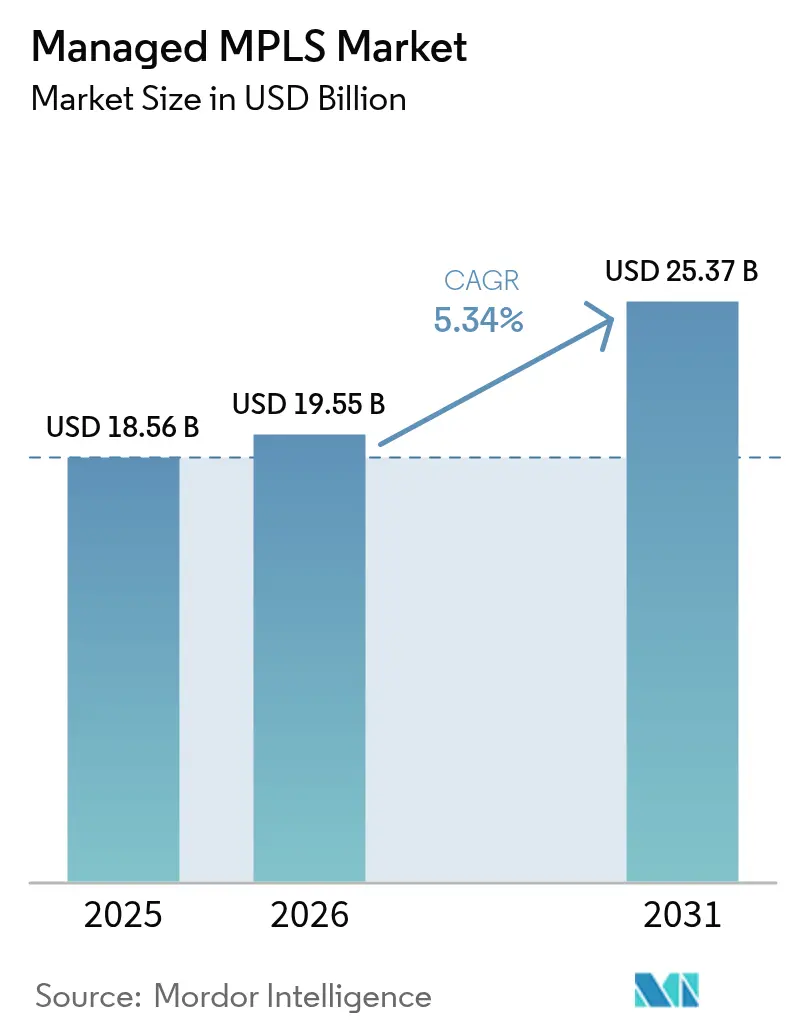
The managed MPLS market size is expected to grow from USD 18.56 billion in 2025 to USD 19.55 billion in 2026 and is forecast to reach USD 25.37 billion by 2031 at 5.34% CAGR over 2026-2031. Uptake is shaped by enterprises that blend SD-WAN overlays with MPLS underlays to keep voice, video, and real-time analytics on assured paths while routing non-critical traffic across broadband. Cost pressures encourage selective off-loading, yet the premium paid for guaranteed jitter below 10 milliseconds remains justifiable to finance, healthcare, and manufacturing firms that cannot risk packet loss. Carriers are bundling managed MPLS with private 5G backhaul and cloud on-ramps, turning a once stand-alone service into the anchor layer of network-as-a-service portfolios. Competitive differentiation hinges on fiber depth, direct cloud interconnects, and API-based orchestration that lets IT teams dial bandwidth without dispatching field engineers.
Key Report Takeaways
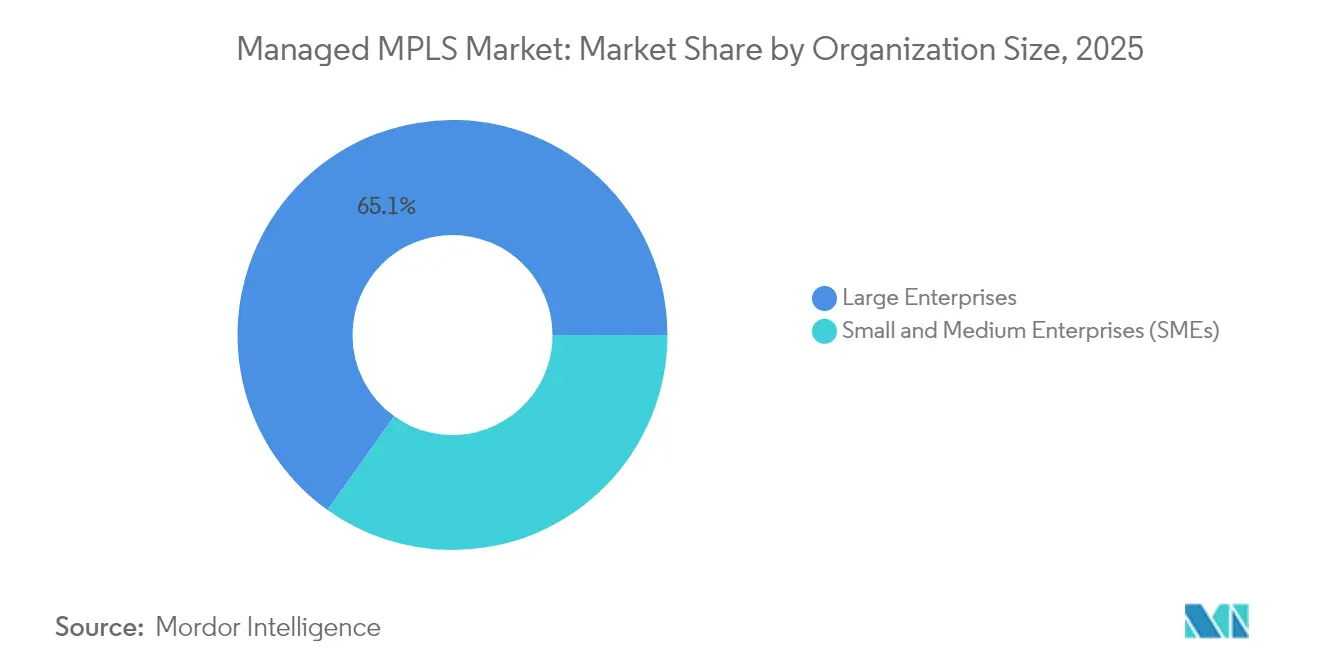
- By organization size, large enterprises held 65.12% of the managed MPLS market share in 2025, while small and medium enterprises are expanding at an 8.43% CAGR through 2031.
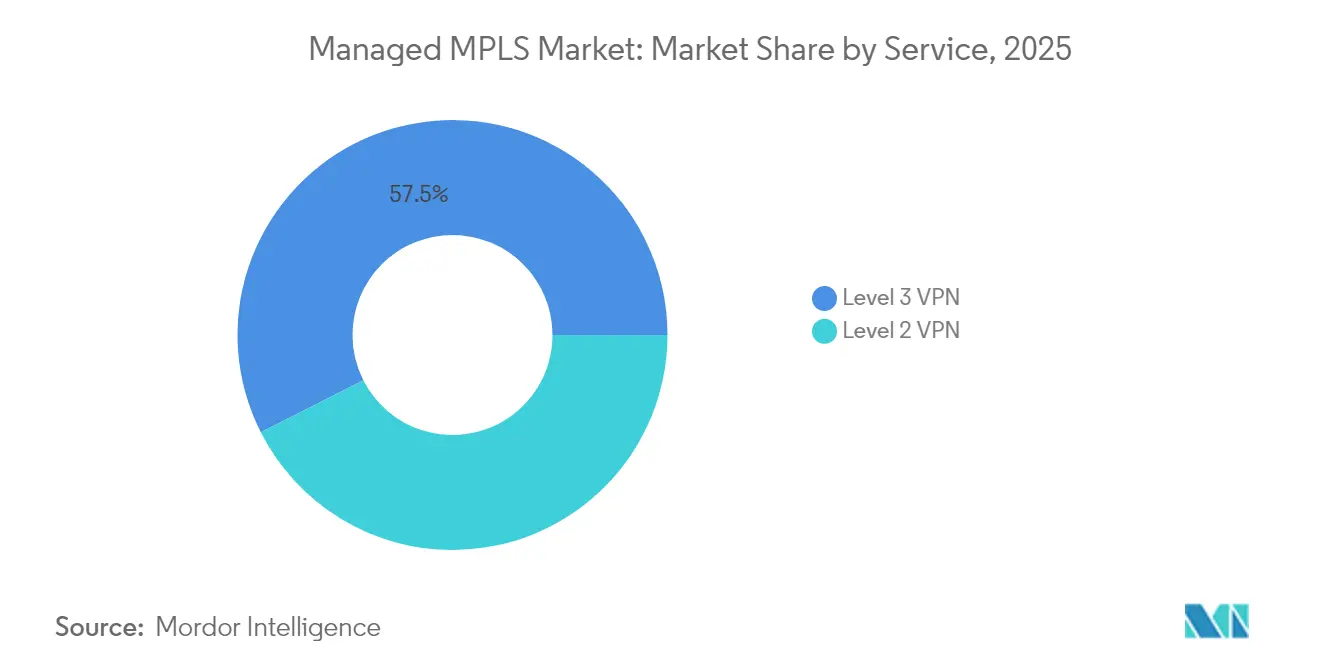
- By service type, Level 3 VPN accounted for 57.48% of the managed MPLS market size in 2025, whereas Level 2 VPN is growing at a 5.92% CAGR through 2031.
- By deployment mode, on-premises installations commanded 53.91% share of the managed MPLS market size in 2025, while cloud-based managed MPLS is rising at a 6.28% CAGR to 2031.
- By end-user vertical, Banking, financial services, and insurance controlled 31.68% of revenue in 2025, leveraging MPLS to secure payment rails and trading platforms. However, omnichannel retail is growing at 7.29% CAGR to 2031.
- By geography, North America led with 35.22% revenue share in 2025; Asia-Pacific is advancing at a 7.61% CAGR to 2031.
Note: Market size and forecast figures in this report are generated using Mordor Intelligence’s proprietary estimation framework, updated with the latest available data and insights as of 2026.
Global Managed MPLS Market Trends and Insights
Drivers Impact Analysis*
| Driver | (~) % Impact on CAGR Forecast | Geographic Relevance | Impact Timeline |
|---|---|---|---|
| Expansion of Mobile Backhaul Networks | +0.8% | Global, with concentration in Asia-Pacific and Middle East | Medium term (2-4 years) |
| Rising Adoption of Cloud-Based Enterprise Applications | +1.1% | North America, Europe, Asia-Pacific urban centers | Short term (≤ 2 years) |
| Hybrid SD-WAN and MPLS Deployments for Mission-Critical Traffic | +0.9% | Global, led by North America and Europe | Short term (≤ 2 years) |
| Rapid Proliferation of Internet of Things Devices Requiring Low-Latency Links | +0.7% | Asia-Pacific manufacturing hubs, North America industrial corridors | Medium term (2-4 years) |
| Shift of Remote Industrial Operations to Secure Managed MPLS Connectivity | +0.6% | Latin America, Middle East, Africa resource sectors | Long term (≥ 4 years) |
| Integration of Private 5G Backhaul with MPLS Core Networks | +0.5% | Asia-Pacific, Europe, North America enterprise campuses | Long term (≥ 4 years) |
| Source: Mordor Intelligence | |||
Expansion of Mobile Backhaul Networks
Mobile operators are extending fiber to cell sites to carry mid-band and millimeter-wave 5G traffic, and the same routes aggregate enterprise MPLS circuits. AT&T reported fiber reach to more than 27 million premises in 2024, lowering incremental costs to light new managed MPLS ports.[1]AT&T Inc., “2024 Annual Report,” att.com China Mobile and Bharti Airtel are following suit, embedding MPLS in national infrastructure so revenue is protected from SD-WAN substitution. The resulting volume stimulates price moderation without diluting service-level rigor, making MPLS more accessible to branch locations that previously relied on microwave or best-effort broadband.
Rising Adoption of Cloud-Based Enterprise Applications
Direct interconnects from MPLS cores into hyperscaler regions shrink round-trip latency by 20–40 milliseconds compared with internet VPN tunnels, a gap that preserves transaction integrity for payment processing and healthcare imaging. Verizon’s Private IP service now plugs into AWS Direct Connect and Azure ExpressRoute, enabling virtual networks to remain on private address space end-to-end. Fiber availability above 85% across U.S. metro areas makes these on-ramps practical for the mid-market, turning managed MPLS market demand toward cloud adjacency rather than branch-to-data-center alone.
Hybrid SD-WAN and MPLS Deployments for Mission-Critical Traffic
CIOs are adopting tiered connectivity, where SD-WAN steers low-sensitivity applications to broadband and reserves MPLS for voice and enterprise resource planning. Cisco’s SD-WAN software enforces application-aware policies that fail over to MPLS when broadband jitter exceeds thresholds, preserving call quality without manual intervention. Lumen noted that 60% of new enterprise contracts in 2024 bundled both layers, proving that the managed MPLS market remains integral inside hybrid WAN economics
Rapid Proliferation of Internet of Things Devices Requiring Low-Latency Links
Industrial firms stream telemetry that must reach analytics engines within 50 milliseconds to trigger predictive maintenance. Siemens relies on carrier MPLS circuits to link factory sensors in Germany and China with centralized analytics, keeping machine-learning loops unbroken. The Metro Ethernet Forum formalized IoT traffic benchmarks in its 2024 CE 3.0 update, effectively codifying MPLS as the transport of record for latency-sensitive industrial data
Restraints Impact Analysis*
| Restraint | (~) % Impact on CAGR Forecast | Geographic Relevance | Impact Timeline |
|---|---|---|---|
| High Total Cost of Ownership for MPLS Services | -0.9% | Global, most acute in cost-sensitive SME segment | Short term (≤ 2 years) |
| Enterprise Migration Toward Internet-Based VPN and Pure SD-WAN | -0.7% | North America, Europe mature markets | Short term (≤ 2 years) |
| Limited Availability of Skilled MPLS Engineers in Emerging Markets | -0.4% | Latin America, Africa, Southeast Asia | Medium term (2-4 years) |
| Long-Term Contract Lock-Ins Restricting Network Flexibility | -0.3% | Global, particularly impacting mid-market enterprises | Medium term (2-4 years) |
| Source: Mordor Intelligence | |||
High Total Cost of Ownership for MPLS Services
Monthly rates still range from USD 300 to USD 800 per megabit in North America, four to six times broadband equivalents, straining budgets for smaller organizations. Carriers are experimenting with relaxed service tiers that trade sub-10 millisecond latency for lower fees, but this move risks eroding the very differentiation that sustains premium pricing. Regional price competition in Asia has eased the gap, yet the perception of MPLS as expensive persists, tempering uptake in cost-sensitive verticals.
Enterprise Migration Toward Internet VPN and Pure SD-WAN
The maturation of SD-WAN lets firms aggregate multiple broadband links with automated failover, reducing reliance on MPLS for redundancy. BT Group cited churn in legacy MPLS accounts as clients pivoted to internet-centric architectures during 2024. High-speed internet penetration above 80% in North America and Western Europe fuels this shift, while emerging markets with patchy broadband continue to trust MPLS for deterministic performance.
*Our forecasts treat driver/restraint impacts as directional, not additive. The impact forecasts reflect baseline growth, mix effects, and variable interactions.
Segment Analysis
By Service: Level 2 Ethernet Gains Momentum for Cloud and Data-Center Interconnect
Level 3 VPN retained 57.48% of the managed MPLS market share in 2025, anchored in banking and insurance networks that need scalable any-to-any IP routing. The segment supports route summarization and traffic segmentation, providing operational familiarity to network architects. Level 2 VPN is advancing at a 5.92% CAGR as cloud-native firms stretch virtual LANs across regions without re-addressing or re-routing.
Deutsche Telekom’s Ethernet VPN lets customers migrate virtual machines live between on-premises clusters and public-cloud zones without downtime. The Metro Ethernet Forum’s CE 3.0 benchmarks promise sub-50 millisecond protection switching, matching or surpassing IP-based recovery times and encouraging adoption. These trends confirm that the managed MPLS market size for Level 2 services will expand faster than for entrenched Level 3 circuits, although absolute revenue remains skewed to IP-based VPNs because of their extensive embedded base.


By End-User Vertical: Retail Omnichannel Drives Fastest Growth
Banking, financial services, and insurance controlled 31.68% of revenue in 2025, leveraging MPLS to secure payment rails and trading platforms. However, omnichannel retail is growing at 7.29% CAGR as chains link point-of-sale devices, curbside pickup systems, and warehouse inventory in real time. Walmart’s private backbone connects more than 4,600 U.S. locations through carrier-grade MPLS to prevent outages during seasonal peaks.
Healthcare providers also favor MPLS for HIPAA-compliant transport of imaging and electronic records, and manufacturers tie it to industrial ethernet for robotic control. These vertical dynamics show that the managed MPLS market remains diversified, but retail’s surge will tilt incremental revenue toward branch-heavy networks that value jitter guarantees over raw throughput. Government agencies, information technology, and telecommunications firms, along with other end-user verticals, collectively represent the remainder of the market, with adoption patterns shaped by data-sovereignty regulations and budget cycles that favor multi-year procurement contracts.
By Organization Size: Cloud-Based Platforms Unlock SME Adoption
Large enterprises accounted for 65.12% of revenue in 2025, reflecting global footprints that require hundreds of meshed sites. Consumption-based billing and zero-touch provisioning now let smaller firms adopt MPLS without upfront capital outlay.
Vodafone Business offers pay-as-you-grow ports that SMEs can spin up through a portal, aligning network costs with cash flow. As orchestration APIs hide complexity, the managed MPLS industry finds a fresh addressable base. The managed MPLS market size tied to SMEs is projected to expand by an 8.43% CAGR, outpacing the overall growth rate even though absolute dollars remain lower than for multinational contracts. Large enterprises continue to dominate absolute revenue due to their higher per-site bandwidth requirements and preference for customized service-level agreements, yet the SME segment's rapid growth signals a market expansion beyond traditional enterprise accounts.
By Deployment Mode: Cloud Orchestration Erodes On-Premises Dominance
On-premises gear still represents 53.91% of the installed base, a legacy of depreciated routers and firewalls that organizations hesitate to scrap. Cloud-hosted routing, firewall, and SD-WAN functions delivered from carrier data centers are growing at 6.28% CAGR by minimizing truck rolls and speeding change requests.
Lumen’s Adaptive Network shifted routing into its own cloud edge to allow bandwidth upgrades in minutes. security directives that mandate documented failover favor this model because carriers can furnish geographically redundant points of presence without extra hardware on site. Consequently, the managed MPLS market is moving toward virtual network functions as the default, leaving physical appliances for edge cases that demand local policy control.
Geography Analysis
North America generated 35.22% of 2025 revenue, driven by dense fiber footprints and a high concentration of Fortune 500 headquarters. AT&T and Verizon upgraded core routes to 400-gigabit capacities, enabling 4K collaboration and real-time analytics over dedicated MPLS paths. Rural gaps persist, however, creating a two-speed market where branch offices in exurban areas face longer lead times and higher circuit costs. Canada’s updated wholesale rules are widening competition, which may temper pricing power in the managed MPLS market over the medium term. Mexico’s fiber expansion supports nearshoring by furnishing deterministic links between new factories and U.S. headquarters.
Asia-Pacific is the fastest-growing region at 7.61% CAGR through 2031. China Telecom’s CN2 connects more than 200 countries with latency-optimized MPLS routes, supporting factories that ship globally. India’s National Broadband Mission delivered fiber to 250,000 village councils, letting Bharti Airtel extend MPLS into tier-2 cities. Japanese, South Korean, and Australian carriers similarly capitalize on domestic fiber diets to target industrial IoT clusters in manufacturing corridors. This combination of infrastructure and industrial policy keeps the managed MPLS market momentum high across the region.
Europe, Middle East, and Africa present a mosaic of data-sovereignty mandates and cross-border needs. The EU Digital Markets Act demands interoperability, prompting carriers such as BT and Orange to integrate MPLS with SD-WAN and cloud interconnection under unified portals. Subsea cables financed by Middle East sovereign funds improve latency between African mining sites and European trading desks, while South African fiber reaches 70% of businesses in Johannesburg and Cape Town. Adoption outside metros lags, yet regulatory pushes for diversified economies support managed MPLS market demand in oil-free Gulf states and mineral-rich inland provinces.


Regulatory Landscape
Managed MPLS is governed mainly by telecom licensing and enterprise connectivity oversight, with growing emphasis on modernization, resilience, and standards compliance as operators shift core networks toward all-IP. In the United States, the FCC advanced an all-IP transition agenda in March 2026 through a Notice of Proposed Rulemaking addressing legacy intercarrier compensation reforms, reinforcing the long-term shift of carrier transport services toward IP-centric frameworks that also underpin managed MPLS delivery.
Standards and national technical requirements influence equipment selection and managed-service compliance for MPLS transport and VPN services. India’s Telecommunication Engineering Centre (TEC) issued TEC 48050:2025 in December 2025 for generic requirements for routers in MPLS-based transport networks, shaping procurement specifications for service providers and large enterprises. On the standards side, the IETF progressed updates to BGP MPLS-based Ethernet VPN procedures (RFC7432bis draft, March 2026), while Europe’s policy direction includes work around the European Electronic Communications Code review and preparation of a Digital Networks Act to streamline high-speed fiber and future network rollouts, which can affect how carriers price and package managed MPLS within broader enterprise network stacks.
Value Chain Analysis
The managed MPLS value chain begins with underlying physical connectivity (metro and long-haul fiber, subsea capacity, and access tail circuits) provided by infrastructure owners and wholesale providers. It then moves to IP/MPLS core operators that engineer traffic classes and resiliency, before managed service providers productize the offering into SLA-backed IP VPN (Level 3) and Ethernet VPN (Level 2) services.
Equipment and software suppliers (routers, optical transport, orchestration, security, and monitoring platforms) support carrier-grade QoS, telemetry, and policy control that enterprises purchase as a managed outcome rather than as standalone components. Service delivery and operations sit at the highest value-add layer, where providers design customer VRFs/VLANs, integrate cloud on-ramps (for example to AWS Direct Connect and Azure ExpressRoute), and run 24/7 monitoring with incident, change, and capacity management. Bottlenecks typically show up in access-circuit procurement and provisioning lead times, multi-vendor interoperability across hybrid WANs (MPLS plus SD-WAN plus internet), and maintaining consistent QoS and security controls across distributed cloud regions. As a result, carriers and global WAN providers are pushing toward single-contract, single-SLA operating models and portal-based ordering to reduce friction from quote-to-activate for multi-site enterprises.
Competitive Landscape
The managed MPLS market features moderate concentration. AT&T, Verizon, and Lumen dominate North American enterprise accounts through extensive last-mile fiber and bundled SD-WAN offerings that lock in wallet share. NTT, China Telecom, and Tata Communications mirror this scale across Asia-Pacific by pairing MPLS with local-language support and uniform service-level agreements. European incumbents such as BT, Orange, and Deutsche Telekom retain strong ties to government and finance, but face pricing heat from agile providers like Colt and GTT that leverage leased wavelengths. Strategic moves increasingly center on hybrid bundling. Verizon now offers private 5G backhaul pre-stitched into MPLS, positioning the service as the assured lane for cellular edge computing.[3]Verizon Communications Inc., “Private IP Cloud Connectivity,” verizon.com Deutsche Telekom upgraded its core to 400G to court hyperscalers needing predictable replication bandwidth. Emerging disruptors, including Megaport, use software portals and pay-as-you-go billing to address mid-market clients averse to multi-year lock-ins, introducing a fresh competitive vector that pressures incumbents to match agility.
Skill scarcity remains a barrier. Carriers that invest in automation and certification programs can cut provisioning windows from weeks to days, a step BT completed in early 2024 through zero-touch configuration. Regulatory data-localization in the EU, China, and India elevates incumbents that already possess in-country nodes, deterring newcomers. Overall, the sector is coalescing around service breadth rather than price wars, with success hinging on the ability to deliver deterministic performance across MPLS, SD-WAN, and private 5G as a single orchestrated fabric.
Managed MPLS Industry Leaders
AT&T Inc.
BT Global Services Limited
Cisco Systems Inc.
Lumen Technologies Inc.
Vodafone Group plc
- *Disclaimer: Major Players sorted in no particular order


Market Opportunities and Future Outlook
A key whitespace is in modernized, high-capacity IP/MPLS backbones that support cloud adjacency and emerging edge traffic patterns, while still offering deterministic service tiers for real-time enterprise applications. Evidence of this shift can be seen in core-network upgrades and transport simplification initiatives, including RETN completing a migration of 50% of its total IP/MPLS traffic onto 400G coherent pluggable optics across its Pan-Eurasian backbone in July 2026. This indicates a pathway for carriers to scale MPLS-backed services with higher port densities and streamlined operations.
For enterprise buyers, managed MPLS demand is increasingly framed inside hybrid WAN portfolios rather than stand-alone MPLS-only contracts. That creates opportunities for providers that bundle MPLS underlays with SD-WAN, SASE-aligned controls, and multi-cloud connectivity under a unified operational model. The 2026 Telegeography WAN manager survey showing MPLS present at an average of 22% of enterprise sites (versus Direct Internet Access at 54%) also points to a mixed-underlay reality, where providers can concentrate MPLS on latency- and loss-sensitive segments while using internet paths for best-effort traffic. Operator backhaul modernization programs using IP/MPLS platforms, such as Nokia’s 2025 agreement with Vodafone Idea to deploy 7750 SR and 7250 IXR series IP/MPLS products for IP backhaul upgrades in India, further support a services-led upsell path where managed MPLS capabilities are packaged alongside 4G/5G transport and cloud on-ramps for enterprises with distributed sites.
Recent Industry Developments
- June 2026: AT&T expanded 400G wavelength connectivity into more than 40 US metro markets and positioned it for faster business deployments, including stated turnaround windows as short as 15 days. The added capacity improves headroom for managed IP services where MPLS VPN performance depends on congestion-free cores and dense metro reach, supporting premium SLA delivery alongside cloud and AI-era traffic growth.
- April 2025: Vodafone Idea partnered with Cisco to deploy a new MPLS-based transport network to upgrade its 4G/5G backhaul in India. The collaboration links mobile transport modernization to IP/MPLS platforms, reinforcing MPLS as a carrier-grade underlay that can be operationalized with higher automation and scalability for enterprise-grade services.
- February 2025: BT Global Services announced its Global Fabric network-as-a-service platform was live with customer traffic, bringing together integrated connectivity services such as IP VPN and Ethernet. By shifting delivery toward an on-demand platform model, BT tightened the link between managed MPLS capabilities and multi-cloud connectivity, supporting faster provisioning and more flexible consumption for global enterprises.


Research Methodology Framework and Report Scope
Market Definition and Coverage
For this study, the managed MPLS market is the revenue earned from selling, operating, and supporting MPLS-based WAN connectivity for enterprise sites under a managed service contract, including SLAs, monitoring, and ongoing network management across regions.
Scope exclusions: The sizing excludes unmanaged MPLS circuits bought as pure connectivity, along with non-MPLS enterprise WAN services that do not use MPLS.
Segmentation Overview
- By Service
- Level 2 VPN
- Level 3 VPN
- By End-user Vertical
- Healthcare
- Banking, Financial Services and Insurance (BFSI)
- Retail
- Manufacturing
- Government
- Information Technology and Telecommunication
- Other End-user Verticals
- By Organization Size
- Small and Medium Enterprises (SMEs)
- Large Enterprises
- By Deployment Mode
- On-Premises
- Cloud
- By Geography
- North America
- United States
- Canada
- Mexico
- South America
- Brazil
- Argentina
- Chile
- Rest of South America
- Europe
- United Kingdom
- Germany
- France
- Italy
- Spain
- Rest of Europe
- Asia-Pacific
- China
- Japan
- India
- South Korea
- Australia and New Zealand
- Rest of Asia-Pacific
- Middle East and Africa
- Middle East
- United Arab Emirates
- Saudi Arabia
- Turkey
- Rest of Middle East
- Africa
- South Africa
- Kenya
- Nigeria
- Rest of Africa
- Middle East
- North America
Data Sources, Market Sizing, and Validation
Desk Research
Desk research starts with public signals that help estimate enterprise demand for private networking and track how telecom networks are being modernized. We reviewed sources such as the International Telecommunication Union (ITU), national telecom regulators and statistics offices, World Bank indicators, OECD digital economy statistics, and IETF RFC documentation for MPLS and VPN standards.
We then used annual reports, SEC filings, investor presentations, and service catalogs from telecom operators and managed network providers to map how offers are structured and which contract terms are typical in managed WAN engagements. Import-export shipment level databases were referenced selectively to sanity check cross-border movement of networking equipment where it supports traffic growth narratives, and patent databases helped validate the direction of network automation and SD-WAN overlay features that can affect MPLS attachment rates. These desk sources are illustrative, and additional public references were also used during the work to resolve gaps and clarify assumptions.
Primary Interviews and Surveys
Primary work focused on interviews and short surveys with telecom operator teams, managed service providers, enterprise network decision makers, and channel partners who support multi-site WANs. The goal of the interviews was to confirm how MPLS is packaged versus overlay services, what renewal cycles look like in practice, and what price movement is realistic for managed contracts. Fieldwork covered the Americas, EMEA, and APAC so regional demand assumptions could be aligned to how providers bundle and sell these services.
Distribution of primary research fieldwork respondents
| Company type | Respondent position | Region |
|---|---|---|
| Top tier: 33% | CXOs: 16% | APAC: 46% |
| Mid tier: 48% | Functional/Unit leaders: 33% | EMEA: 34% |
| Smaller Players: 19% | Managers: 51% | Americas: 20% |
Market-Sizing & Forecasting
Sizing is built using a top-down demand pool reconstructed from enterprise WAN connectivity needs. The addressable spend is filtered by MPLS penetration in managed WAN contracts and translated into value using typical managed service pricing.
To keep the numbers grounded, we also corroborate totals through selective bottom-up approximations, using sampled operator and provider revenue disclosures, channel checks, and a volume times ASP sanity check based on common site counts and bandwidth tiers.
Key inputs that move the model include the installed base of multi-site enterprises, the average number of connected sites per enterprise, typical access bandwidth mix, Level 2 VPN versus Level 3 VPN adoption, and the share of contracts delivered as on premises versus cloud managed designs. Pricing is handled with a progression curve driven by contract length, renewal timing, and observed discounting pressure from overlay alternatives. Where disclosure is limited, we apply conservative ranges, then narrow them using interview feedback.
For forecasting, we rely on scenario analysis supported by a light multivariate regression view. Drivers such as enterprise IT spend, broadband and fiber build-out pace, and regional traffic growth trends are used to shape a base case. When model outputs appear too aggressive or too soft against those drivers, assumptions are revisited and rechecked with respondents before locking the year-by-year path.
Data Validation & Update Cycle
Validation is done through several passes, where market totals are compared with independent signals like telecom business services revenue direction, enterprise networking budget trends, and observable shifts between VPN types and deployment modes. If a region or segment shows a sharp swing, we review the underlying price, penetration, and demand indicators, then do a quick re-contact with a small set of practitioners to confirm whether the change is real.
Before sign-off, the model is peer reviewed for formula consistency, unit logic, and year-on-year reasonableness. Large variances between approaches are documented and resolved through assumption adjustments. The report is refreshed annually, and interim updates are made when material events occur, such as large contract restructures, regulation changes, or major technology transitions that alter managed WAN buying behavior. Right before delivery, a final check ensures the latest public updates are reflected in the outputs.
Mordor Intelligence's Managed Mpls Market Size Compared With Other Published Estimates
Published market values for managed MPLS can look far apart, even when the titles sound similar, because the services counted are not always the same. Differences usually come from what is included alongside MPLS, which year is treated as the starting point, and how pricing and renewals are modeled across regions.
Non-MPLS managed WAN services like SD-WAN only contracts sit outside Mordor Intelligence's scope here, and that single exclusion can remove a large pool of spend that some publications blend into a combined managed WAN number. Gaps also show up when a study applies aggressive price erosion or assumes faster enterprise migration off MPLS without validating it with contract-cycle evidence and operator packaging practices, and then converts currencies using different annual averages.
Benchmark comparison
| Source | Market Size | Gaps in Research Methodology |
|---|---|---|
| Mordor Intelligence | USD 18.56 B (2025) | |
| Global Consultancy A | USD 60.12 B (2023) | The estimate appears to use an earlier base year and may be counting a wider managed WAN bundle where MPLS is not cleanly separated from adjacent managed connectivity and overlay services, which inflates the comparable value. |
| Industry Publisher B | USD 69.29 B (2025) | The published figure is materially higher for the same year, which often happens when unmanaged transport spend or broader VPN and network management revenues are included together, and when ASP curves are applied without clear checks against renewal timing and regional packaging differences. |
The spread in the table is mainly explained by scope mixing and base year framing, rather than a true disagreement on demand direction. By tying the sizing steps to a defined managed MPLS contract pool and then stress testing price and penetration assumptions with primary feedback, we keep the final value traceable to repeatable inputs instead of broad bundled totals.


Key Questions Answered in the Report
What is the projected revenue for the managed MPLS market in 2031?
The market is slated to reach USD 25.37 billion by 2031, reflecting a 5.34% CAGR from 2026.
Which region will post the fastest growth through 2031?
Asia-Pacific is expected to expand at a 7.61% CAGR due to manufacturing and IoT demand.
Why do enterprises adopt hybrid SD-WAN and MPLS architectures?
Hybrid designs cut total WAN spend by up to 50% while reserving MPLS for voice, video, and ERP traffic that needs deterministic latency.
How are carriers addressing cost concerns for small and medium enterprises?
Consumption-based billing, relaxed SLA tiers, and zero-touch provisioning reduce upfront costs and operational complexity for SMEs.
Which service type is gaining momentum for cloud connectivity?
Level 2 Ethernet VPN is growing at a 5.92% CAGR as firms extend virtual LANs between data centers and cloud regions without IP re-addressing.
What role does private 5G play in the managed MPLS market?
Carriers bundle MPLS backhaul with private 5G to guarantee sub-50 millisecond latency for industrial automation and real-time asset tracking.
Page last updated on:






