
Market Overview
| Study Period | 2020 - 2031 |
|---|---|
| Forecast Data Period | 2026 - 2031 |
| Base Year Market Size (2025) | USD 7.02 Billion |
| Market Size (2026) | USD 7.23 Billion |
| Market Size (2031) | USD 8.36 Billion |
| Growth Rate (2026 - 2031) | 2.96 % |
| Market Concentration | High |
Major Players *Disclaimer: Major Players sorted in no particular order Image © Mordor Intelligence. Reuse requires attribution under CC BY 4.0. | |
Malaysia Telecom MNO Market Analysis by Mordor Intelligence
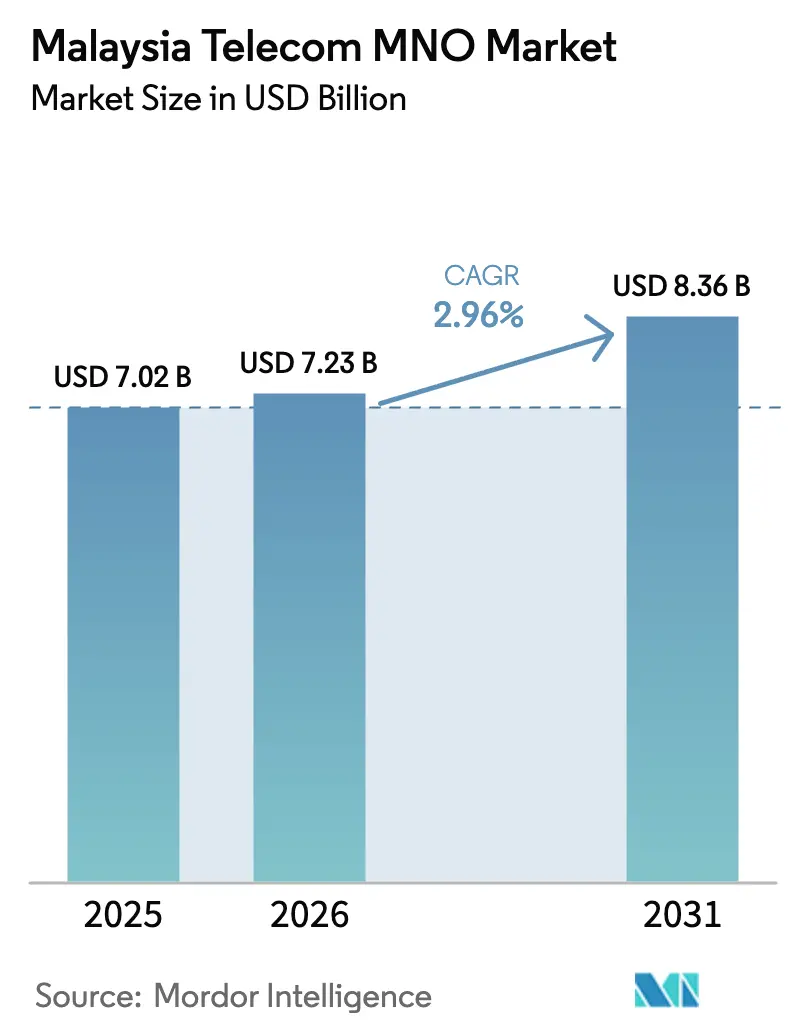
The Malaysia Telecom MNO Market size was valued at USD 7.02 billion in 2025 and estimated to grow from USD 7.23 billion in 2026 to reach USD 8.36 billion by 2031, at a CAGR of 2.96% during the forecast period (2026-2031).
The transition to a dual-network 5G regime, large-scale fiber build-outs, and rising enterprise digitization are the three forces most responsible for this steady uplift. Operators have moved decisively away from legacy voice-centric business models, prioritizing data-first strategies that blend nationwide 5G coverage with partnerships in cloud, content, and edge computing. Government programs such as JENDELA and the National Fiberisation and Connectivity Plan have de-risked much of the required capital outlay by underwriting tower upgrades and backhaul fiber, enabling operators to redeploy cash toward value-added enterprise propositions. At the same time, price-led competition in unlimited data plans continues to compress consumer margins, compelling carriers to chase higher-yield opportunities in private 5G, IoT, and fixed-mobile convergence. Against this backdrop, the Malaysia telecom MNO market is evolving from a scale game to one where differentiated capabilities in network slicing, AI-driven automation, and vertical-specific solutions define competitive advantage.
Key Report Takeaways
- By service type, data and internet services held 53.62% of Malaysia telecom MNO market share in 2025, while IoT & M2M registered the fastest 3.11% CAGR to 2031.
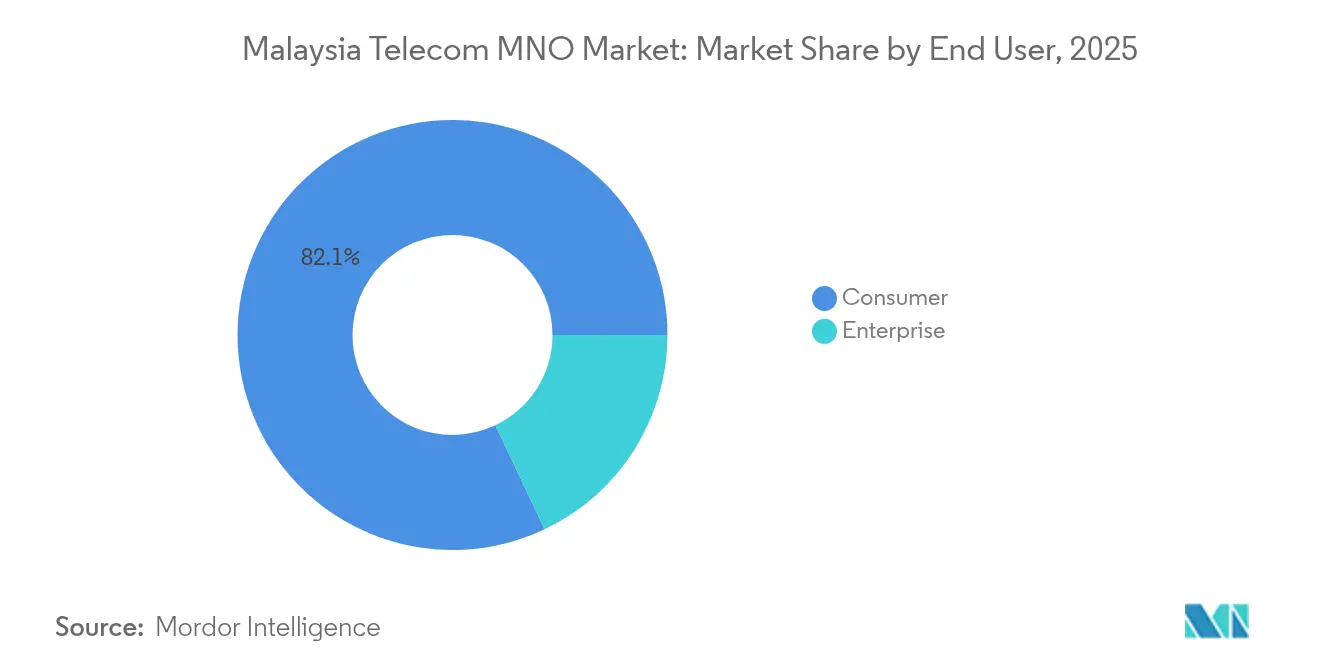
- By end-user, the enterprise segment delivered the highest 3.45% CAGR, whereas consumers still accounted for 82.05% of the Malaysia telecom MNO market size in 2025.
Note: Market size and forecast figures in this report are generated using Mordor Intelligence’s proprietary estimation framework, updated with the latest available data and insights as of 2026.
Malaysia Telecom MNO Market Trends and Insights
Drivers Impact Analysis*
| Driver | (~) % Impact on CAGR Forecast | Geographic Relevance | Impact Timeline |
|---|---|---|---|
| 5G coverage expansion under JENDELA & dual-network model | +0.8% | Klang Valley, Johor, Penang | Medium term (2-4 years) |
| Rising per-capita mobile data consumption & ARPU uplift | +0.6% | Nationwide, strongest in large cities | Short term (≤ 2 years) |
| Government-backed fiber rollout programs (NFCP, JENDELA) | +0.5% | National, prioritizing underserved areas | Long term (≥ 4 years) |
| Manufacturing clusters’ demand for private 5G & IoT solutions | +0.4% | Selangor, Johor, Penang industrial zones | Medium term (2-4 years) |
| Telco-OTT content bundling boosting Pay-TV & data upsell | +0.3% | Urban centers | Short term (≤ 2 years) |
| eSIM tourist & migrant plans adding incremental prepaid ARPU | +0.2% | Kuala Lumpur, tourist hotspots | Short term (≤ 2 years) |
| Source: Mordor Intelligence | |||
5G Coverage Expansion Under JENDELA & Dual-Network Model
The leap from a single wholesale network to a competitive dual-network structure rewrites infrastructure economics for every carrier. Digital Nasional Berhad achieved 80.2% population coverage by December 2024, and U Mobile’s mandate to erect a second nationwide grid introduces redundancy that should narrow wholesale fees and improve quality of service. U Mobile pledges 5,000–7,000 5G sites within 18 months in partnership with China Mobile International, an aggressive schedule that accelerates adoption while mitigating the prior fear of a bottlenecked monopoly. The dual-track rollout also unlocks spectrum for private 5G slices, positioning industrial zones for latency-sensitive applications such as machine-vision inspection and autonomous material handling. By removing single-supplier constraints, Malaysia telecom MNO market participants gain room to innovate on differentiated 5G tariffs and service-level agreements rather than competing solely on price.
Rising Per-Capita Mobile Data Consumption & ARPU Uplift
Monthly data usage is projected to jump from 21.6 GB in 2024 to 51.9 GB by 2029, propelled by 4K video streaming, cloud gaming, and AI-enhanced mobile apps. To capture this surge, carriers are phasing out throttled “unlimited” offers in favor of tiered 5G packages that monetize uncapped speeds. OTT alliances, typified by Astro’s bundle with Netflix and Disney+Hotstar, deliver sticky content ecosystems that lengthen tenure and combat churn. Operators nevertheless navigate a delicate balance; unlimited data plans below RM 50, now common across all networks, threaten to dilute potential ARPU gains if speed-based differentiation is poorly executed. Success hinges on migrating subscribers to premium speed tiers while reserving exclusive service features-such as edge-hosted gaming or UHD sports streams-for higher-priced plans.
Government-Backed Fiber Rollout Programs (NFCP, JENDELA)
The RM 21.6 billion National Fiberisation and Connectivity Plan delivers the backhaul critical to 5G densification and fixed-mobile convergence. JENDELA has already achieved 96.9% 4G coverage and targets 80% 5G population coverage by 2025, eliminating most rural black spots. Telekom Malaysia monetizes this build by wholesaling fiber to DNB for 5G backhaul, securing RM 2 billion over the next decade. Fiber ubiquity underpins new revenue streams in edge cloud, data-center interconnect, and wholesale access for hyperscale cloud providers, placing Malaysia telecom MNO market operators at the heart of Southeast Asia’s emerging digital-hub corridor.
Manufacturing Clusters’ Demand for Private 5G & IoT Solutions
Factories in Selangor, Johor, and Penang are spearheading private 5G adoption to automate production, improve safety, and enable real-time analytics. YTL Communications’ deployment at Clarion Malaysia cut manual errors to zero and boosted material throughput 80%, while PETRONAS and CelcomDigi are piloting offshore platform networks that support carbon-capture monitoring. These projects command premium fees because they rely on dedicated slices with guaranteed latency and redundancy. As enterprise case studies proliferate, demand is expected to extend into logistics parks, agri-tech plantations, and smart-city precincts, converting one-off projects into steady wholesale-network revenue.
Restraints Impact Analysis*
| Restraint | (~) % Impact on CAGR Forecast | Geographic Relevance | Impact Timeline |
|---|---|---|---|
| Aggressive unlimited-data price wars compressing margins | -0.7% | Nationwide, urban focus | Short term (≤ 2 years) |
| High spectrum fees & USO levies straining cash flow | -0.4% | National | Long term (≥ 4 years) |
| Foreign-ownership caps limiting fund-raising flexibility | -0.3% | National | Medium term (2-4 years) |
| Persistent rural coverage gaps prolonging digital divide | -0.2% | Sabah, Sarawak, interior | Long term (≥ 4 years) |
| Source: Mordor Intelligence | |||
Aggressive Unlimited-Data Price Wars Compressing Margins
Unlimited plans under RM 50 have set a low watermark that squeezes profitability just as 5G capex peaks. U Mobile’s prepaid offer with 5G-enabled weekends at RM 25 and CelcomDigi’s 3 Mbps plan at the same price have forced every carrier to replicate similar promotions. The resulting margin squeeze is stark: speed-based premiums vanish when baseline tariffs include uncapped data. Fair-usage throttling helps to limit network congestion after roughly 200 GB of use, yet customers increasingly view speed reductions as broken promises, risking churn and social-media backlash. To restore economics, operators now pivot toward enterprise contracts, content bundling and fintech adjacencies where elasticity is lower and willingness to pay is higher.
High Spectrum Fees & USO Levies Straining Cash Flow
Spectrum renewals and Universal Service Obligation payments consume capital that could otherwise accelerate 5G coverage. The 700 MHz sale to five licensees, including newcomer Altel, heightened competition for low-band frequencies while inflating bid values. Regulatory provisions that prohibit additional 5G surcharges further constrain pricing power, forcing carriers to absorb spectrum amortization within already-tight tariff structures. For U Mobile, the challenge is compounded by the need to lower foreign ownership from 48% to 20% while investing USD 681 million in new infrastructure—a delicate balancing act that may require asset-light partnerships or sale-and-leaseback deals.
*Our forecasts treat driver/restraint impacts as directional, not additive. The impact forecasts reflect baseline growth, mix effects, and variable interactions.
Segment Analysis
By Service Type: Data Dominates Revenue Momentum
Data and internet services captured 53.62% of Malaysia telecom MNO market share in 2025, running ahead at a 2.99% CAGR through 2031. Growing traffic from UHD streaming, Gen-AI smartphones, and cloud gaming drives operators to upscale backhaul and deploy carrier-grade edge nodes. Voice remains a 19.18% slice of Malaysia telecom MNO market size, cushioned by roaming recovery and unified-communications bundles sold into enterprise accounts, yet its 2.70% CAGR lags data-led verticals. Messaging, value-added services, and wholesale transit combine for 16.04% of revenue and post a 2.98% growth clip, buoyed by rising demand for bandwidth from hyperscale datacenter operators.
IoT & M2M stands at only 5.05% of total receipts but records the highest 3.11% CAGR, propelled by Industry 4.0 roadmaps and smart-city pilots within JENDELA corridors. The Malaysia telecom MNO market size for IoT modules is forecast to expand as manufacturing supervisors switch to predictive maintenance systems that rely on high-density sensor grids. OTT and Pay-TV services contribute 6.11% of revenue on a 3.05% trajectory; Astro’s direct billing partnerships with Netflix and Disney+Hotstar illustrate how carriers secure incremental ARPU via content aggregation.


By End-User: Enterprises Accelerate Digital Transformation
Consumers accounted for 82.05% of revenue in 2025, but their 2.80% CAGR reflects increasing saturation and tariff pressure. The segment’s future hinges on converting prepaid users to 5G value-tiers that bundle streaming, cloud gaming and lifestyle fintech services. Unifi Mobile’s Uni5G Wow 35 and Yes’s prepaid 5G packs show early success in migrating high-usage prepaid customers toward mid-tier postpaid offers, yet broad conversion requires further differentiation beyond raw speed.
Enterprises represent a leaner 17.95% of top-line today yet clock the fastest 3.45% CAGR through 2031, anchored by private 5G networks, cloud connect, and mission-critical IoT. Maxis’s memorandum with the Malaysia Retail Chain Association demonstrates how carriers package turnkey solutions spanning connectivity, analytics, and edge security to unlock higher service margins.Emerging verticals-energy, manufacturing, logistics-value guaranteed availability and deterministic latency, features operators can monetize at premium rates. As more industrial players pursue carbon-reduction and automation targets, Malaysia telecom MNO market operators will find enterprise revenue the principal hedge against consumer price wars.
Geography Analysis
Malaysia’s telecom revenue concentrates in the Klang Valley, Johor Bahru corridor, and Penang Island, where dense urban demand and robust industrial clusters enable swift monetization of new network capabilities. JENDELA delivered 96.9% 4G population coverage by 2024, and Digital Nasional Berhad reached 80.2% on 5G, giving Malaysia a sector-leading 97.3% 5G Consistency Score and median download speeds of 451.79 Mbps. The dual-network shift introduces geographic redundancy that should raise service reliability in metro areas while opening fresh coverage lanes into secondary towns
Rural and semi-urban zones now benefit from RM 21.6 billion in fiber outlays, connecting 7.5 million premises to gigabit speeds and preparing backhaul for upcoming 5G small cells. East Malaysia has seen 600 dormant towers reactivated, allowing Sarawak communities outside county seats to gain 4G and, eventually, mid-band 5G. Fixed-mobile convergence services, including hybrid fiber-5G home broadband, are expected to lift household penetration in Sabah’s interior.
Tourism and agriculture hubs, notably Langkawi and Cameron Highlands, stand to gain from eSIM-enabled visitor packages, unlocking incremental revenue from short-stay users. Smart-farming pilots employing NB-IoT soil sensors in Pahang illustrate how low-power networks can diversify revenue geographically, cementing the Malaysia telecom MNO market footprint across the nation.
Regulatory Landscape
Malaysia’s telecom MNO market operates under the Communications and Multimedia Act 1998, with oversight by the Malaysian Communications and Multimedia Commission (MCMC) across licensing, competition conduct, and service-quality obligations. A key structural policy shift is the government-backed move to a Dual Network 5G framework, following the earlier single wholesale approach via Digital Nasional Berhad (DNB). This change has influenced wholesale access arrangements and operators’ network investment paths.
In July 2026, the Dewan Rakyat passed the Malaysian Communications and Multimedia Commission (Amendment) Bill 2026 to strengthen MCMC governance and enforcement. The amendments include restrictions preventing members of Parliament and state legislative assemblies from serving as MCMC chairman or commission members, raising MCMC’s procurement threshold without additional approvals from RM5 million to RM50 million, and expanding MCMC audit and oversight powers covering communications service providers, infrastructure interoperability, and network and information-asset security and resilience.
Competitive Landscape
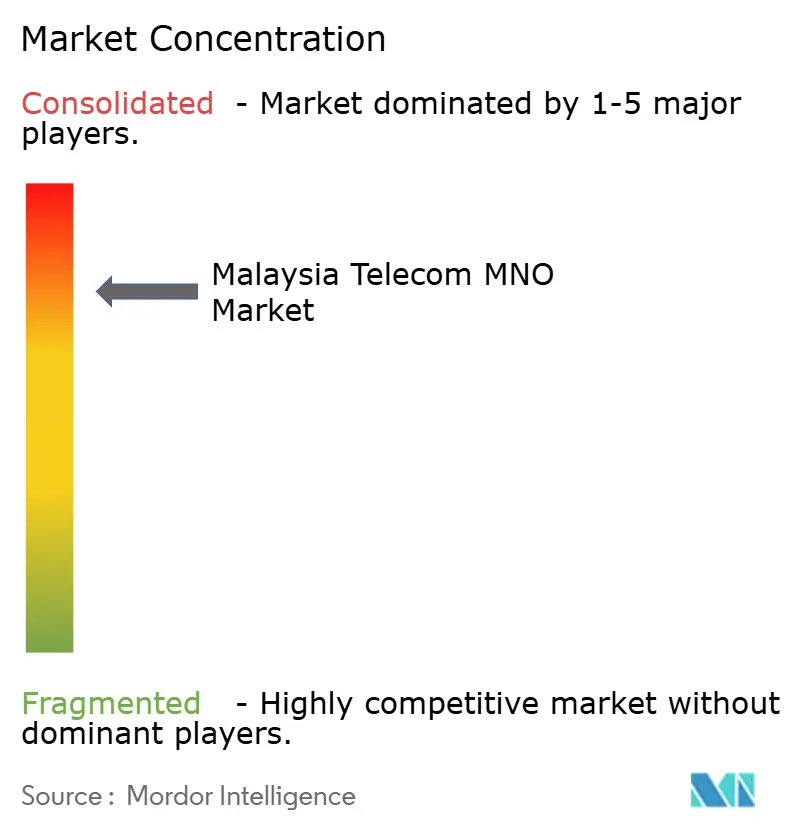
CelcomDigi leads with 47% subscriber share, capitalizing on post-merger synergies in retail footprint, spectrum holdings, and backhaul fiber. The 2024 network-integration program reached 75% completion and is projected to produce RM 1.1 billion in annualized opex savings by 2026. Maxis retains a sturdy 26% share, leveraging its cloud alliance with Google to embed Gen-AI capabilities into enterprise service bundles, an initiative expected to lift enterprise ARPU over the planning horizon.
U Mobile claims roughly 20% share and now pivots toward wholesale revenue by building the second nationwide 5G network. The carrier rejected a MYR 10 billion overture from Maxis and eyes an IPO before end-2025, signaling confidence in its infrastructure-sharing monetization model. Yes (YTL Communications) differentiates through price-leadership and early 5G unlimited offers, while Telekom Malaysia exploits wholesale fiber reach to become the de facto backhaul supplier for both 5G grids.
Strategic moves underscore a shift from pure network scale to ecosystem partnerships: Astro integrates multiple OTT apps into a unified billing engine; CelcomDigi offers CyberSecurity-as-a-Service powered by in-line AI; and Maxis pilots edge-cloud nodes at industrial parks to support computer-vision workloads. In this oligopoly of three dominant players, innovation now sprouts from platform collaborations rather than traditional spectrum auctions.
Malaysia Telecom MNO Industry Leaders
Celcomdigi Berhad
Maxis Berhad
U Mobile
Yes (YTL Communications)
Unifi Mobile (Telekom Malaysia)
- *Disclaimer: Major Players sorted in no particular order

Market Opportunities and Future Outlook
Malaysia’s shift into a dual-network 5G environment creates room for differentiation beyond consumer price-led offers, especially in enterprise-grade connectivity, private 5G use cases, and fixed-mobile convergence bundles. Enterprise digitization programs across manufacturing corridors (Selangor, Johor, Penang) and energy operations also provide a practical route to premium SLAs and managed services, building on live private-network activity such as YTL Communications’ 5G deployment at Clarion Malaysia and PETRONAS pilots with CelcomDigi for offshore connectivity.
Network and cloud ecosystem build-outs further expand adjacency opportunities in wholesale and interconnect. Telekom Malaysia’s role in fiber backhaul for 5G, alongside industry commentary pointing to continued momentum in fixed broadband and wholesale (including submarine cable IRU sales), supports monetization routes beyond traditional mobile ARPU. On the 5G wholesale side, the government’s put-option exercise on DNB, which saw CelcomDigi, Maxis, and YTL Communications each pay RM327.9 million to Ministry of Finance Inc., underscores ongoing capital and governance milestones that can influence how operators package 5G capacity, data quotas, and value-added services as the market moves toward higher-value plan structures and enterprise-led growth levers.
Recent Industry Developments
- July 2026: U Mobile commences exclusive service operation on its own nationwide ULTRA5G network following termination of wholesale access with DNB. This advances a dual-network rollout and supports greater independent 5G infrastructure and pricing flexibility.
- June 2026: U Mobile fully exited from DNB's 5G network. The change enables standalone 5G operations and creates new wholesale terms with DNB alternatives.
- April 2026: CelcomDigi, Maxis, YTL Communications each injected RM202 million as shareholder advance into Digital Nasional Bhd to support 5G operations and spectrum commitments. The funding sustains the dual-network framework and wholesale capacity for 5G expansion.


Research Methodology Framework and Report Scope
Market Definition and Coverage
For this study, the market is the total service revenue earned by mobile network operators in Malaysia from connectivity and related telecom services sold to consumer and enterprise users.
Scope exclusions: We exclude handset/device sales, pure equipment and construction revenue, and digital advertising revenues that sit outside operator telecom service billing.
Segmentation Overview
- Overall Telecom Revenue and ARPU
- Service Type
- Voice Services
- Data and Internet Services
- Messaging Services
- IoT and M2M Services
- OTT and PayTV Services
- Other Services (VAS, Roaming & International Services, Enterprise & Wholesale Services, etc.)
- End-user
- Enterprises
- Consumer
Data Sources, Market Sizing, and Validation
Desk Research
Desk research started with building a clean view of Malaysia telecom demand and pricing using public statistics and regulator reporting, which were then mapped to operator service lines. We referenced sources such as the Malaysian Communications and Multimedia Commission (Industry Performance Report and statistics), ITU indicators, World Bank population and income data, and GSMA Intelligence style metrics where available in public summaries, to anchor subscriber and usage direction.
After that, we cross checked the revenue picture using annual reports, audited financial statements, and investor presentations of listed operators, plus government policy releases tied to JENDELA and 5G rollout milestones. For consistency checks, we also used paid subscriptions for company financials and news, and a patent database to track network technology activity that can explain shifts in capex and service over time. The sources listed here are illustrative only, and other public and internal reference materials were used for validation and clarification.
Primary Interviews and Surveys
Primary work focused on validating the link between subscriber movement and service revenue, since promotional bundles and prepaid to postpaid shifts can change ARPU quickly. We spoke with operator side leaders, network planning and commercial managers, channel partners, and enterprise connectivity buyers across Malaysia, and then used their inputs to confirm service mix assumptions, pricing direction, and the timing of 5G monetization.
We also used findings from the calls to sanity check churn, SIM consolidation, and fixed mobile substitution from the desk based readings, then to fine tune forecast variables so they reflected actual buying behavior rather than only published targets.
Distribution of primary research fieldwork respondents
| Company type | Respondent position |
|---|---|
| Top tier: 38% | CXOs: 13% |
| Mid tier: 44% | Functional/Unit leaders: 35% |
| Smaller Players: 18% | Managers: 52% |
Market-Sizing & Forecasting
Sizing uses a top-down build where national connectivity demand signals are converted into an operator revenue pool, and then split by service type using observed mix shifts. Inputs that matter most for Malaysia include mobile subscriptions and penetration, 4G to 5G user migration timing, prepaid versus postpaid mix, ARPU direction by plan type, and data usage growth that impacts upsell and bundle pricing.
Those totals are then corroborated with selective bottom-up approximations, such as rolling up operator reported service revenue where disclosures allow, and using sampled price plan checks to translate subscriber counts into expected monthly spend. Where disclosures are missing or not comparable, gaps are handled by applying conservative ranges agreed during interviews, followed by a variance check against historical ratios.
Forecasting relied mainly on scenario analysis because policy decisions around wholesale 5G access, competitive intensity, and bundle structures can shift outcomes quickly. In each scenario, we apply agreed trajectories for ARPU and subscriber mix, and then reconcile the results with expert views on likely commercialization pace.
Data Validation & Update Cycle
Outputs are reviewed through multiple checks so one unusual input does not distort the final size. We compare results against independent signals like reported industry revenue direction, subscription trends, and operator level service mix disclosures, and then investigate large variances before internal sign off.
If an anomaly is found, such as an ARPU jump that is not supported by pricing behavior, we re check assumptions and may re contact interviewees to confirm what changed. Reports are refreshed annually, with interim updates when material events occur, and before delivery an analyst performs a fresh pass to ensure the latest public releases are reflected.
Mordor Intelligence's Malaysia Telecom Market Size Measured Against Other Published Estimates
Different published values for Malaysia telecom can look far apart because some sources size only one service bucket, while others mix several segments that are not billed the same way. Currency timing, the year chosen as the base, and whether prices are treated as headline plan rates or realized ARPU also tend to move the final number.
The main gap comes from counting only MNO service revenue and excluding fixed communication revenue, where Mordor Intelligence keeps the model tied to operator billed connectivity services instead of folding in fixed broadband and fixed voice revenues that are often reported as a combined total.
Benchmark comparison
| Source | Market Size | Gaps in Research Methodology |
|---|---|---|
| Mordor Intelligence | USD 7.02 B (2025) | |
| Trade Journal A | USD 5.10 B (2024) | This figure reflects mobile service revenue only for one year, so it can sit lower than a broader MNO service revenue model that includes adjacent operator service lines beyond core mobile service billing. |
| Trade Journal B | USD 1.90 B (2024) | This estimate is limited to fixed communication services revenue (fixed broadband plus fixed voice), so it is not comparable to an MNO focused market that centers on mobile operator service revenue. |
Taken together, the spread is mostly explained by scope rather than math, since one figure captures mobile service revenue, another captures fixed services, and our value covers the operator service revenue pool within the defined MNO frame. By keeping variables like subscriptions, ARPU, and 5G uptake consistent with interview feedback and public signals, the result stays traceable and repeatable when new yearly data comes in.


Key Questions Answered in the Report
How large is the Malaysia telecom MNO market in 2026?
It stands at USD 7.23 billion and, on a 2.96% CAGR, is tracking toward USD 8.36 billion by 2031.
Which service type earns the most revenue?
Data and internet services dominate with 53.62% share, outpacing every other category on both usage and monetization.
What segment is growing fastest?
IoT & M2M posts the quickest 3.11% CAGR, driven by Industry 4.0 deployments in manufacturing and energy.
How will the dual-network model affect competition?
It reduces wholesale bottlenecks, introduces price tension, and allows carriers to create differentiated 5G offers, especially for enterprise customers.
Page last updated on:


 Your data is secure and never sold or shared.


