
Market Overview
| Study Period | 2021 - 2031 |
|---|---|
| Forecast Data Period | 2026 - 2031 |
| Base Year Market Size (2025) | USD 26.77 Billion |
| Market Size (2026) | USD 28.31 Billion |
| Market Size (2031) | USD 36.74 Billion |
| Growth Rate (2026 - 2031) | 5.35 % |
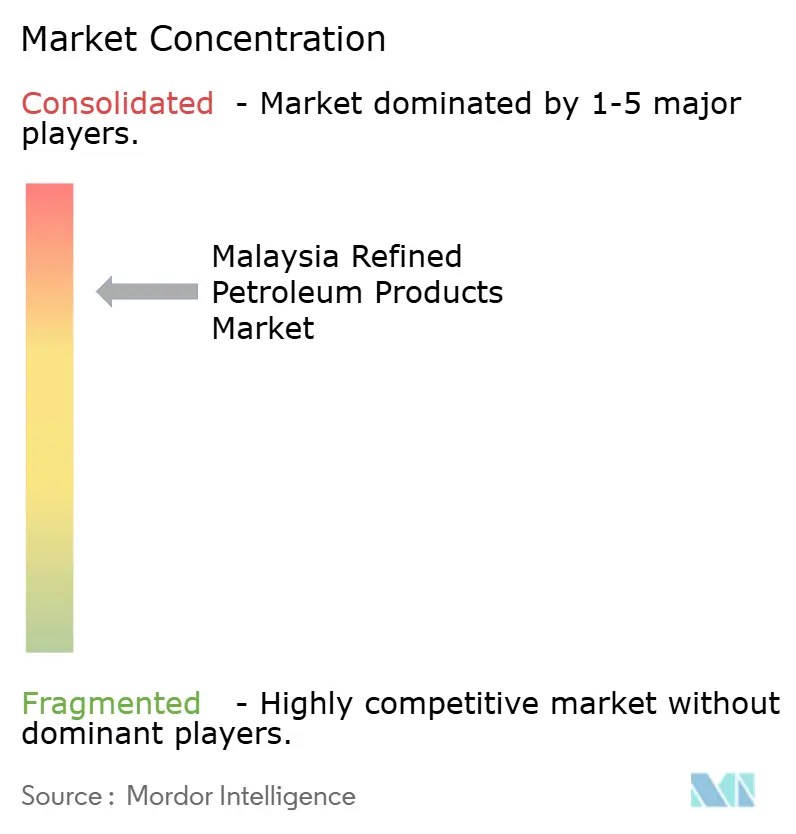
| Market Concentration | High |
Major Players *Disclaimer: Major Players sorted in no particular order Image © Mordor Intelligence. Reuse requires attribution under CC BY 4.0. | |
Malaysia Refined Petroleum Products Market Analysis by Mordor Intelligence
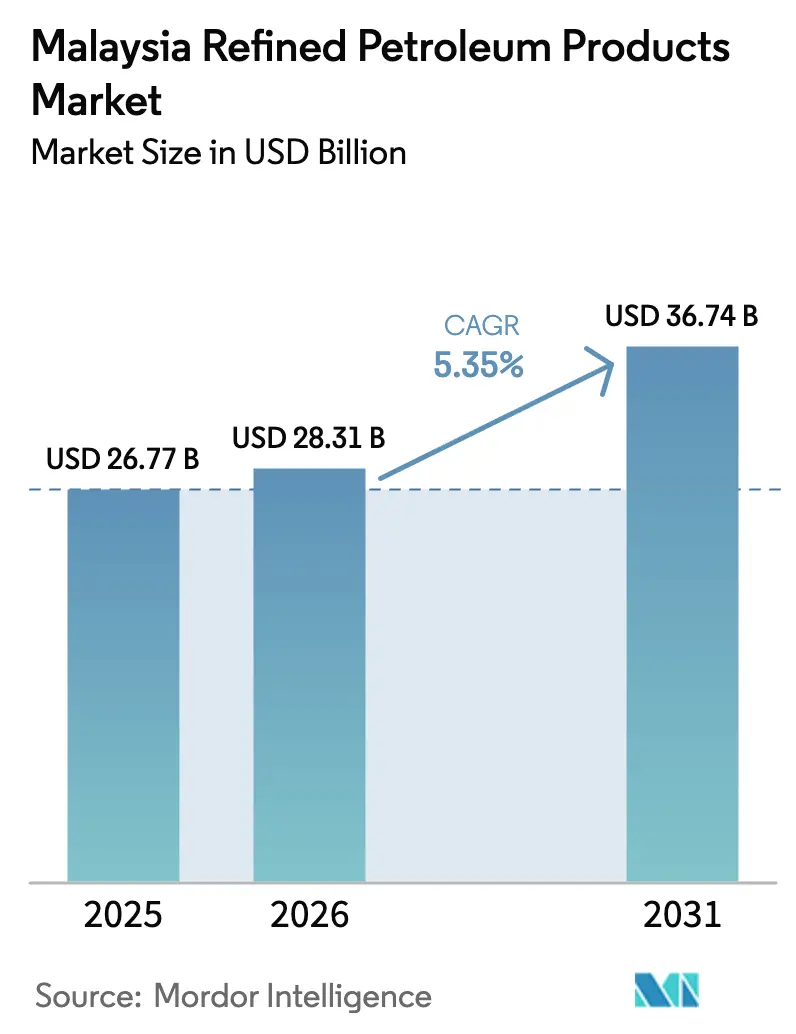
The Malaysia Refined Petroleum Products Market size is expected to grow from USD 26.77 billion in 2025 to USD 28.31 billion in 2026 and is forecast to reach USD 36.74 billion by 2031 at 5.35% CAGR over 2026-2031.
This market size underscores Malaysia’s status as Southeast Asia’s key refining and bunker-supply node, yet policy pressure that favors Euro 5 fuels and bio-blends is reshaping product slates. Petrol retained volume leadership in 2025, but aviation fuel is rising fastest as airlines restore capacity and a 650,000-tonne-per-year sustainable aviation fuel (SAF) plant comes onstream at Pengerang. Low-sulfur grades already account for more than half of the pool, reflecting the April 2021 Euro 5 diesel mandate and the September 2025 Euro 5 petrol rollout. Domestic refineries deliver two-thirds of the overall supply, even while periodic imports from Singapore and North Asia balance outages. Retail fuel stations still dominate distribution, but online and automated delivery applications such as Setel are expanding briskly. Transportation stands as the largest consuming sector, whereas marine bunkering is registering the sharpest growth as Port Klang and Pengerang challenge Singapore’s scale.
Key Report Takeaways
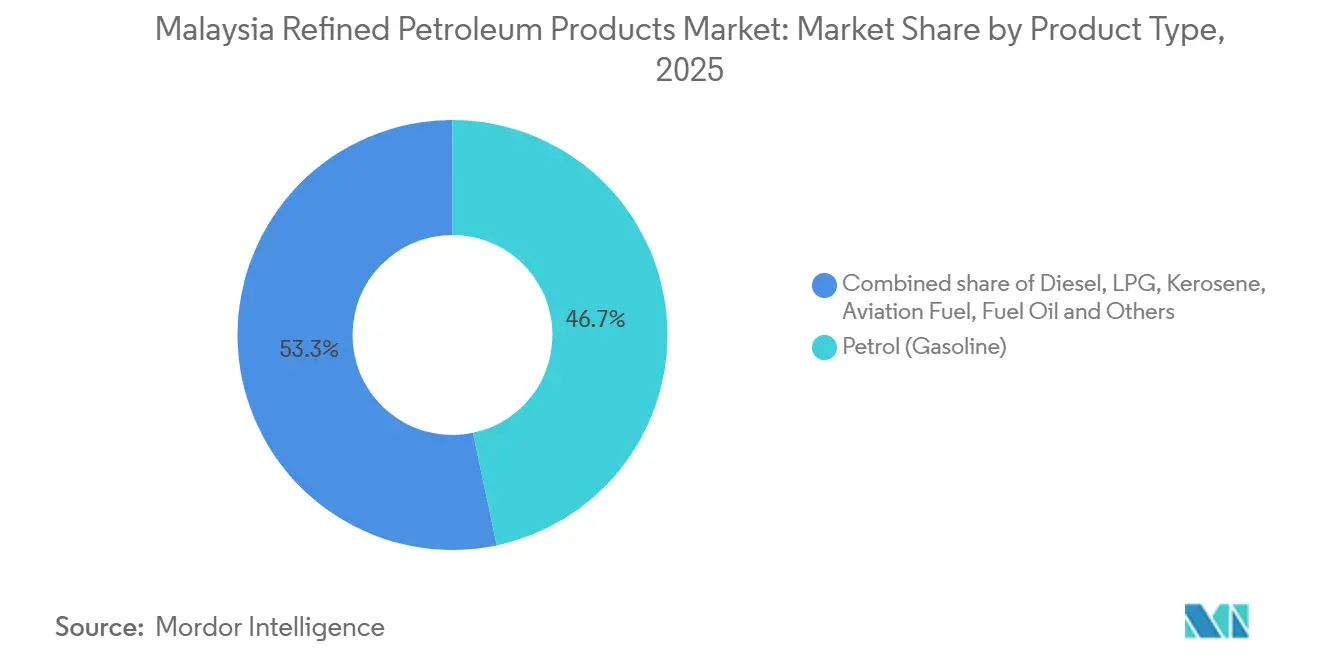
- By product type, petrol held 46.7% of Malaysia's refined petroleum products market share in 2025, and aviation fuel is forecast to expand at a 7.5% CAGR to 2031.
- By sulfur content, low-sulfur fuels captured a 55.1% share of the Malaysia refined petroleum products market size in 2025 and are advancing at a 5.9% CAGR through 2031.
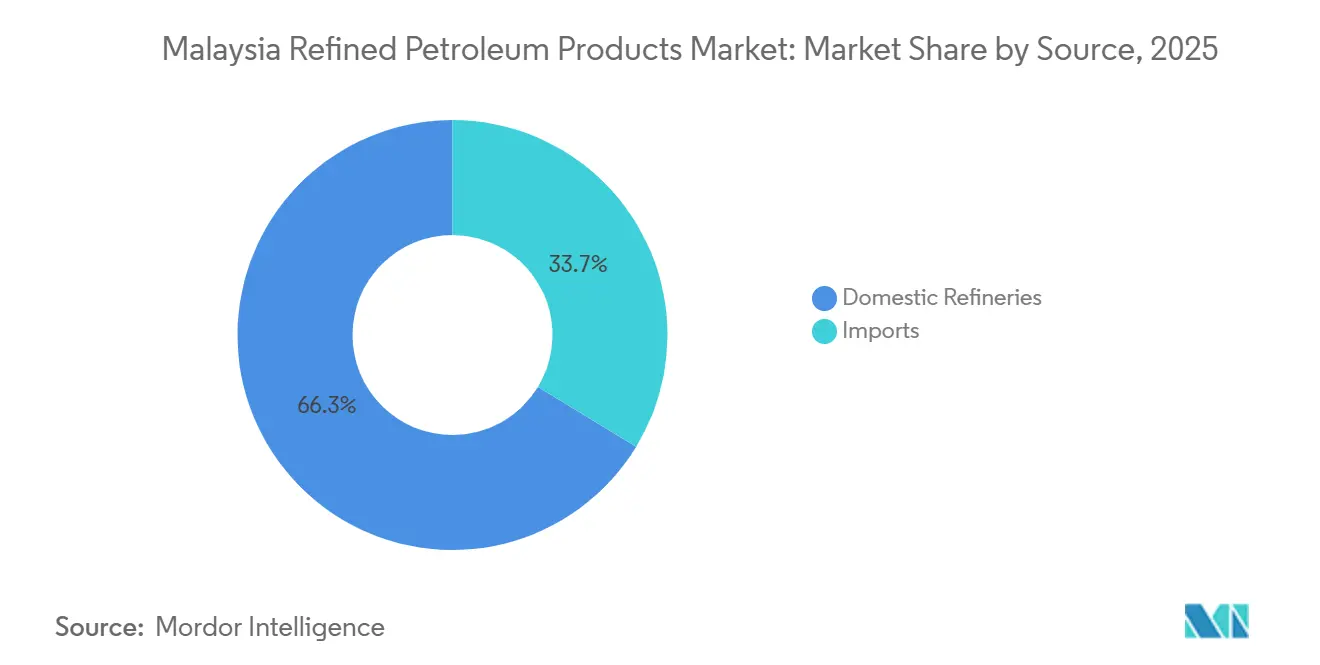
- By source, domestic refineries supplied 66.3% of demand in 2025, while imports posted a 4.6% CAGR to 2031 as seasonal balancing cargoes persisted.
- By distribution channel, retail fuel stations commanded 60.5% volume in 2025; online and automated delivery is growing at 9.7% CAGR to 2031.
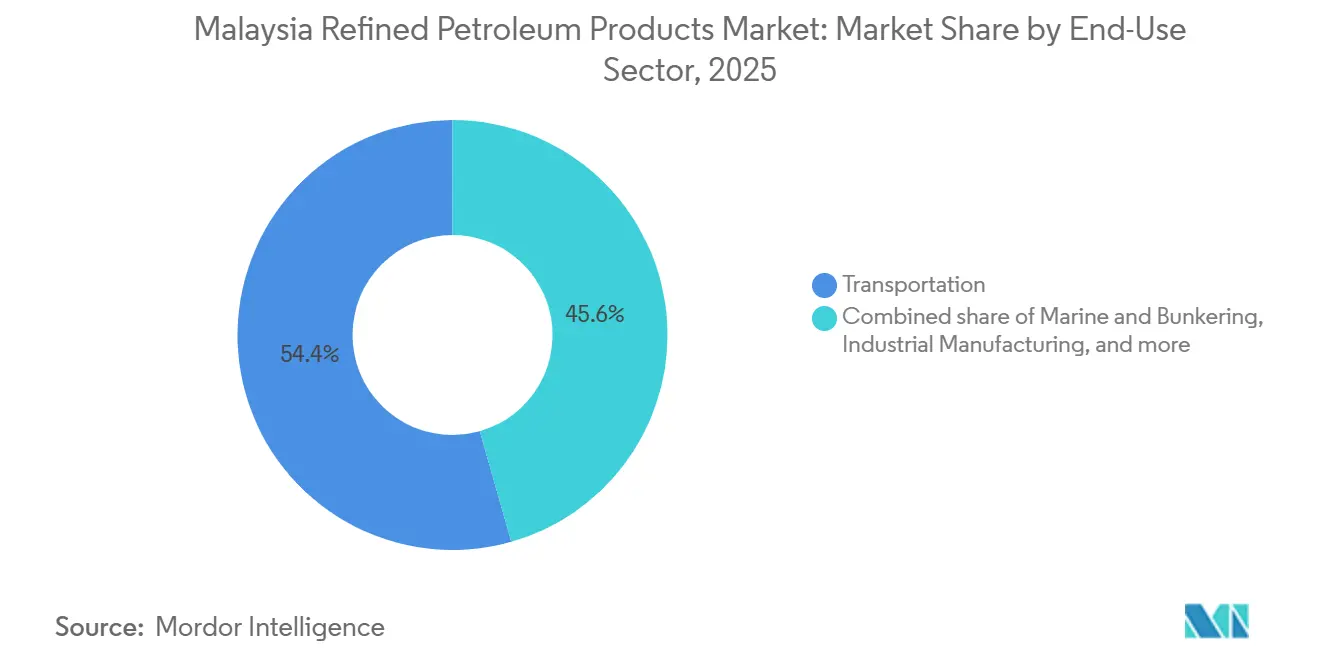
- By end-use sector, transportation absorbed 54.4% of demand in 2025; marine and bunkering are expanding at a 10.1% CAGR through 2031.
- Peninsular Malaysia represented more than 60% of the Malaysia refined petroleum products market.
Note: Market size and forecast figures in this report are generated using Mordor Intelligence’s proprietary estimation framework, updated with the latest available data and insights as of January 2026.
Malaysia Refined Petroleum Products Market Trends and Insights
Drivers Impact Analysis*
| Driver | (~) % Impact on CAGR Forecast | Geographic Relevance | Impact Timeline |
|---|---|---|---|
| Surge in domestic transportation fuel demand | 1.2% | Peninsular Malaysia (Selangor, Kuala Lumpur, Johor), spillover to Sabah and Sarawak | Medium term (2-4 years) |
| Expansion of petrochemical downstream integration | 0.8% | Johor (Pengerang), Melaka, potential expansion in Sarawak (Bintulu) | Long term (≥ 4 years) |
| Government incentives for bunker fuel hub development | 1.0% | Johor (Pengerang, Port of Tanjung Pelepas), Selangor (Port Klang) | Medium term (2-4 years) |
| Bio-refinery investments for Sustainable Aviation Fuel | 0.6% | Johor (Pengerang), national aviation sector impact | Long term (≥ 4 years) |
| Strategic stockpiling policies enhancing refinery utilization | 0.5% | National, with primary storage expansion in Johor (Pengerang, Tanjung Langsat) | Medium term (2-4 years) |
| Regional supply-chain shifts due to shipping lane realignments | 0.4% | Malacca Strait corridor, Johor (Pengerang), Selangor (Port Klang) | Medium term (2-4 years) |
| Source: Mordor Intelligence | |||
Surge in Domestic Transportation Fuel Demand
Malaysia added 799,731 vehicles in 2023, with passenger cars dominating registrations and cementing a robust gasoline and diesel requirement despite fewer than 20,000 cumulative electric vehicles by 2024.[1] Subsidized RON95 pricing at MYR 1.99 per liter shields household budgets, yet mid-2025 subsidy retargeting moves higher-income drivers toward RON97, sustaining overall throughput. Fuel retailers are cushioning thin margins through Setel’s DuitNow QR and Touch ’n Go e-wallet integration, which streamlines forecourt payments for nine million users. Long-haul trucking between Peninsular hubs and East Malaysian states depends on diesel, insulating demand from localized EV adoption concentrated in Klang Valley urban centers.[2]
Expansion of Petrochemical Downstream Integration
The Pengerang Integrated Complex couples 300,000 bpd of refining with 3.3 million tpy of petrochemical capacity, allowing PETRONAS to swing output between fuels and higher-margin olefins.[3] Hengyuan is studying a similar naphtha-to-olefins retrofit at Port Dickson but must lock in feedstock and financing before proceeding. Integrated assets position Malaysia to ship polymer precursors to Vietnam and Indonesia, which imported more than 1.5 million t of Malaysian chemicals in 2024. Dialog Group’s storage farms at Pengerang provide blending and staging flexibility that minimizes vessel waiting time.[4]
Government Incentives for Bunker Fuel Hub Development
Putrajaya introduced tax holidays on bunker fuel and funded floating-storage upgrades to lure some of the 94,000 annual Malacca Strait transits that now refuel in Singapore. Dialog’s additional 150,000 m³ of tankage at Tanjung Langsat will be ready by FY 2027 and is earmarked largely for marine fuels. PETRONAS Marine already supplies very-low-sulfur, ultra-low-sulfur, high-sulfur, bio-blend, and LNG bunkers, letting operators hedge among compliance options.
Bio-Refinery Investments for Sustainable Aviation Fuel
PETRONAS, Enilive, and Euglena reached a final investment decision on a 650,000-tpy SAF and hydrotreated vegetable-oil unit that will start commercial operations in H2 2028. Feedstock is palm-oil-mill effluent and used cooking oil, converting a waste stream into jet fuel that sells at up to five times the conventional price. The Malaysian Aviation Commission will rebate landing fees for flights fueled with local SAF, creating a demand pull that de-risks the plant’s offtake.
Restraints Impact Analysis*
| Restraint | (~) % Impact on CAGR Forecast | Geographic Relevance | Impact Timeline |
|---|---|---|---|
| Accelerating EV adoption and fuel efficiency improvements | -0.3% | Selangor, Kuala Lumpur, early spillover to Penang and Johor Bahru | Medium term (2-4 years) |
| Carbon taxation and removal of fuel subsidies | -0.5% | National, with acute impact in Peninsular Malaysia (diesel, RON95 gasoline) | Short term (≤ 2 years) |
| Volatility in crude import differentials affecting refinery margins | -0.4% | National refining sector, particularly independent refiners (Hengyuan, Petron Malaysia) | Short term (≤ 2 years) |
| Tightening marine fuel sulfur regulations compressing HSFO demand | -0.3% | Johor (Pengerang bunkering hub), Selangor (Port Klang), national marine sector | Medium term (2-4 years) |
| Source: Mordor Intelligence | |||
Accelerating EV Adoption and Fuel Efficiency Improvements
Charging points increased from 1,500 in 2023 to 3,354 by October 2024, and the target is 10,000 by the end of 2025. Even so, range anxiety outside Selangor and Kuala Lumpur slows uptake. Deloitte finds that 58% of consumers still prefer internal combustion vehicles, given the MYR 42,000–60,000 entry price versus MYR 124,000-plus for EVs. Fuel-efficiency standards that push automakers toward hybrids will trim per-vehicle consumption by 20-30% over a decade.
Carbon Taxation and Removal of Fuel Subsidies
Malaysia will introduce a carbon tax in 2026, expected at USD 5–10 per tonne of CO₂, following the June 2024 diesel subsidy removal that lifted pump prices 40% in Peninsular Malaysia. RON95 subsidy retargeting in mid-2025 exempts the top income decile, saving MYR 50 billion in annual outlays but exposing refiners and retailers to margin squeeze. Exporters must also prepare for the EU Carbon Border Adjustment Mechanism, which will penalize high-carbon fuels landing in Europe from 2026 onward.
*Our forecasts treat driver/restraint impacts as directional, not additive. The impact forecasts reflect baseline growth, mix effects, and variable interactions.
Segment Analysis
By Product Type: Aviation Fuel Outpaces Gasoline Volume Leadership
Petrol retained 46.7% of the Malaysia refined petroleum products market share in 2025, powered by 719,160 passenger-vehicle additions in the prior year. Aviation fuel is poised for a 7.5% CAGR as passenger traffic rebounds toward 112.9 million journeys and as local SAF supply ramps from 2028. Diesel remains essential for a commercial fleet that burned 7.9 billion liters on roads in 2025. LPG dominates household cooking, while kerosene shrinks with near-universal electrification. Fuel oil demand hinges on scrubber-equipped ships and industrial boilers; high-sulfur grades persist in the bunker segment. Naphtha supports PETRONAS RAPID's 3.3 million tpy cracker, generating a higher downstream margin than gasoline blending.
This segment will continue to pivot toward jet and marine grades as air travel and shipping expand, whereas gasoline growth moderates under efficiency norms. Aviation fuel will therefore raise its slice of Malaysia's refined petroleum products market by 2031, even as petrol maintains absolute volume dominance.

By Sulfur Content: Low-Sulfur Mandates Reshape Refinery Yields
Low-sulfur fuels captured 55.1% of Malaysia's refined petroleum products market share in 2025 after Euro 5 diesel took effect in 2021 and Euro 5 petrol followed in 2025. The category should post a 5.9% CAGR, aided by SAF blending that inherently meets ultra-low-sulfur thresholds. High-sulfur fuels hold the remaining 44.9% share, buoyed by power plants and scrubber-equipped vessels yet capped at 4.6% CAGR as compliance costs rise.
Domestic refiners have invested in hydrotreaters to meet the 10 ppm ceiling, with PETRONAS Melaka spending MYR 1.2 billion in 2020 and Hengyuan operating a hydrocracker that can hit Euro 5 specs when feedstock availability allows. The shift secures regional arbitrage opportunities, since Singaporean and Thai refiners already supply Euro 5 blends, but it also raises hydrogen demand and operating costs.
By Source: Domestic Refineries Anchor Supply Amid Import Arbitrage
Domestic refineries delivered 66.3% of output in 2025 and will grow at a 5.8% CAGR as turnarounds abate, and new hydrotreating units run at high utilization. Malaysia's refined petroleum products market size, attributed to imports, will remain material because Q2 2025 alone saw USD 4.7 billion in incoming cargoes, mostly from Singapore, South Korea, and China.
While Malaysia exported USD 4.9 billion in products the same quarter, the net trade balance can swing quickly when unplanned downtime hits. Dialog Group's additional 150,000 m³ of storage by FY 2027 will strengthen buffer capacity and support a strategic-reserve target of 90 days' cover by 2028.
By Distribution Channel: Automated Delivery Disrupts Retail Dominance
Retail forecourts handled 60.5% of sales in 2025 but face margin compression from subsidy roll-backs. Setel’s mobile ordering and QR payment features have raised forecourt throughput and user stickiness, helping participating stations recover 3–4 percentage points of lost margin. Online and automated refueling shows a 9.7% CAGR as fleet operators favor time savings over loyalty points.
Commercial bulk and direct contracts remain critical for airlines, shippers, and power utilities that negotiate formula-linked diesel, marine gas oil, and SAF supply. The Malaysia refined petroleum products market will increasingly blur channel lines as retail sites add EV chargers under a streamlined 87-day permitting process that cuts retrofit cost to MYR 56,700.
By End-Use Sector: Marine Bunkering Surges as Transport Plateaus
Transportation accounted for 54.4% of 2025 demand but will flatten toward 2031 as efficiency gains offset vehicle growth. Marine bunkering stands out with a 10.1% CAGR as Malaysia offers tax-exempt fuels and competitive pricing to divert traffic from Singapore.
Industrial, power, petrochemical, residential, and agricultural segments each have niche drivers. Pan-Borneo Highway construction sustains bitumen and diesel demand, while RAPID’s naphtha cracker secures feedstock from its adjacent refinery. Tenaga Nasional reduces fuel oil burn as natural gas capacity rises, trimming a traditionally price-sensitive slice of the Malaysia refined petroleum products market.
Geography Analysis
Peninsular Malaysia houses four refineries totaling more than 700,000 bpd, supplies over 60% of national consumption, and concentrates the majority of the 3,354 EV charging stations reported in October 2024. Diesel subsidy removal in June 2024 raised logistics costs but accelerated the adoption of aerodynamic kits and route-optimization software among haulers. Selangor and Kuala Lumpur lead early electrification, so that gasoline erosion will occur first in these corridors.
Johor’s Pengerang hub is evolving into a dual-energy node where conventional crude runs alongside renewable feedstock conversion. Dialog’s 5.1 million m³ storage, much of it connected to RAPID, supports both endeavors. The state benefits from port infrastructure and preferential tax schemes that aim to build a bunker-fuel ecosystem capable of challenging Singapore on price and product breadth.
East Malaysia lacks major refinery capacity and continues to receive fuel via coastal tankers or imports routed through Singapore. Diesel subsidies remain intact in Sabah and Sarawak at MYR 2.15 per liter, buffering plantation and mining operations. PETROS is evaluating a 150,000 bpd Bintulu refinery to cut import reliance, but no final decision has been reached. Ongoing Pan-Borneo Highway work keeps bitumen flows robust, and LNG shipments from Bintulu spur local demand for marine gas oil bunkering.
Regulatory Landscape
Malaysia’s refined petroleum products sector operates under a layered governance framework led by federal ministries and statutory acts. The Petroleum Development Act 1974 underpins national petroleum oversight by vesting ownership and control of petroleum resources in PETRONAS, while the Ministry of Domestic Trade and Cost of Living (KPDN), through its Petroleum Regulatory Division, regulates licensing and the controlled supply of fuels and other scheduled goods under the Supply Control Act 1961, including subsidy administration via its Supply and Subsidy Division.
Environmental and operational compliance for refineries and terminals is enforced by the Department of Environment (DOE) under the Environmental Quality Act 1974, with additional oversight spanning investment and industrial policy bodies such as MITI and MIDA. Safety and build standards for downstream facilities are reinforced through agencies such as BOMBA and CIDB, shaping permitting and storage and handling upgrades as Malaysia’s product slate shifts toward lower-sulfur grades and alternative blends.
Value Chain Analysis
Malaysia’s refined petroleum products value chain starts with crude and feedstock sourcing, through domestic production and imports, then moves to refining, blending, storage, and distribution to end users across transportation, aviation, industry, power, and marine bunkering. As of 2023, Malaysia had 997,000 bpd of refining capacity, anchored by PETRONAS-operated assets alongside Hengyuan Refining Company, Petron (San Miguel), and Kemaman Bitumen, while imports from regional hubs continue to balance outages and product-mix gaps.
Downstream logistics and commercialization concentrate around integrated hubs and ports in Peninsular Malaysia, particularly around Johor’s Pengerang Integrated Petroleum Complex ecosystem. The Pengerang Integrated Complex (PRefChem, a PETRONAS and Saudi Aramco joint venture) operates a 300,000 bpd refinery producing Euro 5 specification fuels, supported by large-scale storage and jetty infrastructure that enables domestic redistribution and bunkering supply. Final delivery routes include retail stations, commercial bulk sales, direct contracts for airlines and marine customers, and expanding digital-enabled channels.
Competitive Landscape
Top Companies in Malaysia Refined Petroleum Products Market
PETRONAS integrates upstream production, three large refineries, petrochemical assets, and more than 1,000 stations, granting scale that competitors cannot match. Independent refiners Hengyuan and Petron Malaysia rely on merchant margins tied to Singapore crack spreads, which averaged USD 8.11 per barrel for gasoline and USD 15.53 for diesel in 2024, leaving thin buffers for maintenance shocks.
Strategic themes include petrochemical integration, renewable feedstock processing, and digital engagement. PETRONAS secured SAF leadership via the Pengerang biorefinery, while Dialog is locking in long-term take-or-pay storage contracts. Setel’s nine-million-strong platform adds value through loyalty bundling, EV charging, and roadside services, transforming traditional fuel retail into a mobility ecosystem.
Barriers to entry revolve around hydrotreating capital, carbon reporting capability, and logistics footprint. The upcoming 2026 carbon tax forces refiners to model capture options or absorb additional costs. Meanwhile, adherence to IMO lifecycle assessment rules favors suppliers with transparent feedstock chains, a niche where PETRONAS leverages its palm-oil-mill-effluent sourcing advantage. Overall, the competitive field is consolidating around players able to fund low-carbon upgrades and multichannel customer interfaces.
Malaysia Refined Petroleum Products Industry Leaders
-
Chevron Corporation
-
Petroliam Nasional Berhad
-
Shell PLC
-
FIVE Petroleum Malaysia Sdn Bhd
-
Petron Malaysia Refining & Marketing Bhd
- *Disclaimer: Major Players sorted in no particular order
Market Opportunities and Future Outlook
An opportunity set is taking shape around low-sulfur compliance fuels, bunker-fuel hub development, and low-carbon product integration, supported by national programs and operating assets. Malaysia’s National Energy Transition Roadmap (NETR) provides a structured platform for investment themes that intersect with refining and fuels demand, including energy efficiency, hydrogen, bioenergy, green mobility, and CCUS, while the existing Euro 5 production base at PRefChem’s 300,000 bpd Pengerang refinery supports cleaner on-road and marine-grade supply and strengthens Malaysia’s position for regional cargoes.
Decarbonization-linked services and infrastructure also create whitespace across measurement, reporting, and physical abatement. NETR-linked CCUS initiatives led by PETRONAS at Kasawari and Lang Lebah point to an in-country pathway for managing high-CO2 streams, with potential spillovers into downstream carbon accounting and lower-carbon fuel propositions, especially alongside subsidy reforms and the announced 2026 carbon tax that increase the value of efficiency and emissions transparency. On the distribution side, digital and automated delivery models already scaling in Malaysia, including Setel-enabled retail ecosystems, support differentiated pricing, fleet servicing, and data-driven inventory planning, while port-centric storage and terminal expansions at nodes such as Port Klang and Pengerang align with rising marine and aviation fuel complexity.
Recent Industry Developments
- May 2026: Shell Malaysia Trading Sdn Bhd - Groundbreaking for the expansion of the Shell Westport Fuels Terminal in Port Klang, Selangor, involving the addition of three gasoline and diesel tanks to accommodate Medium Range vessel parcels. The expansion enhances terminal capacity and throughput for midsize vessel parcels. It strengthens Shell's logistics footprint in Peninsular Malaysia.
- December 2025: PETRONAS Dagangan Berhad - Recorded highest sales volume for Mogas, driven by Setel application integration and increased jet fuel uplift. The record Mogas volume shows growing retail and aviation demand supported by Setel integration.
- September 2024: Shell Malaysia Trading Sdn Bhd and Shell Timur Sdn Bhd - Awarded a long-term contract to Orkim Sdn Bhd to charter two shipping vessels for petroleum product distribution across Peninsular and East Malaysia. The contract secures distribution capacity across Peninsular and East Malaysia, strengthening supply chain resilience.
Research Methodology Framework and Report Scope
Market Definition and Coverage
This market is defined as the value of refined petroleum products supplied into Malaysia across the full downstream chain, where volumes are linked to local consumption needs and trade flows, and then valued in USD using consistent pricing logic.
Scope exclusions: Upstream crude oil production, natural gas, and petrochemicals are excluded from this market sizing.
Segmentation Overview
- By Product Type
- Petrol (Gasoline)
- Diesel
- LPG
- Kerosene
- Aviation Fuel
- Fuel Oil (HSFO, VLSFO)
- Others (Bitumen, Naphtha)
- By Sulfur Content
- Low-Sulfur (Up to 10 ppm)
- High-Sulfur (Above 10 ppm)
- By Source
- Domestic Refineries
- Imports
- By Distribution Channel
- Retail Fuel Stations
- Commercial Bulk Sales
- Direct Supply Contracts
- Online/Automated Fuel Delivery
- By End-Use Sector
- Transportation
- Power Generation
- Industrial Manufacturing
- Petrochemicals
- Residential and Commercial
- Marine and Bunkering
- Agriculture and Mining
Data Sources, Market Sizing, and Validation
Desk Research
Desk work starts with building the country fuel balance so we can see what is produced, imported, exported, and used locally before it is converted into value. For Malaysia, we relied on official energy and trade statistics such as IEA country energy balances, the Energy Institute Statistical Review, UN Comtrade, and Malaysia government publications from the Department of Statistics and the Ministry of Domestic Trade and Cost of Living (for regulated fuel context).
We also used public refinery and downstream disclosures through annual reports, exchange filings, and investor presentations, followed by association and port or terminal publications where available to cross-check distribution patterns. In a few cases, paid subscriptions for company financials and intelligence, news and financials, patents, and shipment-level import and export records were used to fill gaps on capacity changes and product movements. This list is not exhaustive, and many other sources were reviewed to collect data, validate it, and clarify open questions.
Primary Interviews and Surveys
Primary discussions were held with downstream operators, distributors, and large end users, and then key assumptions were rechecked with logistics, marine and aviation fuel buyers, and industry advisors. We used these inputs to confirm demand drivers, typical supply routes, pricing pass-through under controls, and realistic ranges for product mix shifts across Peninsular and East Malaysia.
Distribution of primary research fieldwork respondents
| Company type | Respondent position |
|---|---|
| Top tier: 37% | CXOs: 16% |
| Mid tier: 44% | Functional/Unit leaders: 39% |
| Smaller Players: 19% | Managers: 45% |
Market-Sizing & Forecasting
Market sizing is built from a top-down fuel-balance reconstruction, where national consumption signals are aligned with refinery output and net trade by key refined products, and then mapped into USD market value. After that, results are corroborated with selective bottom-up approximations such as sampled pump price and ex-refinery price checks, channel checks on retail versus bulk share, and a limited roll-up of major supply and distribution participants to keep totals realistic.
Key model inputs include product-wise demand by end use (transportation, industrial manufacturing, marine and bunkering, and aviation), refinery throughput and utilization, import and export direction by major product groups, and regulated price periods that can temporarily break the usual price-to-volume relationship. We also track short-term indicators like vehicle fuel demand recovery, industrial output direction, and airport and port activity because the main clause arrives only after these signals are reconciled, which is the implied demand pool used for sizing.
For forecasting, scenario analysis is used to reflect differences between stable policy periods and periods with subsidy or price-control adjustments, and then the final path is smoothed with trend-based techniques when volatility is clearly temporary. When a bottom-up check is missing for a smaller channel or niche product, gaps are handled through proportional allocation from the product balance and then re-tested during interviews so the final numbers remain reproducible.
Data Validation & Update Cycle
Validation is done by triangulating model outputs against independent signals, including refinery operations direction, trade statistics, and observable demand proxies tied to transport and industrial activity. Outliers are flagged early, and we recheck the underlying driver, such as an unusual import spike, a short-term pricing distortion, or a step-change in refinery utilization, before the dataset is accepted.
A multi-step review is followed where assumptions and calculations are checked by another analyst, and then open points trigger re-contact with relevant interviewees when variance stays high. Reports are refreshed annually, with interim updates when major events occur, and before delivery a fresh pass is completed so clients receive the latest view rather than an older snapshot.
Mordor Intelligence's Malaysia Refined Petroleum Products Market Size Compared With Other Published Estimates
Published market values for refined fuels in Malaysia can look far apart, even when they sound like they cover the same topic. Differences usually come from what is counted as a refined product market, which pricing layer is applied, and whether the number is anchored to domestic demand or to a wider trading hub view.
Petrochemicals sit outside Mordor Intelligence's scope, and that single exclusion often explains why some published values look higher when they mix fuels with broader downstream revenue pools. Gaps also come from using retail pump prices for all volumes versus using a blended pricing method that separates retail from bulk and bunker, and from treating re-exports and marine bunkering as local demand without sufficient checks from trade and port signals.
Benchmark comparison
| Source | Market Size | Gaps in Research Methodology |
|---|---|---|
| Mordor Intelligence | USD 26.77 B (2025) | |
| Industry Profile A | USD 41.80 B (2024) | Uses a broader oil and gas value pool and multiplies consumption by averaged retail prices for selected fuels, which can overstate value when bulk industrial, marine, and controlled-price volumes are priced like retail. |
| Regional Research Outlet B | USD 49.17 B (2026) | Likely applies a wider product and revenue definition and more aggressive price progression, and it is less transparent on how import, export, and bunkering flows are separated from true domestic consumption. |
The comparison shows that scope and pricing layer are the biggest swing factors in this market. When product boundaries are kept clean and value is linked to a defensible demand and trade balance, the estimate becomes easier to repeat and to stress-test during planning discussions.
Key Questions Answered in the Report
How big is the Malaysia refined petroleum products market in 2026?
The market is valued at USD 28.31 billion for 2026, continuing its 5.35% CAGR toward USD 36.74 billion in 2031.
Which product category is expanding fastest?
Aviation fuel is projected to post a 7.5% CAGR through 2031, outpacing all other refined products.
What share of supply comes from domestic refineries?
Domestic plants provided 66.3% of national demand in 2025 and are expected to edge higher as utilization improves.
How will the 2026 carbon tax affect refiners?
A levy of USD 5-10 per tonne of CO2 will squeeze margins unless refiners invest in capture technology or low-carbon fuels.
Which distribution channel is growing quickest?
Online and automated fuel delivery, led by Setel, is registering a 9.7% CAGR to 2031.
Where is the SAF biorefinery located?
The 650,000-tonne-per-year SAF and HVO facility is under construction at the Pengerang Integrated Complex in Johor.