
Market Overview
| Study Period | 2021 - 2031 |
|---|---|
| Forecast Data Period | 2026 - 2031 |
| Base Year Market Size (2025) | USD 231.90 Million |
| Market Size (2026) | USD 237 Million |
| Market Size (2031) | USD 264.25 Million |
| Growth Rate (2026 - 2031) | 2.20 % |
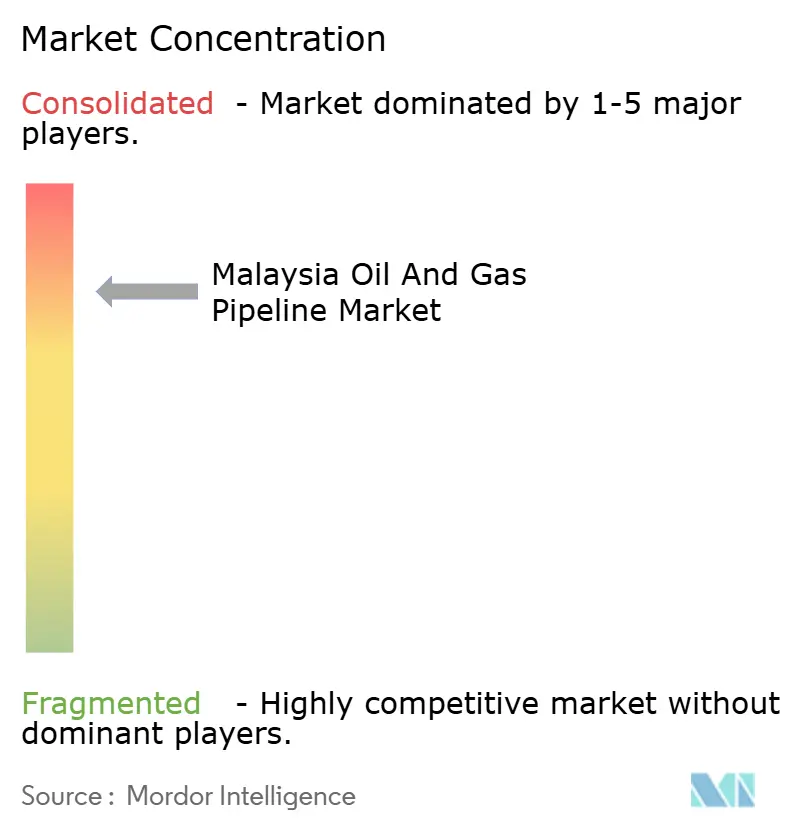
| Market Concentration | High |
Major Players *Disclaimer: Major Players sorted in no particular order Image © Mordor Intelligence. Reuse requires attribution under CC BY 4.0. | |
Malaysia Oil And Gas Pipeline Market Analysis by Mordor Intelligence
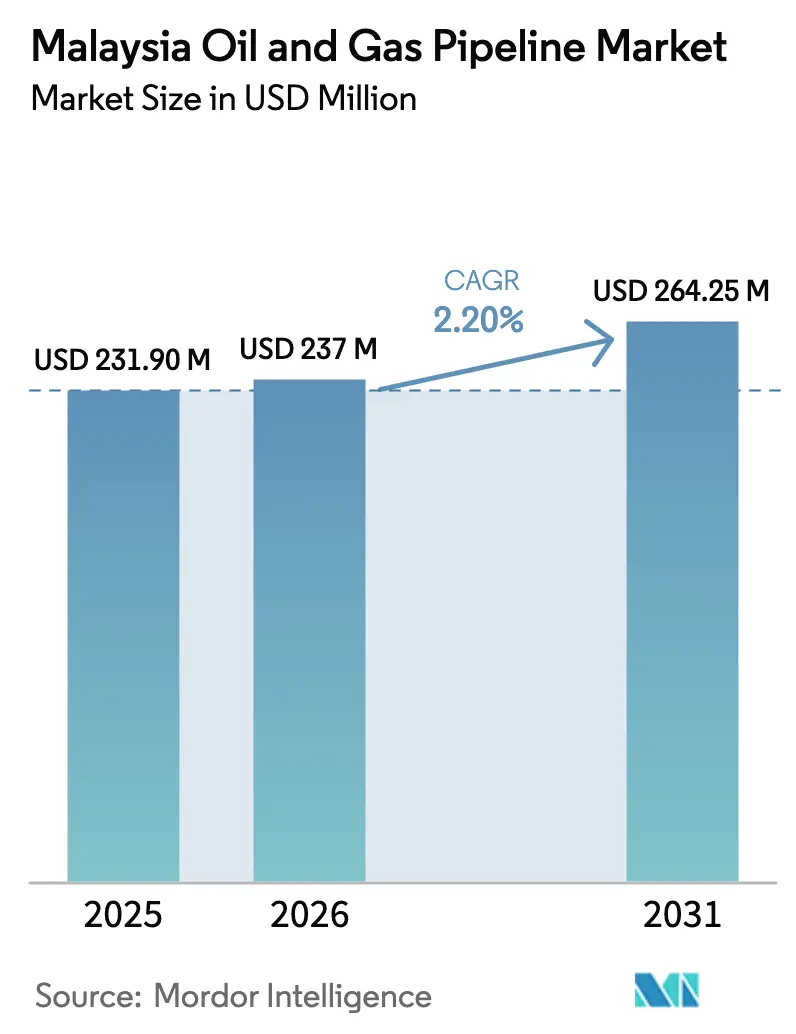
The Malaysia Oil And Gas Pipeline Market size was valued at USD 231.90 million in 2025 and estimated to grow from USD 237 million in 2026 to reach USD 264.25 million by 2031, at a CAGR of 2.2% during the forecast period (2026-2031).
The current expansion is underpinned by PETRONAS’s USD 27 billion RAPID integration, a national hydrogen roadmap that favors the repurposing of assets, and more than 1,130 km of planned new lines to meet the rising gas demand from power generation and petrochemical projects. CAPEX programs dominate spending, while offshore installations lead network length additions. Upstream field developments, such as Kasawari and the BIGST Cluster, continue to anchor new tie-back investments. Distribution build-outs funded by Gas Malaysia meet industrial demand spikes, particularly in areas around Johor and central Peninsular Malaysia. The market’s long-term outlook also reflects first-mover opportunities in carbon capture and storage (CCS) pipelines as operators decommission aging assets.
Key Report Takeaways
- By activity, CAPEX captured 63.55% of the Malaysia oil and gas pipeline market share in 2025 and is forecast to expand at a 4.07% CAGR through 2031.
- By function, transmission lines held 52.20% of the Malaysia oil and gas pipeline market size in 2025, while distribution lines recorded the fastest 4.85% CAGR to 2031.
- By location, offshore deployments commanded 57.50% revenue in 2025 and advanced at a 3.08% CAGR to 2031 on the back of marginal-field tie-backs and CCS conversions.
- By end-user sector, the upstream segment accounted for 54.90% of the Malaysia oil and gas pipeline market size in 2025 and is projected to post a 5.15% CAGR through 2031.
Note: Market size and forecast figures in this report are generated using Mordor Intelligence’s proprietary estimation framework, updated with the latest available data and insights as of 2026.
Malaysia Oil And Gas Pipeline Market Trends and Insights
Drivers Impact Analysis*
| Driver | (~) % Impact on CAGR Forecast | Geographic Relevance | Impact Timeline |
|---|---|---|---|
| Rising gas demand from power & petrochemical projects | +0.8% | Peninsular Malaysia, Sabah | Medium term (2-4 years) |
| PETRONAS RAPID downstream integration synergies | +0.6% | Johor (Pengerang), national spillover | Long term (≥ 4 years) |
| Offshore marginal-field tie-backs boosting subsea lines | +0.4% | Malaysian waters, Sabah-Sarawak | Medium term (2-4 years) |
| National hydrogen roadmap repurposing existing pipes | +0.3% | National, early gains in Peninsular Malaysia | Long term (≥ 4 years) |
| Aging on-shore pipe replacement programs (2025-30) | +0.2% | Peninsular Malaysia, Langkawi | Short term (≤ 2 years) |
| Decommissioning-to-CCS re-use opportunities | +0.2% | Offshore Malaysia, depleted fields | Long term (≥ 4 years) |
| Source: Mordor Intelligence | |||
Rising Gas Demand from Power Generation and Petrochemical Expansion
Gas consumption accelerates as PETRONAS’s third floating LNG unit at Sipitang adds 2 mtpa by H2 2027, driving new feed-gas lines to shore.[1] The USD 5.3 billion Pengerang Energy Complex in Johor will process 150,000 barrels per day of condensate, necessitating dedicated product and condensate pipelines by 2028. PETRONAS’s 16 MMscfd supply contract with Sabah Electricity, multiple Peninsular power PPAs, and first gas from the Jerun platform via an 80 km line collectively lift gas flows to Peninsula networks. EnQuest’s Seligi upgrade adds 70 MMscfd through existing corridors, underscoring the economic benefits of brownfield tie-backs. Each of these projects heightens throughput on both transmission and distribution systems, reinforcing sustained investment in the Malaysia oil and gas pipeline market.
PETRONAS RAPID Downstream Integration Creating Infrastructure Synergies
The RAPID complex’s 300,000 b/d refinery and integrated petrochemical trains rely on multi-product pipeline corridors that connect Pengerang with national demand centers and Singapore’s refining hub. RAPID enables shared line usage for fuels, feedstocks, and byproducts, thereby lowering unit transport costs and increasing pipeline asset utilization. Phased capacity additions align network expansions with product ramp-up schedules, smoothing CAPEX outflows. The complex also stimulates third-party terminal builds in Johor that require link-in spurs, creating secondary demand for pipe fabrication and installation. Over the long term, RAPID’s anchor volumes attract regional spot volumes, reinforcing Malaysia’s role as Southeast Asia’s transit interface and expanding the Malaysia oil and gas pipeline market.
Offshore Marginal Field Development Driving Subsea Pipeline Expansion
Malaysia’s marginal-field policy packages clustered reservoirs under single PSCs to improve project economics, prompting multi-well tie-backs that depend on longer, more advanced subsea lines. The BIGST Cluster, with 4 tcf of gas, requires a spiderweb of flowlines and trunklines extending into existing hubs more than 50 km away, thereby increasing demand for corrosion-resistant alloys and high-integrity welding. Tembakau and other small fields follow a similar template, proving the scaling advantages of shared pipelines. Service companies with deepwater lay spreads and autonomously operated vessels benefit from a backlog of at least 120 km of new subsea pipe every year through 2028. Continuous marginal-field licensing translates into a virtuous cycle of pipeline tie-back contracts, which buoy offshore revenues in the Malaysian oil and gas pipeline market.
National Hydrogen Roadmap Enabling Pipeline Repurposing Opportunities
Malaysia targets 2.5 million tonnes per year of green and blue hydrogen by 2050 and positions existing gas corridors as the backbone for early deployment. PETRONAS has launched blend-testing of up to 20% hydrogen in select Peninsular Malaysia lines, validating material compatibility and leak profiles. Repurposed assets lower project CAPEX by 50-70% compared with newbuild hydrogen lines, accelerating route-to-market for industrial clusters in Johor, Selangor, and Sarawak. Pilot “hydrogen corridors” will commence as bidirectional lines serving RAPID and Singapore by 2028, before a wider network roll-out. Successful pilots could unlock a new lifecycle revenue stream for owners, cementing the Malaysia oil and gas pipeline market as a transition platform rather than a stranded asset risk.
Restraints Impact Analysis*
| Restraint | (~) % Impact on CAGR Forecast | Geographic Relevance | Impact Timeline |
|---|---|---|---|
| Prolonged fiscal approval cycles for new trunklines | -0.3% | National, federal project approvals | Short term (≤ 2 years) |
| Low regulated gas-transmission tariffs | -0.2% | Peninsular Malaysia transmission network | Medium term (2-4 years) |
| Heightened ESG scrutiny on new oil pipelines | -0.2% | National, international project financing | Medium term (2-4 years) |
| Skilled-labour shortages for deep-water welding | -0.1% | Offshore Malaysia, deepwater installations | Short term (≤ 2 years) |
| Source: Mordor Intelligence | |||
Prolonged Fiscal Approval Cycles Constraining Project Timelines
Multiple agency reviews can extend environmental studies to 24 months and increase trunkline approvals by an additional 18-30 months when state and federal requirements diverge.[2] Land acquisition hurdles in populated corridors increase compensation costs and lead to legal disputes that can halt work indefinitely. The April 2025 Putra Heights explosion triggered stricter safety protocols, adding fresh layers of technical vetting and documentation. These cumulative delays elevate financing carry costs and erode the net present value of projects, dampening developer appetite in the Malaysia oil and gas pipeline industry.
Low Regulated Gas Transmission Tariffs Pressuring Operator Margins
Malaysia’s tariff setting, designed to preserve downstream competitiveness, leaves operators with returns that barely cover upkeep on aging steel assets. Cost-plus models overlook deepwater material premiums and inflation, leaving smaller midstream operators vulnerable to capital shortages. Third-party access mandates have further compressed rents by obliging pipeline owners to grant capacity at regulated rates that fail to reflect true replacement costs. Tariff revisions occur infrequently, creating forecasting uncertainty that deters lenders from underwriting new build projects, a drag on overall Malaysia oil and gas pipeline market growth.[3]
*Our forecasts treat driver/restraint impacts as directional, not additive. The impact forecasts reflect baseline growth, mix effects, and variable interactions.
Segment Analysis
By Activity: CAPEX Investments Drive Infrastructure Expansion
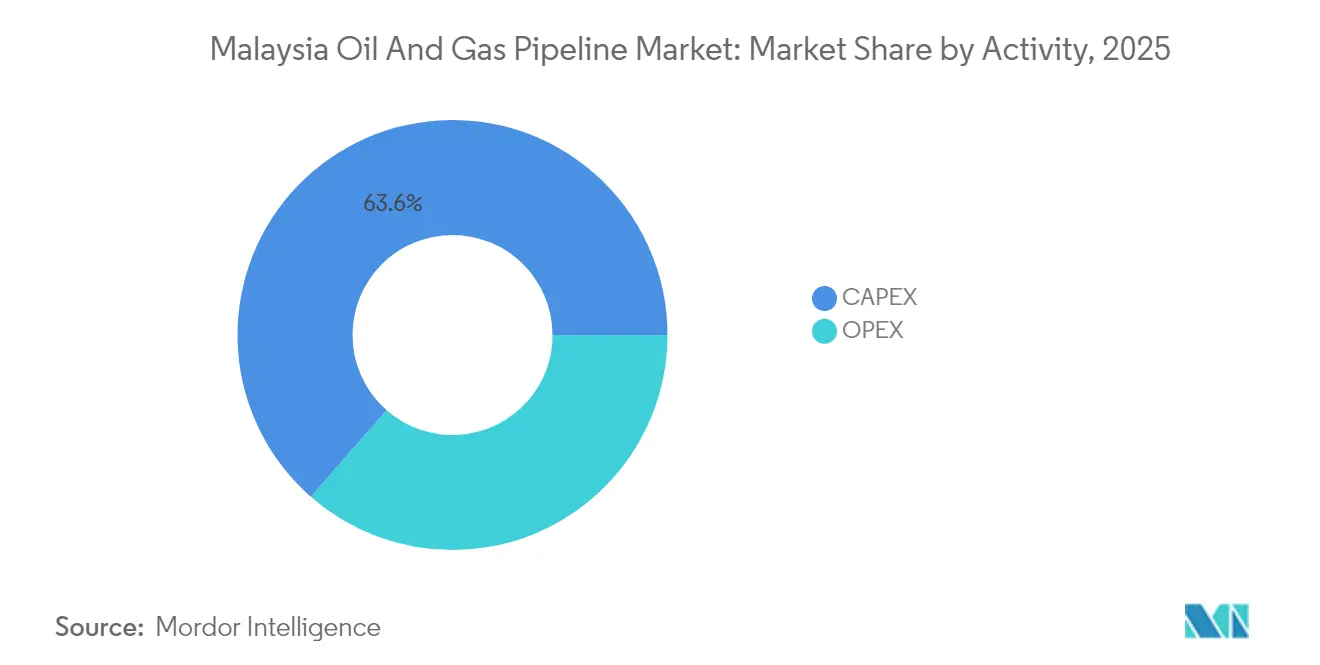
CAPEX spending accounted for 63.55% of the Malaysian oil and gas pipeline market share in 2025 and is projected to grow at a 4.07% CAGR, nearly twice the overall rate. Large-ticket items, such as the RM1 billion Langkawi submarine replacement and the 1,130 km newbuild program through 2026, dominate order books. Suppliers of high-strength line pipe, automated welding systems, and corrosion inhibitors secure recurring contracts as PETRONAS front-loads material procurement to hedge cost escalation. Local content rules direct fabrication to Malaysian yards, creating multiplier effects on jobs and ancillary services.
OPEX forms a stable annuity stream anchored to the integrity management of the 2,551 km Peninsula Gas Utilisation (PGU) grid. Inline inspection runs, cathodic-protection upgrades, and leak-detection sensor installs account for the bulk of the spend. Decommissioning, although nascent, is gaining traction as operators plan for the reuse of retired lines, ensuring long-term OPEX relevance. Digital twins and machine-learning analytics are increasingly shaping maintenance schedules, reducing unplanned outages and extending asset life —a trend that mitigates volatility in the Malaysian oil and gas pipeline market.

By Function: Transmission Infrastructure Dominance with Distribution Growth
Transmission networks accounted for 52.20% of the Malaysia oil and gas pipeline market size in 2025, anchored by the PGU’s 3,000 MMscfd capacity. The Sabah-Sarawak Gas Pipeline remains pivotal for East Malaysia, although select segments require reactivation or hydrogen retrofit studies. New field tie-backs, such as Jerun, inject incremental volumes that sustain throughput and justify loop expansions.
Distribution pipelines, growing at a 4.85% CAGR, respond to expanding industrial loads in Johor and Selangor. Gas Malaysia’s RM 1.2-1.4 billion five-year budget funds 800 km of distribution lines, unlocking last-mile connectivity to SMEs and large petrochemical off-takers. Gathering systems follow the upstream drilling pace, especially across marginal clusters where multi-well satellite systems feed shared processing hubs, ensuring balanced growth across the Malaysian oil and gas pipeline market.
By Location: Offshore Deployments Lead Market Activity
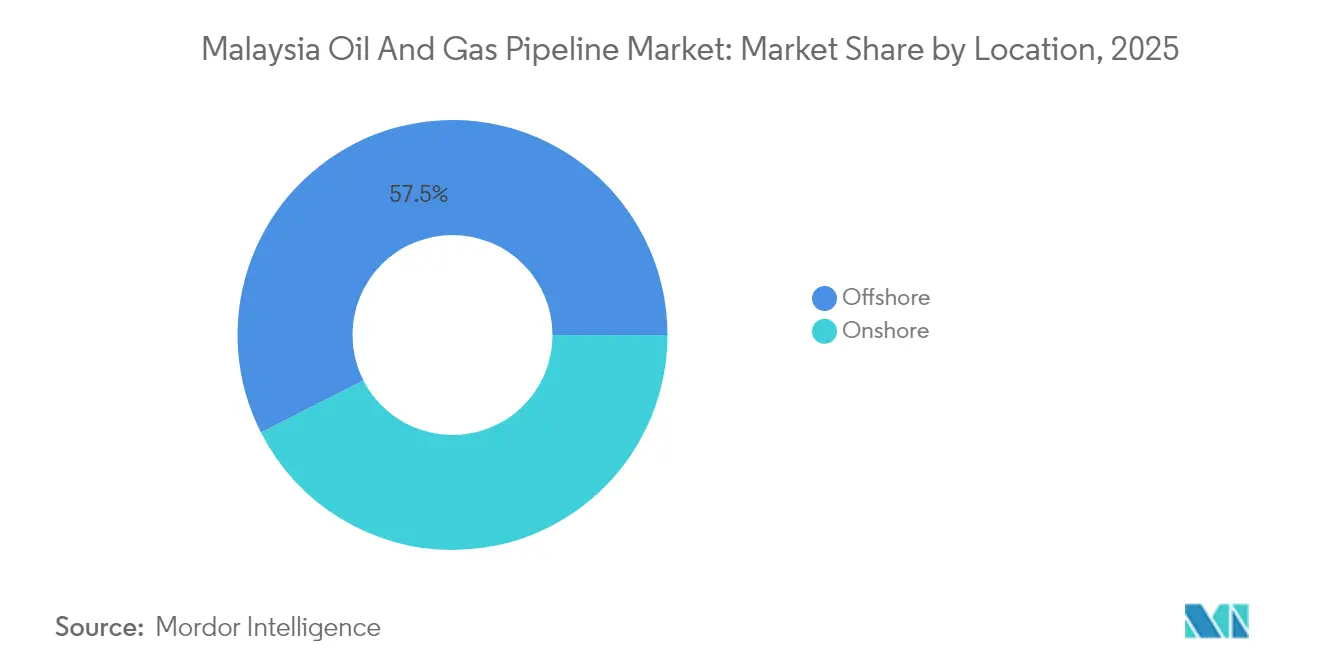
Offshore assets delivered 57.50% of 2025 revenue and are forecast to climb at a 3.08% CAGR as deepwater and CCS needs rise. The Kasawari and BIGST developments alone require more than 250 km of 20-42 inch pipe in water depths exceeding 100 meters. Specialized remotely operated vehicles (ROVs) and hybrid lay vessels enjoy full calendars through 2029.
Onshore projects, while facing slower approval cycles, focus on redundancy and safety upgrades. The Putra Heights blast prompted accelerated replacements of high-risk segments, injecting short-term boosts to construction demand. Hydrogen trial corridors on the PGU may shift future onshore spend toward conversion fittings and odorant systems, diversifying revenue streams in the Malaysia oil and gas pipeline market.
By End-User: Upstream Sector Drives Infrastructure Investment
Upstream operators represented 54.90% of the 2025 spend and are on track for a 5.15% CAGR as PETRONAS and its partners monetize over 4 tcf of newly awarded reserves. High-pressure lines with CRA cladding connect wellheads to FPUs and onshore terminals. EnQuest’s Seligi expansion illustrates the incremental volumes that justify pipeline looping and debottlenecking.
Midstream players, such as Gas Malaysia, concentrate on regulated transport and storage, capturing predictable tariffs albeit at compressed margins. Downstream complexes, such as RAPID and the Pengerang Energy Complex, require segregated product lines—diesel, naphtha, and ethylene feed—creating niche EPC opportunities. These layered end-user patterns enrich the outlook for the Malaysian oil and gas pipeline industry.
Geography Analysis
Peninsular Malaysia hosts the bulk of installed mileage via the PGU’s 2,551 km backbone and absorbs the lion’s share of new distribution spending, accounting for more than half of all current project tenders. Johor emerges as a strategic nexus where RAPID and the Pengerang Energy Complex initiate multi-product corridors that potentially extend into Singapore. Central states such as Selangor benefit from feeder loops that supply gas-fired capacity additions announced for 2026-2029.
Sabah and Sarawak’s offshore gas fields drive subsea trunklines that landfall into onshore LNG export terminals and future hydrogen hubs. Sarawak’s gas reallocation plan, which mandates 30% domestic use by 2030, accelerates the development of new intra-state connections and positions PETROS as the linchpin aggregator. Sabah’s Sipitang FLNG adds further pipeline demand as feed-gas lines interlink pockets of offshore reserves.
Malaysia’s economic exclusive zone sees the most dynamic build-out as marginal fields cluster around legacy hubs, leveraging shared pipelines to reduce unit transportation costs. Planned CCS pilots, notably the M3 project’s 137 km CO₂ line, underscore how offshore corridors will gradually shift from hydrocarbon to decarbonization roles, reinforcing the strategic value of the Malaysia oil and gas pipeline market beyond 2030.
Regulatory Landscape
Malaysia regulates gas pipeline licensing, safety, and access primarily under the Gas Supply Act 1993 (Act 501), with the Energy Commission (Suruhanjaya Tenaga) administering the Third Party Access (TPA) framework for gas transportation, distribution, and regasification facilities. The tariff regime for transportation licensees follows Incentive-Based Regulation (IBR), supported by the 2024 revision of the Guidelines on Determination of Transportation Facility Tariff under IBR, which determines allowed returns and cost recovery for regulated pipeline assets.
In East Malaysia, Sabah operates a separate state framework via the Energy Commission of Sabah (ECoS) under the Gas Supply Enactment 2023 and related regulation guidelines, creating a dual-regulator environment across Malaysia. At the policy level, the National Energy Policy 2022-2040 sets the direction for energy security and transition priorities, which influences midstream investment decisions, especially where new capacity (such as LNG regasification connections and integrity upgrades) must align with regulated access and safety requirements.
Competitive Landscape
PETRONAS anchors the value chain as national champion, but international EPC giants—TechnipFMC, Saipem, and McDermott—compete vigorously for deepwater and RAPID-related packages. Local firms Dialog Group and Sapura Energy capture fabrication scopes supported by local-content mandates and proximity to yards. Technology adoption differentiates bidders: digital twin rollouts, hydrogen-compatible coatings, and autonomous inspection drones are increasingly influencing award decisions.
Sapura Energy’s restructuring sparks acquisition interest in its subsea welding division, while Dialog’s Johor terminal expansion secures long-term throughput contracts with petrochemical tenants. Decommissioning and CCS retrofits are forming emerging niches where early movers are building reservoirs of specialized knowledge. Regulation favors players with ISO-rated safety systems, raising entry barriers for newcomers and maintaining a moderate concentration in the Malaysian oil and gas pipeline market.
Skilled labor shortages for deepwater welders continue to be a bottleneck, granting premium pricing power to qualified service providers. Government talent-acceleration grants may alleviate gaps by 2027, but near-term tightness persists, sustaining elevated contractor margins on subsea spreads. Collectively, these trends maintain a balanced competitive intensity even as the project pipeline expands.
Malaysia Oil And Gas Pipeline Industry Leaders
-
Sapura Energy Berhad
-
Dialog Group Berhad
-
PETRONAS Gas Berhad
-
Gas Malaysia Berhad
-
TechnipFMC plc
- *Disclaimer: Major Players sorted in no particular order
Market Opportunities and Future Outlook
Near-term opportunity concentrates on new connectivity and debottlenecking that links import and terminal infrastructure into existing transmission corridors, supported by the 2026 move to develop a third LNG regasification terminal (RGT-3) in Lumut, Perak, using an FSRU concept. That shift creates demand for tie-in pipelines, metering, and integrity systems that plug into the Peninsular Gas Utilisation network while operating under the Third Party Access and IBR tariff framework.
Johor-focused industrial and downstream expansion is also expected to translate into incremental terminal-to-plant spurs and multi-product corridor work. Dialog Group Berhad started Phase 3 expansion at Pengerang Deepwater Terminals in 2026 after progress tied to a long-term storage agreement with BP Singapore Pte Limited. It is also building 272,000 cbm of biofuel storage for Pengerang Biorefinery, with a stated completion target of December 2027, which raises the need for dedicated transfer lines and midstream integration. Offshore pipeline construction capacity continues to be a monetizable niche as PETRONAS Carigali work orders awarded to Vantris Energy for Belud South Greenfield and Sepat Integrated Redevelopment support transportation and installation activity for new and brownfield tie-backs.
Recent Industry Developments
- June 2026: PETRONAS Gas Berhad signed a heads of agreement with Tenaga Nasional Berhad to jointly develop the RGT-3 project via a special purpose vehicle. The agreement advances the RGT-3 regasification terminal and marks Malaysia's first FSRU deployment. The arrangement enables 500 MMscfd capacity to support about 3.5 GW of power generation and strengthens LNG and fuel asset integration into Peninsular Malaysia.
- May 2026: PETRONAS Gas Berhad awarded a 20-year contract to MISC Berhad for the supply, operation and maintenance of the RGT-3 FSRU. The contract expands long-term LNG regasification capacity. It secures ongoing FSRU servicing and reliability for RGT-3 and anchors gas import infrastructure investment.
- April 2026: PETRONAS Gas Berhad was notified by the Ministry of Economy to develop the third regasification terminal, RGT-3, in Lumut, Perak as an FSRU based concept. The notice signals regasification capacity expansion via FSRU deployment. It catalyzes downstream gas supply to Peninsular Malaysia and supports RAPID hydrogen and CCS transition readiness.
Research Methodology Framework and Report Scope
Market Definition and Coverage
For this study, the market is defined as the value of pipeline related spending in Malaysia for oil and gas pipeline networks, including new build work and ongoing operations and maintenance across onshore and offshore assets.
Scope exclusions: We exclude non pipeline midstream assets such as LNG terminals, general tank storage, and marine shipping infrastructure unless it is directly part of a pipeline system.
Segmentation Overview
- By Activity
- CAPEX
- Pipeline Materials and Equipment
- Pipeline Fabrication and Construction
- OPEX
- Inspection
- MRO
- Decommissioning
- CAPEX
- By Function
- Gathering Lines
- Transmission Lines
- Distribution Lines
- By Location of Deployment
- Onshore
- Offshore
- By End-user Sector
- Upstream (EnP)
- Midstream Operators
- Downstream and Petrochemicals
Data Sources, Market Sizing, and Validation
Desk Research
Desk research starts with building a factual view of Malaysia pipeline activity and the drivers that typically change annual spending. Public sources are used to track indicators such as upstream project flow, gas demand, and national energy policy direction, which then informs the demand pull for transmission and distribution links.
We typically rely on official and non paywalled sources such as Department of Statistics Malaysia releases, Energy Commission publications, Bank Negara Malaysia macro series (inflation and exchange rates), International Energy Agency energy balances, and World Bank development indicators. Where relevant, we also use port and customs trade summaries. Company annual reports, investor presentations, contract award notices, and credible industry news are then used to time projects, check commissioning dates, and confirm whether spend sits in CAPEX or OPEX. In addition, we use paid subscriptions for company financials and intelligence, import and export shipment level checks, and tender databases where they help validate the presence and timing of awards. These desk sources are illustrative, and additional references were also used for data collection, validation, and clarification.
Primary Interviews and Surveys
Primary work is used to pressure test what desk signals imply, especially when project timelines shift and cost inflation moves quickly. We speak with a mix of pipeline operators, EPC and integrity focused contractors, and component suppliers. We then recheck assumptions with downstream and midstream linked stakeholders who see utilization changes, since operating profiles can differ from plan when commissioning slips.
For this country market, input is centered on Malaysia, with perspectives balanced across offshore tie ins and onshore transmission and distribution activity.
Distribution of primary research fieldwork respondents
| Company type | Respondent position |
|---|---|
| Top tier: 34% | CXOs: 16% |
| Mid tier: 45% | Functional/Unit leaders: 38% |
| Smaller Players: 21% | Managers: 46% |
Market-Sizing & Forecasting
Sizing is built using a top-down and bottom-up approach. We reconstruct national level pipeline investment and operating spend signals first, then cross check with selective roll ups to keep totals realistic. On the top-down side, we map expected CAPEX and OPEX by pipeline function and location by aligning project start dates, known integrity cycles, and likely utilization changes.
Key inputs used in the model include announced pipeline and tie in project timelines, expected integrity and replacement cycles, offshore development activity that drives gathering and transmission links, indicators for gas consumption and industrial demand, and cost inflation and foreign exchange movements that influence USD reported values. Where interview feedback indicates a different work mix, for example more brownfield integrity work than new builds in a given year, we adjust the CAPEX and OPEX split and recheck it against available contract signals.
For forecasting, we mainly use scenario analysis because annual values can swing based on project slippage, permitting, and offshore schedule resets. The final path is selected after validating assumptions on cost escalation and work mix with primary respondents, and then converting to USD using consistent timing rules so year to year comparisons stay clean.
Data Validation & Update Cycle
Validation is done through multiple checks so the model does not rely on a single data series. We compare outputs against independent signals such as project award timing, reported spending cues in public filings, and macro indicators that typically move pipeline service costs, and then we investigate large variances before sign off.
When gaps appear in bottom-up cross checks, they are handled through conservative ranges that are narrowed using interview feedback. The final number is taken only after it matches the practical delivery capacity implied by the project calendar. The report is refreshed annually, with interim updates triggered by material events such as major awards, delays, or policy shifts. A fresh review pass is completed right before delivery so clients receive the latest updated view.
Mordor Intelligence's Malaysia Oil and Gas Pipeline Market Size Versus Other Published Estimates
Published market values for Malaysia pipelines can look quite different because the boundary of what gets counted is not always the same, and because some estimates mix multi year project totals into a single year. Differences also show up when sources convert local costs into USD using different exchange rate timing, which can shift the value even when physical activity is unchanged.
A practical gap driver is whether the number represents only pipeline construction or if it also includes integrity services, leak detection, and routine operations work that occurs every year. Another common gap is pricing logic, since some publishers apply a flat average cost per kilometer, while others use a more detailed split between offshore tie ins, onshore transmission, and distribution networks, which have different cost structures. Because FX and cost inflation are rechecked close to publication and applied consistently to the year being reported, the refresh cadence and currency timing used in the model can narrow avoidable swings. That is also why the 2025 figure aligns the way it does in Mordor Intelligence.
Benchmark comparison
| Source | Market Size | Gaps in Research Methodology |
|---|---|---|
| Mordor Intelligence | USD 231.90 M (2025) | |
| Industry Portal A | USD 200.00 M (2025) | Often leans toward new pipeline build and major EPC work only, which can undercount recurring OPEX led integrity and maintenance spending that remains active even in slower build years. |
| Regional Consultancy B | USD 285.00 M (2025) | Tends to use higher unit cost assumptions and may include adjacent midstream assets and multi year offshore project budgets captured in a single year, which can inflate the annual pipeline value. |
The table shows that the spread mostly comes from what activities are included and how annualization is handled for multi year projects. When scope is kept specific to pipeline networks and the yearly CAPEX versus OPEX mix is adjusted using current cost and FX checks, the final value becomes easier to trace back to clear drivers and repeatable steps.
Key Questions Answered in the Report
What is the 2026 value of the Malaysia oil and gas pipeline market?
The market is valued at USD 237 million in 2026.
How fast is CAPEX spending growing?
CAPEX activity is projected to rise at a 4.07% CAGR through 2031.
Which segment grows the quickest by function?
Distribution pipelines expand at a 4.85% CAGR between 2026 and 2031.
What drives offshore pipeline demand?
Marginal-field tie-backs and emerging CCS projects underpin offshore growth.
How large is the planned pipeline build through 2026?
More than 1,130 km of new pipelines are scheduled for installation.
What score reflects market concentration?
The market earns a concentration score of 6, signaling moderate dominance by top players.