
Market Overview
| Study Period | 2020 - 2031 |
|---|---|
| Forecast Data Period | 2026 - 2031 |
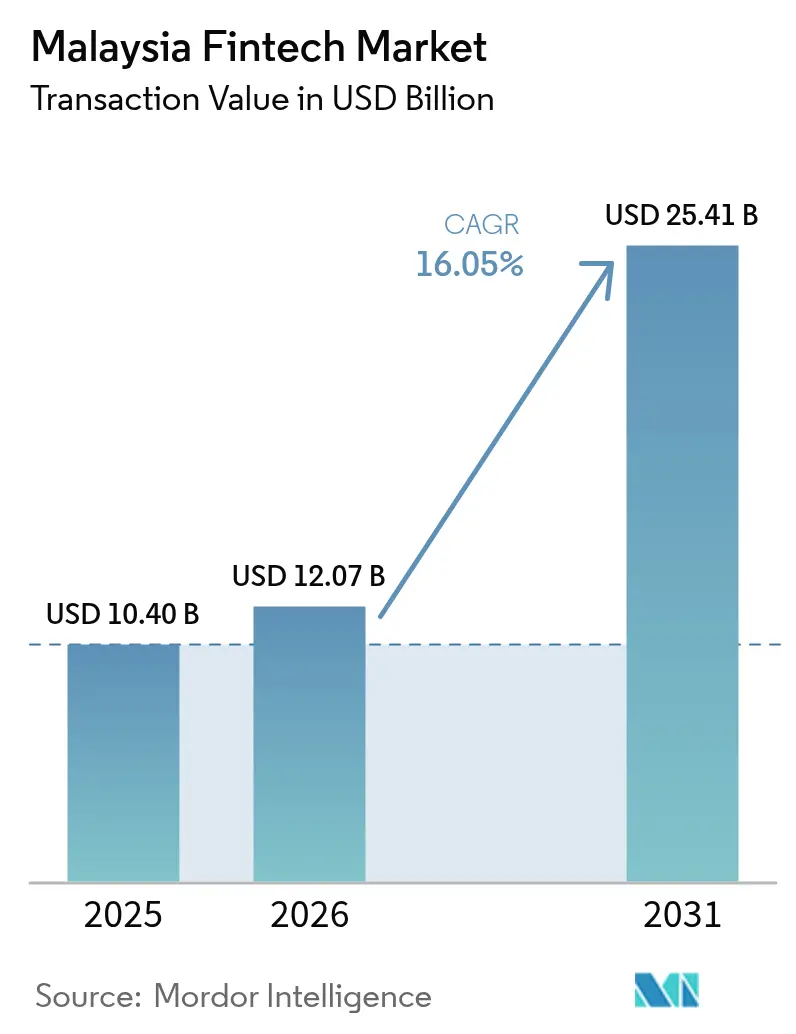
| Base Year Market Size (2025) | USD 10.40 Billion |
| Market Size (2026) | USD 12.07 Billion |
| Market Size (2031) | USD 25.41 Billion |
| Growth Rate (2026 - 2031) | 16.05% CAGR |
| Market Concentration | Medium |
Major Players *Disclaimer: Major Players sorted in no particular order Image © Mordor Intelligence. Reuse requires attribution under CC BY 4.0. | |
Malaysia Fintech Market Analysis by Mordor Intelligence
The Malaysia fintech market size was valued at USD 10.40 billion in 2025 and estimated to grow from USD 12.07 billion in 2026 to reach USD 25.41 billion by 2031, at a CAGR of 16.05% during the forecast period (2026-2031). Malaysia’s role as Southeast Asia’s Islamic finance hub, combined with an expanding digital‐first consumer base and supportive sandbox regulations, underpins this growth. Continued licensing of digital banks, such as KAF Digital Bank and AEON Bank, has broadened service offerings while lowering acquisition costs[1]Bank Negara Malaysia, “Digital Banking Licenses,” BNM.gov.my. . Cross-border QR payment links with Cambodia and Singapore elevate transaction volumes and position local providers for regional expansion. Public cloud and data-center investments across Sarawak and Penang strengthen the underlying infrastructure, enabling real-time payments and compliance analytics. As the Malaysia fintech market matures, competitive strategies increasingly revolve around super-app ecosystems, Islamic-compliant innovations, and embedded finance integrations into retail and SME workflows.
Key Report Takeaways
- By service proposition, digital payments captured 50.72% of the Malaysia fintech market share in 2025, while neobanking is projected to expand fastest at a CAGR of 26.12% during 2026-2031.
- By end-user, the retail segment accounted for 64.78% of the Malaysia fintech market share in 2025, with business users expected to post the highest CAGR of 22.55% over 2026-2031.
- By user interface, mobile apps comprised 56.10% of the Malaysia fintech market share in 2025, while POS/IoT devices are forecast to grow at a 24.6% CAGR through 2031.
- By geography, King Valley comprised 47.10% of the Malaysia fintech market share in 2025, while East Malaysia is forecast to grow at a 23.7% CAGR through 2031.
Note: Market size and forecast figures in this report are generated using Mordor Intelligence’s proprietary estimation framework, updated with the latest available data and insights as of 2026.
Malaysia Fintech Market Trends and Insights
Drivers Impact Analysis*
| Driver | (~) % Impact on CAGR Forecast | Geographic Relevance | Impact Timeline |
|---|---|---|---|
| High smartphone & internet penetration | +2.8% | National, with urban concentration in Klang Valley | Short term (≤ 2 years) |
| Government's MyDigital & FSB initiatives | +3.2% | National, with pilot programs in northern states | Medium term (2-4 years) |
| E-commerce boom | +2.1% | National, with Klang Valley and Southern Region leadership | Short term (≤ 2 years) |
| Favourable sandbox & digital bank licences | +2.4% | National, with regulatory oversight from Kuala Lumpur | Medium term (2-4 years) |
| Rising demand for Islamic fintech | +1.8% | National, with stronger adoption in East Coast | Long term (≥ 4 years) |
| ASEAN cross-border QR-code integration | +1.6% | Border regions, tourism corridors, and business hubs | Medium term (2-4 years) |
| Source: Mordor Intelligence | |||
High Smartphone & Internet Penetration Drives Addressable Market Expansion
Malaysia’s smartphone penetration surpasses 85% and internet connectivity reaches 90% of residents, growing the digital-ready customer pool for fintech services[2]The Edge Malaysia, “MDEC Intensifies Push for 25.5% Digital Economy Contribution,” Theedgemalaysia.com. . Touch ’n Go Digital expects its first full-year profitability in 2025 after securing USD 75 million from strategic investors, a milestone enabled by this mobile reach. E-wallet usage already touches 40%, outpacing traditional banking access. Google Pay’s 2024 tie-up with ShopeePay and TNG eWallet illustrates how infrastructure maturity accelerates ecosystem partnerships that deepen wallet stickiness. Younger cohorts dominate adoption, with 90% of users aged 40 and below forming the core target for upcoming product launches.
Government MyDigital & Financial Sector Blueprint Initiatives Catalyze Ecosystem Development
The MyDigital roadmap aims for the digital economy to contribute 25.5% of GDP by end-2025, supported by MYR 163.6 billion (USD 34.36 billion) in approved digital investments in 2024, a 250% jump year-on-year[3]The Edge Malaysia, “RM16.2b in Investments Bagged Under Malaysia Digital,” Theedgemalaysia.com. . More than 3,891 Malaysia Digital-status firms now operate nationwide, buoyed by tax incentives granting 0% on IP income for a decade. The Financial Sector Blueprint’s 75% cashless-transaction goal releases subsidies for payment terminals and data-protection upgrades. Regional expansion is evident as the Digital Ministry opened its northern office in Penang to funnel incentives and technical mentorship beyond Klang Valley.
E-commerce Boom Amplifies Payment Volume Growth
Malaysia's e-commerce sector demonstrates exceptional momentum, with Shopee Malaysia reporting 8x sales growth during the 10.10 festival and 170% growth during Raya celebrations in 2024. This e-commerce expansion directly feeds payment volume for fintech rails, as digital transactions become the preferred settlement method for online retail. The sector's gross merchandise value CAGR exceeding 18% creates a multiplier effect for payment processors, particularly benefiting e-wallet providers and digital payment facilitators. Cross-platform integration between e-commerce and fintech services, exemplified by Shopee's partnership with Takaful IKHLAS for Shariah-compliant motor insurance, demonstrates how payment volume growth extends into adjacent financial services. The e-commerce boom also drives demand for embedded finance solutions, as merchants seek integrated payment, lending, and insurance products to enhance customer experience and increase transaction values.
Favourable Sandbox & Digital Bank Licences Lower Entry Barriers
Bank Negara Malaysia's progressive regulatory approach granted digital banking licenses to 5 institutions, including Malaysia's first Islamic digital bank, AEON Bank, fundamentally altering the competitive landscape. The Securities Commission Malaysia's regulatory sandbox, opening applications in April 2025, provides a controlled environment for fintech innovation testing under tailored regulatory requirements. This regulatory liberalization enables challenger banks to compete directly with incumbents, as evidenced by Boost Bank's rapid deposit accumulation of MYR 700 million (USD 147 million) within 6 months of launch. Digital banks benefit from lower operational costs and agile technology stacks, creating pricing advantages that pressure traditional institutions to accelerate their own digital transformation. The sandbox framework particularly benefits Islamic fintech innovations, with Securities Commission Malaysia's dedicated Islamic Capital Market Department supporting Shariah-compliant product development and market entry.
Restraints Impact Analysis*
| Restraint | (~) % Impact on CAGR Forecast | Geographic Relevance | Impact Timeline |
|---|---|---|---|
| Cyber-fraud concerns | −1.9% | Urban centers nationwide | Short term (≤ 2 years) |
| Reliance on incumbent banking rails | −1.4% | Nationwide legacy dependencies | Medium term (2-4 years) |
| Shortage of deep-tech fintech talent | -2.7% | National, with severe gaps in Tier-2 cities and East Malaysia | Medium to long term (2-5 years) |
| Regional digital tax complexity | -2.1% | National, with disproportionate effects on cross-border and SME fintech operations | Medium term (2-4 years) |
| Source: Mordor Intelligence | |||
Cyber-fraud Concerns Erode User Trust and Increase Compliance Costs
Rising cybersecurity threats and digital fraud incidents create significant headwinds for fintech adoption, with compliance costs increasing 25% year-on-year across the industry. Bank Negara Malaysia and Bank of Thailand signed a memorandum of understanding in April 2025 for cybersecurity and digital fraud cooperation, highlighting the cross-border nature of these threats. Malaysian banks responded by adding malware shielding to mobile applications, while BNM's National Fraud Portal launch reduced fraud tracing time by 75%, demonstrating both the severity of the problem and institutional responses. GXBank's introduction of Cyber Fraud Protect insurance products reflects how fintech companies are monetizing security concerns while addressing customer risk aversion.
Reliance on Incumbent Banking Rails Limits Fintech Uptime Guarantees
Malaysia's fintech ecosystem remains dependent on legacy banking infrastructure for core settlement and clearing functions, creating systemic vulnerabilities that limit service reliability guarantees. When incumbent bank systems experience downtime, fintech applications lose functionality despite having modern user interfaces and robust mobile platforms. This dependency becomes particularly problematic during high-volume periods or system maintenance windows, when fintech companies cannot provide the always-on service expectations of digital-native customers. CelcomDigi and PayNet's partnership to strengthen DuitNow payment security through SIM-based authentication represents efforts to enhance reliability, yet the fundamental infrastructure bottleneck persists.
*Our forecasts treat driver/restraint impacts as directional, not additive. The impact forecasts reflect baseline growth, mix effects, and variable interactions.
Segment Analysis
By Service Proposition: Digital Payments Sustain Lead While Neobanking Accelerates
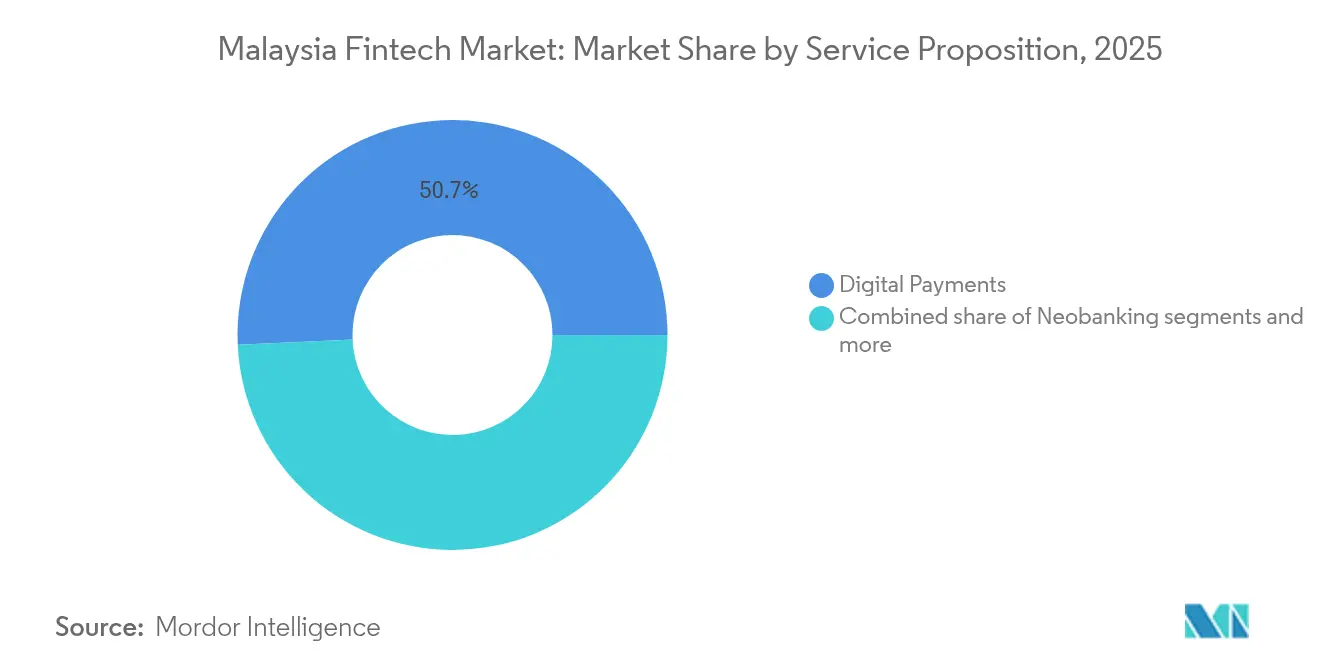
Digital payments captured 50.72% of Malaysia fintech market share in 2025, anchored by Touch ’n Go Digital’s multi-modal transport and retail integrations. Government cashless incentives and regional QR interoperability continue to widen this moat. Digital lending ranks second at 21.03%, boosted by Funding Societies’ USD 27 million raise that broadened Shariah-compliant SME lines. Insurtech holds 15.05%, validated by PolicyStreet’s USD 15.4 million Series B and a 5 million-strong user base.
Neobanking, though only 7.35% in 2025, is projected to grow at a 26.12% CAGR, narrowing gaps with incumbents through fee-free accounts and rapid onboarding. Digital investments stand at 5.85%, where StashAway’s launch of Bitcoin and Ethereum ETFs alongside Shariah portfolios diversifies revenue. The Securities Commission’s Digital Innovation Fund has co-financed 15 pilots, signalling future service-mix shifts.


By End-User: Retail Dominance Meets Business Upswing
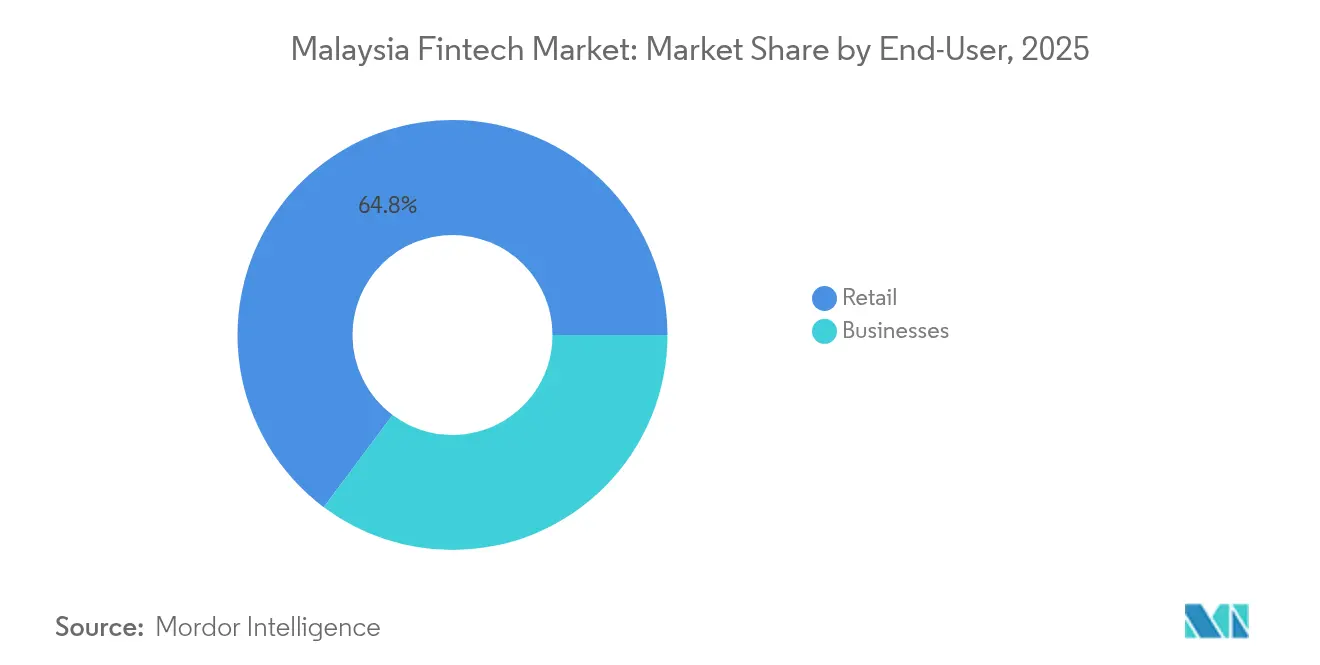
Retail users accounted for 64.78% of the Malaysia fintech market in 2025, supported by a youthful demographic and high mobile penetration. Versa’s 270,000 users—59% under 30—mirror this skew. Islamic-compliant savings tools and micro-insurance maintain momentum among mass-market consumers.
Business users, currently 35.22%, are the fastest riser at 22.55% CAGR to 2031. Boost Bank and CGC Digital’s MYR 130 million (USD 27.30 million) facility illustrates demand for alternative credit among MSMEs. The MYR 1.5 billion (USD 315 million) Business Digitalisation Initiative supplies subsidies and technical training, further catalysing SME uptake of payroll, invoicing, and supply-chain finance modules.
By User Interface: Mobile Apps Dominate, POS/IoT Devices Gain Traction
Mobile channels command 56.10% of interactions, underscoring Malaysia’s mobile-first financial habits. Grab, MAE, and TNG integrate ride-hailing, transfers, and micro-investments to amplify session frequency. Browser interfaces cover 28.45%, catering to corporate dashboards and wealth-management tasks requiring multi-screen analysis.
POS and IoT endpoints, though only 10.95% now, are forecast to grow 24.6% CAGR, propelled by Soft Space’s tap-to-phone rollout and GHL Systems’ merchant acquirer upgrades. Smart city pilots and Industry 4.0 incentives further embed payments into connected devices, paving the way for frictionless checkout experiences.
Geography Analysis
Klang Valley captured 47.10% of Malaysia fintech market share in 2025, reflecting its dense network of regulators, venture investors, and tech talent. Headquarters of Touch ’n Go Digital, PolicyStreet, and Jirnexu cluster here, creating virtuous knowledge spillovers and rapid prototyping cycles. Superior fiber and 5G coverage underpin real-time KYC and analytics workloads.
The Southern Region accounts for a significant share is projected to grow at a higher CAGR, buoyed by the Johor–Singapore Special Economic Zone that channels cross-border flows via PayNow-DuitNow rails. Data-center proposals in Iskandar position the region for disaster recovery and latency-sensitive fintech workloads.
East Malaysia represents the fastest-growing geography at 23.7% CAGR through 2031, as Sarawak Digital Corporation's initiatives and substantial data center investments create digital infrastructure foundations for fintech expansion. The region's growth reflects government efforts to distribute digital economy benefits beyond Peninsular Malaysia, with targeted investments in connectivity and digital skills development addressing historical infrastructure gaps.
The Northern Region carries a 21.08% share, leveraged by manufacturing supply chains in Penang that need trade-finance and cross-border remittance solutions. Penang’s MYR 1.23 billion (USD 258.3 million) in Malaysia Digital investment approvals and the opening of an MDEC office concentrate support services and talent. East Coast, at 9.32%, leverages cultural affinity for Islamic finance to pilot new Shariah-compliant wallets and takaful offerings targeting domestic tourism corridors.
Regulatory Landscape
Malaysia regulates fintech through a multi-regulator, activity-based model led by Bank Negara Malaysia (BNM) for banking and payment systems and the Securities Commission Malaysia (SC) for capital markets. The framework is anchored by the Financial Services Act 2013, Islamic Financial Services Act 2013, and Capital Markets and Services Act 2007. BNM revised its Financial Technology Regulatory Sandbox Framework in February 2024, introducing a Standard Sandbox alongside an Innovation Green Lane to create clearer testing pathways. SC continues to operate its capital-market-focused sandbox under section 377 of the CMSA.
Digital asset oversight sits primarily with SC, including the Capital Markets and Services (Prescription of Securities) (Digital Currency and Digital Token) Order 2019 and the revised Guidelines on Digital Assets dated 19 August 2024. In 2026, regulatory emphasis expanded to institutional-grade digital asset experimentation and governance, including BNM activity through the Digital Asset Innovation Hub and SC requirements effective 30 March 2026 that Shariah-compliant digital currency offerings by Digital Asset Exchange operators obtain Shariah Advisory Council endorsement. This reinforces Shariah governance as a gating factor for Islamic digital-asset propositions.
Value Chain Analysis
Malaysia's fintech value chain starts with regulation and market infrastructure, where BNM, SC, and payment rails such as PayNet (DuitNow) define interoperability, sandbox pathways, and compliance parameters that shape product design and go-to-market. Enablers include digital identity and e-KYC tooling, cloud and data-center capacity, cybersecurity controls including fraud intelligence programs, and mobile network operators that support secure onboarding and transaction authentication, as reflected in industry initiatives around DuitNow security.
On the supply side, banks and licensed digital banks provide settlement access, safeguarding, and funding capacity. Fintechs then build consumer and SME-facing layers such as e-wallets, lending marketplaces, insurtech distribution, and wealth platforms. Distribution is led by mobile apps and increasingly extends into merchant acceptance through POS and tap-to-phone solutions, enabling embedded finance across retail and SME workflows. Key bottlenecks remain dependence on incumbent banking rails for uptime and the ongoing cost of fraud controls, while the sandbox Green Lane and bank-fintech partnerships help address these constraints by offering innovators a more structured route to test and integrate compliant solutions.
Competitive Landscape
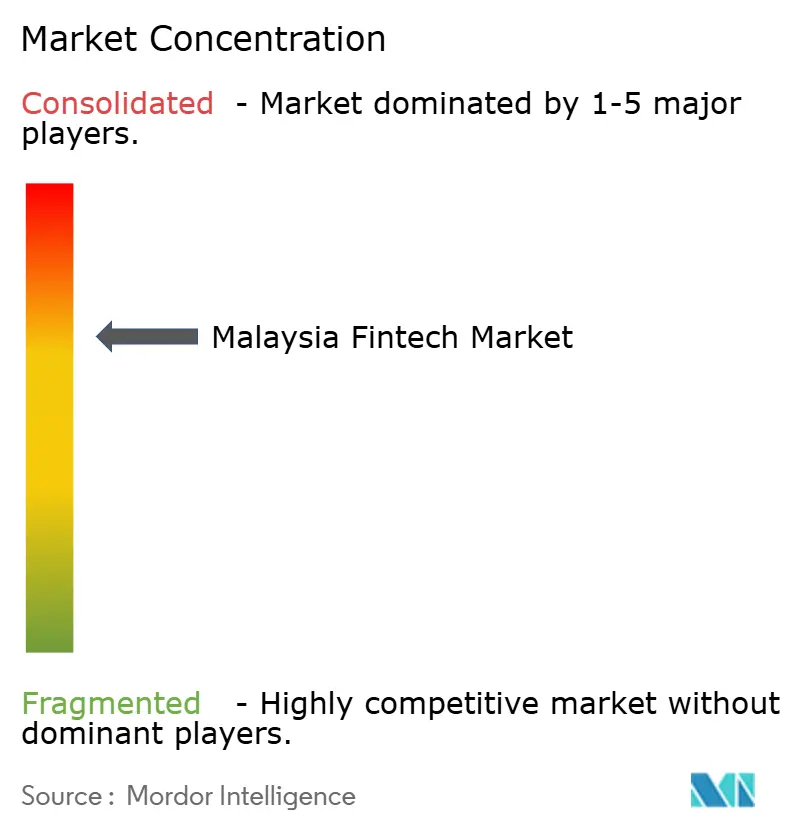
The Malaysia fintech market shows a moderate level of concentration, with a few major players holding a significant share of the industry. Touch 'n Go Digital stands out as the market leader, benefiting from its deep integration with transportation services and strong ties to government initiatives. At the same time, Maybank MAE exemplifies how traditional banks are adapting to the digital age, using their large customer base and digital transformation efforts to maintain relevance. This balance of established dominance and new growth signals a dynamic and evolving competitive environment. The market's competitive intensity is increasing, particularly with the entry of digital banking license holders like Boost Bank, which accumulated MYR 700 million (USD 147 million) In deposits within six months by focusing on technology and enhanced customer experience.
Strategically, fintech players in Malaysia are increasingly shifting toward super-app models and embedded finance solutions. This allows them to diversify revenue streams while strengthening customer loyalty through integrated services. GrabPay Malaysia, with its 15.2% market share, exemplifies this trend by combining payments with ride-hailing, food delivery, and financial services, thus boosting transaction volume and customer lifetime value. These integrated platforms offer a seamless user experience, positioning themselves as essential daily tools. As a result, companies that successfully blend multiple financial and lifestyle services are gaining a competitive edge in user retention and monetization.
Amid this evolution, white-space opportunities are emerging in specialized and underserved areas such as Islamic fintech. Platforms like Wahed Invest and Shariah-compliant lending startups are addressing unmet market needs, particularly among Muslim consumers seeking ethical finance solutions. Traditional players are also responding; for example, Hong Leong Bank's alliance with WeBank Technology Services in January 2025 illustrates a growing trend of incumbents partnering with tech-driven specialists to accelerate AI adoption and boost efficiency. At the same time, emerging disruptors like CapBay (supply chain finance), MoneyMatch (cross-border remittances), and Oyen (pet insurance) are targeting niche verticals. These innovators are challenging the status quo by delivering tailored solutions, leveraging superior technology, and offering exceptional customer experiences.
Malaysia Fintech Industry Leaders
Touch ‘n Go Digital
Maybank MAE
GrabPay Malaysia
CIMB OCTO & Boost
BigPay
- *Disclaimer: Major Players sorted in no particular order

Market Opportunities and Future Outlook
Standardization-driven payment and acceptance upgrades create an implementation runway for providers building interoperable QR and real-time transfer capabilities. BNM published the Interoperable Fund Transfer Framework (IFTF) on 30 June 2026, requiring the phase-out of proprietary QR networks by 30 June 2028. This expands the addressable market for DuitNow-aligned gateways, merchant acquirers, reconciliation tooling, and fraud controls that can be deployed across banks and e-wallets without closed-loop constraints.
Open finance and regulated experimentation are also moving from concept into structured programs. BNM opened applications for its Financial Technology Regulatory Sandbox Green Lane from 1 to 31 July 2026 and announced work on the Financial Sector Blueprint 2027 to 2030, with an Open Finance framework slated for phased implementation starting in 2027 (supported by infrastructure involving PayNet). These steps build on the scaling base visible in digital banking, where the five licensed digital banks served 2.4 million customers with MYR 4.2 billion in deposits by end-2025. The opportunity set includes consent-based data-sharing use cases such as SME cash-flow underwriting, personalized Islamic savings and financing journeys, and cross-platform embedded finance that can be distributed through super-app ecosystems.
Recent Industry Developments
- July 2026: Bank Negara Malaysia opened applications for its Financial Technology Regulatory Sandbox Green Lane for the July 1 to July 31, 2026 intake window. The intake strengthens the pipeline for regulated pilots that can be commercialized faster by licensed financial institutions and their fintech partners, supporting quicker iteration on payments, regtech, and data-driven propositions.
- June 2026: TNG Digital launched ASB Financing on TNG eWallet in collaboration with CIMB Islamic Bank, offering financing from RM10,000 to RM200,000. The product broadens Islamic financing distribution beyond bank channels and reinforces e-wallets as origination surfaces for higher-value financial products.
- March 2025: CelcomDigi and PayNet announced a partnership to strengthen DuitNow payment security through SIM-based authentication and integration with the National Fraud Portal. The initiative tightens transaction verification at the mobile layer and supports ecosystem-wide fraud intelligence sharing across participating payment providers.


Research Methodology Framework and Report Scope
Market Definition and Coverage
For this study, the Malaysia fintech market is defined as the value generated from technology-led financial products and services delivered to retail users and businesses within Malaysia, across digital channels and device-led touchpoints.
Scope exclusions: We exclude traditional bank-only services that are not delivered through a fintech-led proposition, and we also exclude non-financial software that does not directly enable a financial transaction, financing, investment, insurance, or account service.
Segmentation Overview
- By Service Proposition
- Digital Payments
- Digital Lending & Financing
- Digital Investments
- Insurtech
- Neobanking
- By End-User
- Retail
- Businesses
- By User Interface
- Mobile Applications
- Web / Browser
- POS / IoT Devices
- By Geography
- Klang Valley
- Northern Region
- Southern Region
- East Coast
- East Malaysia
Data Sources, Market Sizing, and Validation
Desk Research
Desk research was used to set the fact base for adoption, regulation, and the operating context that shapes fintech volumes and pricing in Malaysia. We referred to public sources such as Bank Negara Malaysia publications, the Securities Commission Malaysia releases, Malaysia Digital Economy Corporation updates, Department of Statistics Malaysia indicators, and World Bank digital and financial inclusion series.
To convert those signals into sizing inputs, we also reviewed company annual reports, investor presentations, and audited filings where available, along with reputable press coverage and association commentary. In parallel, we used paid subscriptions for company financial intelligence, news and financials screening, and patent database checks, which helped verify activity levels and product focus across the ecosystem. This list of desk research sources is illustrative only, and additional documents were used for data collection, validation, and clarification during the study.
Primary Interviews and Surveys
Primary work focused on aligning the model with real operating metrics and the practical definitions used by operators in Malaysia. We spoke with fintech operators, regulated financial institutions, ecosystem enablers, and informed users to validate revenue logic, typical take rates, and how volumes shift by channel (mobile, web, and POS or IoT) across major economic regions.
Where desk sources were unclear, the interviews were used to close gaps on product scope, monetization timing, and how to treat fintech value versus adjacent IT services.
Distribution of primary research fieldwork respondents
| Company type | Respondent position | Region |
|---|---|---|
| Top tier: 25% | CXOs: 14% | |
| Mid tier: 58% | Functional/Unit leaders: 38% | |
| Smaller Players: 17% | Managers: 48% |
Market-Sizing & Forecasting
Sizing starts from a top-down build where national digital finance activity is reconstructed into an addressable demand pool for fintech, and then split by service types that match observed user behavior in Malaysia. The model is then stress-tested with selective bottom-up approximations, including sampled provider revenue builds, typical fee or take-rate checks, and volume times average value logic by channel. This step helps adjust totals when one route overstates or understates activity.
A few practical inputs that are especially relevant in this market include the growth of cashless transactions, smartphone-led usage for payments and account services, the rollout pace of digital banking products, consumer and SME credit uptake for digital lending, and the share shift from cash to wallet and card rails. For forecasting, we use scenario analysis anchored on these variables so that base, conservative, and faster adoption cases can be compared, then aligned back to what experts view as realistic for the next few years. When bottom-up datapoints are missing for smaller categories, we use proxy ratios from similar services, followed by rechecks with interview feedback to avoid overstating niche areas.
Data Validation & Update Cycle
Outputs are validated through triangulation across independent signals, including public regulatory indicators, reported transaction trends, and company disclosures that reflect monetization. Any unusual jumps in growth, sudden share shifts between channels, or inconsistent pricing assumptions are flagged, reviewed, and corrected before internal sign-off.
The work is reviewed in multiple steps so that definitions, arithmetic, and reasonableness checks are aligned across segments and regions. Reports are refreshed annually, and interim updates are triggered when material events occur, such as major regulatory changes or new category launches. Before delivery, we do a final pass so clients receive the latest updated view available at that time.
Mordor Intelligence's Malaysia Fintech Market Size Versus Other Published Estimates
Published numbers for Malaysia fintech can look far apart because some sources mix transaction value with revenue, and others group digital banking, payments, and broader digital commerce under one label. Differences in currency timing, whether figures are gross or net of pass-through flows, and how quickly assumptions are refreshed also change the final market value.
The main gap comes from counting payment flows as market size, and Mordor Intelligence treats the market as fintech value across defined service lines (including neobanking, insurtech, and digital investments) rather than total transaction throughput. Using payment throughput as the headline figure can inflate results when large ticket payments are included.
Benchmark comparison
| Source | Market Size | Gaps in Research Methodology |
|---|---|---|
| Mordor Intelligence | USD 10.40 B (2025) | |
| Industry Association A | USD 50.00 B (2024) | Often cited as an overall market value, this style of estimate commonly reflects transaction flow value across fintech rails, with limited disclosure on whether it is net revenue, gross volume, or includes adjacent digital commerce. |
| Trade Journal B | USD 0.66 B (2024) | This type of figure is typically built from a narrower revenue-only lens that can exclude regulated digital banking activity and non-payment verticals, and it may also apply conservative take-rate and monetization assumptions. |
Overall, the spread is mainly explained by whether the number represents money moving through systems, or the value captured by fintech providers, plus how wide the included service set is. Our approach keeps the scope consistent across core fintech verticals and then ties the total back to observable adoption and pricing signals, which makes the final number easier to reconcile and update over time.


Key Questions Answered in the Report
What is the current value of the Malaysia fintech market?
The market is valued at USD 12.07 billion in 2026.
How fast is the Malaysia fintech market expected to grow by 2031?
It is projected to expand at a 16.05% CAGR, reaching USD 25.41 billion by 2031.
Which service line holds the largest share in Malaysia’s fintech scene?
Digital payments lead with 50.72% revenue share in 2025.
Which region in Malaysia shows the quickest fintech growth outlook?
East Malaysia is forecast to record 23.7% CAGR through 2031, the fastest nationwide.
What factor most accelerates SME adoption of fintech services in Malaysia?
Government’s RM 1.5 billion (USD 315 million) Business Digitalisation Initiative subsidizes digital tools and financing, spurring SME uptake.
How concentrated is competition among Malaysia’s fintech providers?
The top five firms control 75.8% of market value, indicating moderate concentration.
Page last updated on:


