
Market Overview
| Study Period | 2020 - 2031 |
|---|---|
| Forecast Data Period | 2026 - 2031 |
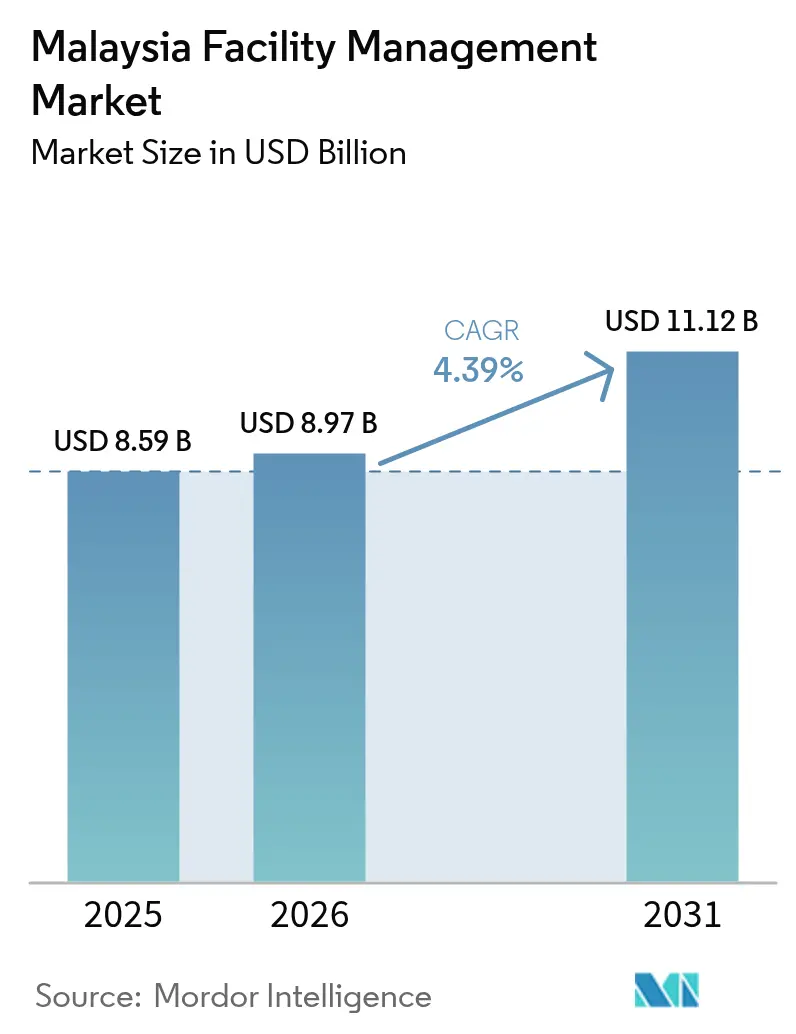
| Base Year Market Size (2025) | USD 8.59 Billion |
| Market Size (2026) | USD 8.97 Billion |
| Market Size (2031) | USD 11.12 Billion |
| Growth Rate (2026 - 2031) | 4.39% CAGR |
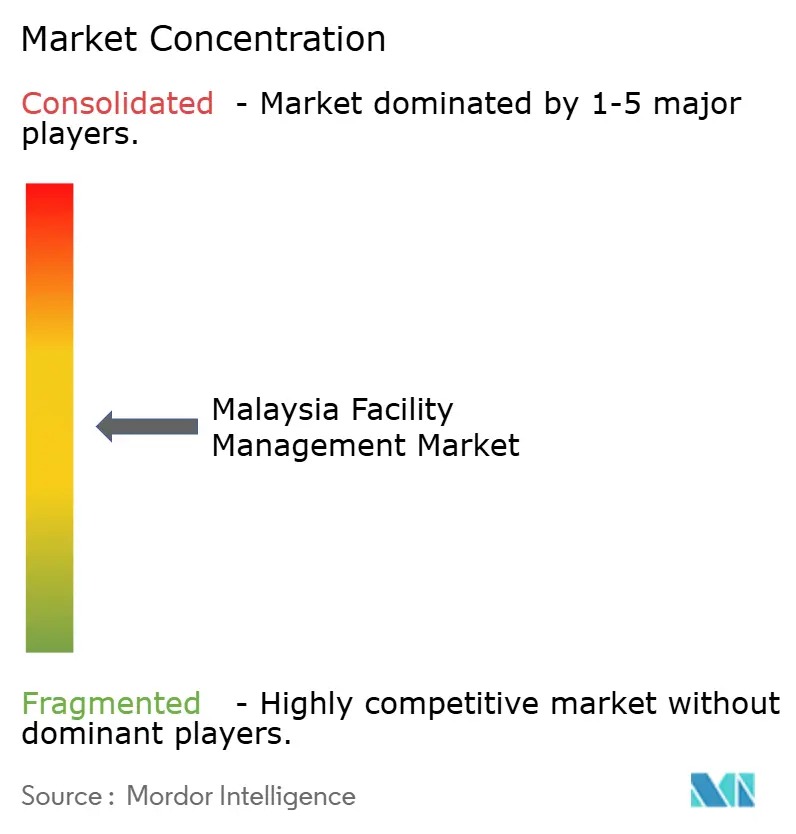
| Market Concentration | Medium |
Major Players *Disclaimer: Major Players sorted in no particular order Image © Mordor Intelligence. Reuse requires attribution under CC BY 4.0. | |
Malaysia Facility Management Market Analysis by Mordor Intelligence
The Malaysia facility management market size is expected to grow from USD 8.59 billion in 2025 to USD 8.97 billion in 2026 and is forecast to reach USD 11.12 billion by 2031 at 4.39% CAGR over 2026-2031. The solid growth outlook shows how quickly service providers are adapting to new safety rules, smart-building mandates, and expanding infrastructure projects. Strong public-private partnership spending, led by an airport modernization program worth RM10 billion (USD 2.36 billion), is pulling integrated suppliers into long-term contracts. Digital twin platforms, artificial intelligence scheduling, and IoT sensors are reshaping day-to-day maintenance tasks while improving uptime and energy use. Stricter ESG reporting rules and the National Energy Transition Roadmap are prompting clients to demand measurable sustainability results in their facility tenders. At the same time, currency swings and labor shortages are prompting companies to automate repetitive work and renegotiate imported equipment contracts in advance.
Key Report Takeaways
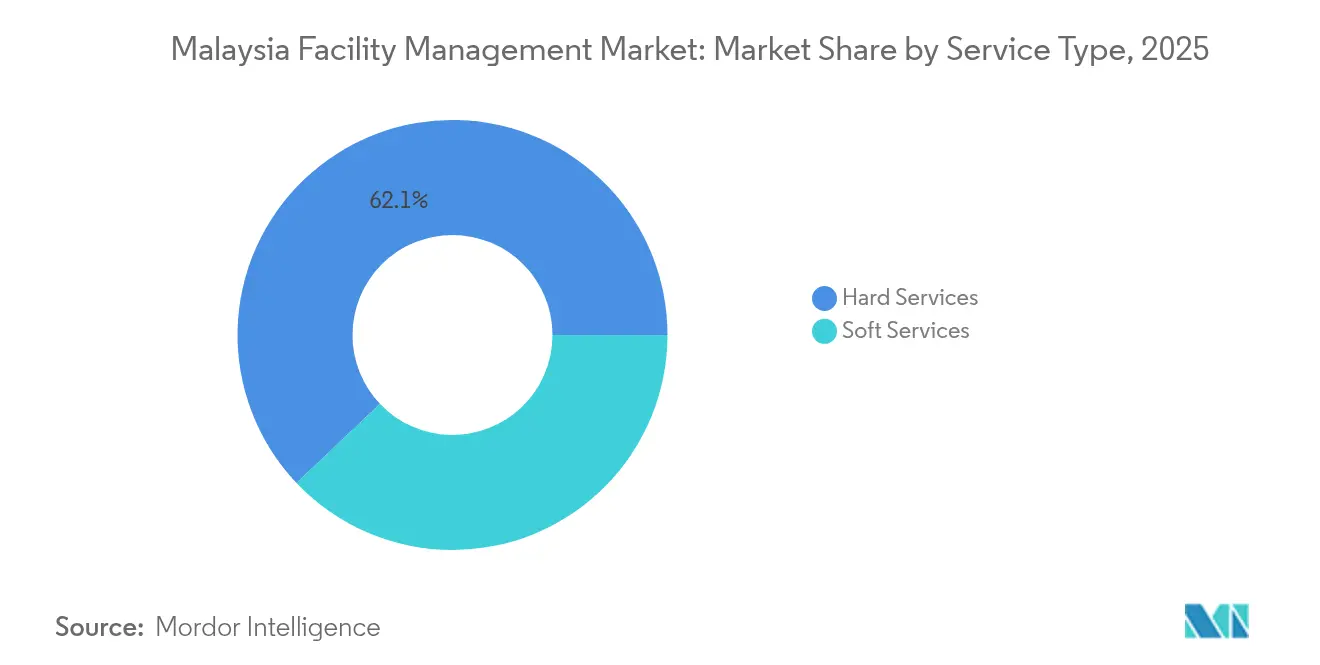
- By service type, Hard Services led with 62.08% of Malaysia facility management market share in 2025, while Soft Services posted the fastest 4.42% CAGR through 2031.
- By offering type, the in-house model controlled 54.88% of the Malaysia facility management market size in 2025, whereas outsourced solutions are set to expand at a 4.35% CAGR over the forecast horizon.
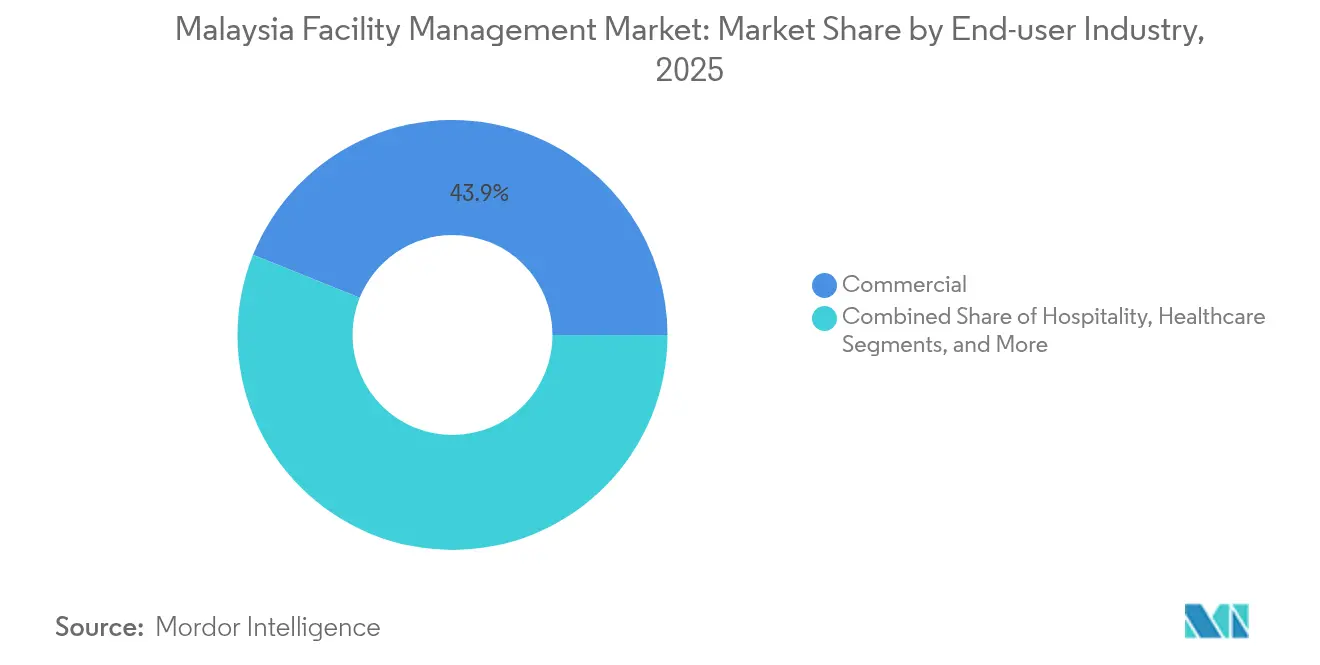
- By end-user industry, commercial facilities captured 43.92% revenue share in 2025, while industrial and process sites are advancing at a 4.38% CAGR through 2031.
Note: Market size and forecast figures in this report are generated using Mordor Intelligence’s proprietary estimation framework, updated with the latest available data and insights as of 2026.
Malaysia Facility Management Market Trends and Insights
Drivers Impact Analysis*
| Driver | (~) % Impact on CAGR Forecast | Geographic Relevance | Impact Timeline |
|---|---|---|---|
| Regulatory Overhaul Reshapes Compliance Requirements | +0.8% | National, with concentrated impact in Kuala Lumpur, Selangor, Johor | Short term (≤ 2 years) |
| Technology Integration Drives Operational Efficiency | +0.6% | National, with early adoption in Klang Valley, Penang, Johor Bahru | Medium term (2-4 years) |
| ESG Compliance Becomes Competitive Differentiator | +0.4% | National, with premium demand in urban centers | Long term (≥ 4 years) |
| Outcome-Based Contracting Anchors Long-Term Partnerships | +0.3% | National, with government sector leading adoption | Medium term (2-4 years) |
| Smart Building Mandates Propel Demand for FM Digital Twins | +0.5% | Urban centers, with Kuala Lumpur and Cyberjaya leading | Long term (≥ 4 years) |
| Public-Private Partnership Projects Accelerate FM Outsourcing | +0.7% | National, with major projects in Kuala Lumpur, Johor, Penang | Medium term (2-4 years) |
| Source: Mordor Intelligence | |||
Regulatory overhaul reshapes compliance rules
The Occupational Safety and Health Amendment Act 2022, effective 1 June 2024, broadens coverage to every workplace and raises violation fines tenfold to RM500,000 (USD 117,771.76). [1]Rödl & Partner, “Amendments to the Occupational Safety and Health Act Take Effect,” roedl.com Hospitals, private schools, and co-working sites now hire specialist facility managers to conduct risk audits, train OSH coordinators, and keep digital compliance logs. Healthcare operators are absorbing higher operating costs, with Universiti Malaya Medical Centre raising some specialist fees by over 200% to offset safety investments. Demand is strongest in Kuala Lumpur, where high-rise density and multi-tenant structures complicate evacuation plans. Service providers with certified safety engineers and real-time incident dashboards are winning multi-year contracts that embed performance penalties for non-compliance.
Technology integration lifts operational efficiency
Digital Nasional Berhad’s AI-driven network management delivered 99.8% uptime and cut alarm counts by 500%, offering a clear benchmark for predictive building maintenance. [2]Ericsson, “Data-Driven to Intent-Based Operations,” ericsson.com IoT meters feed energy dashboards that spot abnormal consumption patterns within minutes rather than days. Digital twin rollouts trim maintenance expenses by 30% and slash unscheduled equipment failures by 70%. A Kuala Lumpur office block recorded comfort improvements and lower HVAC runtime after deploying an IoT energy management system. AI chiller optimization at a luxury hotel yielded 9% energy savings plus faster compliance reporting. Integrated platforms, such as UEM Edgenta’s SmartConnect, enable remote portfolio oversight and standardized KPI scorecards.
ESG compliance gains strategic weight
UEM Sunrise targets net-zero by 2050 and requires facility partners to submit carbon-cutting plans at the bid stage, embedding Scope 1 and Scope 2 metrics into service level agreements. [3]UEM Sunrise, “Embracing Sustainability for Better Living,” uemsunrise.com Financial institutions now link credit terms to tenant sustainability data; Maybank has mobilized more than RM34 billion (USD 8.01 billion) in sustainable finance, channeling funds toward green retrofits and the first healthcare sustainability sukuk. Hybrid solar parks in Johor generate on-site renewables for industrial clients that commit to long-term green power purchase agreements. Carbon tax pilot schemes under the National Energy Transition Roadmap further raise demand for verifiable emissions tracking in facility contracts. Providers able to bundle energy advisory, waste auditing, and digital ESG dashboards command premium rates in urban corporate headquarters.
Outcome-based contracts deepen partnerships
Government agencies now specify passenger comfort, asset uptime, and energy-reduction metrics rather than head-count-driven work orders. Malaysia Airports Holdings Berhad ties payments to quantifiable improvements in terminal availability and customer service scores within its RM10 billion (USD 2.36 billion) capex program. The SMART Tunnel’s long-running PPP shows how performance-linked payments can align incentives for complex traffic and flood-control operations. In healthcare, KPJ Healthcare’s smart-hospital project evaluates vendors on patient throughput and equipment downtime rather than traditional janitorial benchmarks. Outcome-based models favor well-capitalized companies able to absorb performance risk, driving consolidation among medium-sized firms seeking balance-sheet strength.
Restraints Impact Analysis*
| Restraint | (~) % Impact on CAGR Forecast | Geographic Relevance | Impact Timeline |
|---|---|---|---|
| Labor Market Dynamics Challenge Service Delivery | -0.5% | National, with acute shortages in Kuala Lumpur, Penang, Johor Bahru | Short term (≤ 2 years) |
| Rising Interest Rates Constrain Capital Budgets | -0.3% | National, with higher impact on capital-intensive projects | Medium term (2-4 years) |
| Fragmented Vendor Landscape Limits Standardization | -0.2% | National, with regional variations in service quality | Long term (≥ 4 years) |
| Currency Volatility Increases Cost of Imported FM Technologies | -0.4% | National, with higher impact on technology-dependent services | Short term (≤ 2 years) |
| Source: Mordor Intelligence | |||
Labor market dynamics challenge service delivery
Businesses across Malaysia report 25% understaffing in food-service operations, forcing shorter opening hours and lowering revenue by 15%. The construction trades that underpin hard-service capacity still rely on foreign workers, with plantations running at more than 70% overseas labor share. The government has waived industry quotas to speed recruitment, yet visa processing bottlenecks persist, especially for skilled technicians. Wage inflation is accelerating; large Government-Linked Investment Companies set a RM3,100 (USD 730.18) living-wage floor, cascading into cleaning, security, and maintenance pay scales. Providers now deploy autonomous cleaning robots and centralized help-desks to mitigate rising payroll costs, yet talent scarcity remains the top short-term operational risk.
Currency volatility lifts imported tech costs
The Ringgit reached a 26-year low in late 2024, lifting landed prices for sensors, smart locks, and CMMS software that are priced in US dollars. Although the rate rebounded to 4.4185 MYR/USD by mid-2025, traders still expect wide swings linked to export demand and US policy moves. Facility managers report bid prices on imported HVAC drives rising 12% in local terms, triggering renegotiation clauses. Sophisticated players hedge currency exposure through forward contracts and source selected IoT devices from regional suppliers to reduce USD dependency. Smaller vendors, lacking treasury capacity, pass cost increases directly to clients, eroding margin headroom in fixed-price deals.
*Our forecasts treat driver/restraint impacts as directional, not additive. The impact forecasts reflect baseline growth, mix effects, and variable interactions.
Segment Analysis
By Service Type: Dominant hard services, accelerating soft services
Hard Services generated 62.08% of the Malaysia facility management market share in 2025, supported by rising compliance spending on fire safety, MEP, and asset integrity inspections. Data-center expansion in Johor Bahru alone adds 1.6 GW of critical capacity that requires round-the-clock mechanical and electrical coverage. Soft Services, although smaller in value, will grow at a 4.42% CAGR to 2031 as workplace experience becomes a competitive tool in hybrid offices. Contactless cleaning robots, on-demand catering platforms, and predictive staffing engines are gaining traction among blue-chip tenants. Providers leverage visitor analytics and mobile help-desks to raise occupant satisfaction scores, backing the shift from cost-center to revenue-protection logic.


By Offering Type: In-house resilience, outsourced momentum
The in-house model controlled 54.88% of the Malaysia facility management market size in 2025, reflecting risk-sensitive sectors such as healthcare and finance that prefer full oversight. Outsourced contracts, however, are expanding at 4.35% CAGR as smart-building rollouts demand niche skills not always available internally. Single-service outsourcing appeals to small enterprises with limited budgets; bundled FM suits mid-tier firms seeking scale economics; integrated FM anchors large PPP projects like the SMART Tunnel where lifecycle accountability is paramount. Market entrants with proprietary IoT analytics and ESG scorecards secure premium integrated deals, encouraging mergers among traditional janitorial firms to broaden digital capability.
By End-user Industry: Commercial dominance, industrial surge
Commercial properties delivered 43.92% revenue share in 2025, driven by logistics hubs, large retail chains, and office towers that demand stringent uptime and customer comfort standards. Retailers like 99 Speed Mart aim to open 250 more outlets every year, locking in predictable cleaning, security, and minor works volumes. Rapid data-center investment places mission-critical SLA terms at the center of new commercial FM contracts. The industrial and process segment will grow fastest at 4.38% CAGR, underpinned by Industry 4.0 rollouts in electronics, chemicals, and energy. MKS Instruments’ new Penang Super Center requires ISO-class cleanroom maintenance and robotics calibration—services that command higher rates than legacy plant care. PETRONAS forecasts a steady pipeline of general facilities maintenance contracts, reinforcing demand for multi-disciplinary FM partners.
Geography Analysis
The Klang Valley accounts for the largest share of Malaysia facility management market revenue, supported by dense office stock, government headquarters, and transport assets. Malaysia Airports’ RM10 billion (USD 2.36 billion) investment plan centers on Kuala Lumpur International Airport upgrades that require advanced asset-lifecycle strategies. Smart-city pilots in Cyberjaya deploy digital twins for traffic, lighting, and waste services, boosting demand for analytics-savvy vendors.
Johor is the fastest-growing region to 2031 as the Johor-Singapore Special Economic Zone and a RM90.2 billion (USD 21.25 billion) data-center pipeline transform the local asset base. A 1 GW hybrid solar park in Gerbang Nusajaya opens a new category of renewable-energy FM, blending electrical operations and maintenance with sustainability reporting.
Penang retains its semiconductor focus; Bertam City’s digital-twin master plan targets 69.7% lower energy use, setting a benchmark for green campus FM. Sabah and Sarawak present emerging utility and tourism infrastructure opportunities, though logistics constraints still lengthen response times.
Regulatory Landscape
Malaysia's facility management compliance environment is tightening around workplace safety, contractor eligibility, and service standardization. The Occupational Safety and Health Amendment Act 2022 took effect on 1 June 2024, broadening obligations across workplaces and raising penalties, which has increased the need for documented risk management, trained coordinators, and auditable logs in multi-tenant assets. For government-linked work, the Construction Industry Development Board (CIDB) retains statutory authority to register and approve FM-related contractors for tenders, reinforcing a formal gatekeeping layer for market entry and renewals.
On operational standards and digital readiness, the Department of Standards Malaysia (JSM) maintains Malaysian Standards aligned to ISO 41001 and ISO 41018 for FM management systems and policy development, including a climate-action amendment to MS ISO 41001 (Amd. 1:2024). In February 2026, the Digital Ministry launched the Digital Automation and Technological Advancement (DATA) policy to accelerate public-sector data adoption and AI readiness, including expansion of MyGDX 2.0 for secure data sharing. This raises the bar for FM providers supporting government facilities by requiring integration of digital reporting, interoperability, and data governance into service delivery.
Value Chain Analysis
Malaysia's FM value chain begins with policy and qualification enablers, then shifts to asset-data creation at project handover before moving into day-to-day service execution. Upstream, standards and competency frameworks (CIDB initiatives and JSM-aligned MS ISO 41001/MS ISO 41018) influence how owners specify outcomes, documentation, and ESG-aligned operations in tenders. Inputs span skilled labor and specialist subcontractors (M&E, fire systems, lift services, security, cleaning), along with imported and local technology stacks such as CMMS, BMS, sensors, smart access, and energy monitoring hardware.
Midstream delivery is split between in-house teams and outsourced providers that coordinate single, bundled, or integrated FM across portfolios. Telecom and digital infrastructure players increasingly serve as enabling partners for connected buildings, including CelcomDigi and Telekom Malaysia supporting IoT, private/industrial connectivity, and Vision AI building-management use cases that link network operations, device management, and data pipelines to maintenance workflows. Downstream, end users such as commercial towers, industrial parks, airports, hospitals, and public complexes procure services through outcome-based SLAs, while performance reporting, compliance audits, and sustainability data submissions feed back into renewals and expanded scopes, particularly for smart-building and mission-critical assets.
Competitive Landscape
Malaysia facility management market competition remains moderate, with top five players holding an estimated 38% combined revenue share. UEM Edgenta leverages its SmartConnect IoT platform plus a 60% stake in Saudi-based MEEM to offer overseas case references and achieve scale synergies. CBRE and Cushman & Wakefield win multinational corporate mandates consuming bundled soft and hard services across ASEAN.
SMRT Holdings restructured to concentrate on IoT sensors, pushing recurring maintenance revenue to above 50% and opening channels in Indonesia and the Philippines. GFM Services targets industrial plant clients with asset reliability engineering, while ISS Facility Services strengthens soft-service robotics.
White-space exists in data-center FM, renewable-energy operations and maintenance, and healthcare sterilization outsourcing. Smaller regional firms merge or partner with tech specialists to meet ESG analytics tender criteria.
Malaysia Facility Management Industry Leaders
AWC Berhad
MST Facilities Sdn Bhd.
Harta Maintenance Sdn Bhd
Zelan AM Services Sdn Bhd
SYREFL Holdings Sdn Bhd
- *Disclaimer: Major Players sorted in no particular order

Market Opportunities and Future Outlook
Whitespace is concentrated in data-driven integrated FM that connects asset information, field execution, and compliance reporting within a single operating model. A specific catalyst is Malaysia's shift toward standardized digital asset information for downstream operations, including a mandatory Building Information Modelling (BIM) requirement effective 1 July 2025 for public and private construction projects valued at MYR 10 million or more, which supports structured digital handover into FM systems. This creates room for providers that can operationalize BIM into CMMS workflows, digital twins, and measurable energy and safety performance, instead of treating handover data as static documentation.
Opportunity also expands via national digitalization programs and the growing base of connected, automation-ready facilities. The Thirteenth Malaysia Plan (2026-2030) prioritizes digitalization, AI, predictive analytics, and robotics in productivity and value-chain upgrading, aligning with FM use cases such as predictive maintenance, workforce optimization, and automated soft services. On-ground demand for integrated workforce and service delivery is reflected in YY Group's May 2026 expansion of operations into Melaka through workforce partnership services for a 5-star hotel, which indicates that multi-site hospitality and commercial operators are procuring more structured, scalable service models beyond the Klang Valley.
Recent Industry Developments
- June 2026: CelcomDigi launched an Advanced Intelligent Warehouse at Hap Seng Business Park using 5G standalone connectivity to enable AI and robotics-led operations. The move strengthens the infrastructure layer for smart industrial facilities, increasing demand for FM teams that can operate connected assets, integrate sensor data into maintenance workflows, and meet stricter uptime SLAs.
- October 2025: AWC Berhad secured a five-year integrated facilities management contract from TM Technology Services Sdn Bhd for TM Data Centres and buildings at TM Central 1. This contract expands AWC's exposure to mission-critical environments where predictive maintenance, compliance documentation, and performance-based delivery shape vendor selection.
- October 2024: AWC Berhad won a 60-month facilities management and maintenance contract from Jabatan Kerja Raya Melaka for the ICQS complex at Sungai Melaka. The award reinforces recurring government facilities work outside the Klang Valley and highlights the role of multi-year maintenance scopes in stabilizing provider backlogs.


Research Methodology Framework and Report Scope
Market Definition and Coverage
For this methodology, the market covers facility management services delivered for buildings and sites in Malaysia, where providers manage day to day operations, upkeep, and support services that keep facilities safe, functional, and compliant.
Scope exclusions: We exclude one time construction work and pure equipment manufacturing sales that are not sold as part of an ongoing facility service contract.
Segmentation Overview
- By Service Type
- Hard Services
- Asset Management
- MEP and HVAC Services
- Fire Systems and Safety
- Other Hard FM Services
- Soft Services
- Office Support and Security
- Cleaning Services
- Catering Services
- Other Soft FM Services
- Hard Services
- By Offering Type
- In-house
- Outsourced
- Single FM
- Bundled FM
- Integrated FM
- By End-user Industry
- Commercial (IT and Telecom, Retail and Warehouses, etc.)
- Hospitality (Hotels, Eateries, Large-scale Restaurants)
- Institutional and Public Infrastructure (Govt, Education, Transportation)
- Healthcare (Public and Private Facilities)
- Industrial and Process (Manufacturing, Energy, Mining)
- Other End-user Industries (Multi-housing, Entertainment, Sports and Leisure)
Data Sources, Market Sizing, and Validation
Desk Research
Desk research starts with public signals that show the size and activity level of Malaysia's building stock and the services needed to run it. We rely on sources such as the Department of Statistics Malaysia for construction and services indicators, and Bank Negara Malaysia for inflation and macro trends that influence contract pricing.
To anchor demand drivers, we also review materials from agencies and public bodies that track property and infrastructure activity, such as government procurement portals, PPP project disclosures, and energy efficiency related publications that describe compliance needs and building operations priorities. Annual reports, investor presentations, and audited filings from listed service providers are used to understand service mix, contract duration, and how revenues are recognized. Where helpful, we reference paid company financial databases and business intelligence sources, a news and financials feed, and import or export shipment level data to validate company exposure and equipment intensive service intensity. These examples are not exhaustive, and we also use other public and paid sources to collect data, cross check assumptions, and clarify the market scope.
Primary Interviews and Surveys
Primary work is used to pressure test what desk sources cannot fully explain, especially the split between in house and outsourced work and how single, bundled, and integrated contracts are priced. We speak with buyers and operators across commercial buildings, hospitality sites, public and institutional facilities, healthcare locations, and industrial sites, and then compare how hard services and soft services are bundled in real contract structures across Malaysia.
Distribution of primary research fieldwork respondents
| Company type | Respondent position | Region |
|---|---|---|
| Top tier: 25% | CXOs: 13% | |
| Mid tier: 57% | Functional/Unit leaders: 36% | |
| Smaller Players: 18% | Managers: 51% |
Market-Sizing & Forecasting
Sizing begins from the demand pool, where building activity and operating needs are reconstructed through Malaysia specific indicators and then translated into annual service spending. We use a top-down approach once by mapping the addressable built environment (commercial, hospitality, institutional and public infrastructure, healthcare, and industrial sites) to typical facility service intensity, and then adjusting for outsourcing penetration and contract coverage.
To keep totals realistic, we corroborate results with selective bottom-up approximations such as sampled contract values, provider revenue exposure checks, and simple volume times ASP calculations for common service lines. Where smaller providers do not disclose enough detail, we fill gaps using conservative ranges. Key inputs used in the model include the active building pipeline and completions, outsourcing share versus in house delivery, the mix of hard versus soft services, labor cost trends that impact service rates, and the share of integrated or bundled contracts that usually carry different pricing and retention.
For forecasting, we apply scenario analysis so the base case follows expected building operations growth, while separate cases capture faster outsourcing adoption or slower rate increases when budgets tighten. The final path is selected after checking assumptions on service rate progression and contract renewal behavior with primary respondents who see pricing and volumes at the facility level.
Data Validation & Update Cycle
Validation is done through multiple checks so that no single data series drives the outcome. We compare modeled totals against independent signals such as provider revenue direction, staffing and wage pressure commentary, and observed shifts in outsourcing and integrated contract uptake, and we review anomalies until the drivers are clearly understood.
Before sign off, the model is reviewed in steps by another analyst to confirm definitions, math integrity, and that the service scope matches what buyers actually contract for. Reports are refreshed annually, and interim updates are made when material events occur that can change pricing or demand patterns. Right before delivery, a final pass is completed so clients receive the latest view aligned to the most recent macro inputs and interview feedback.
Mordor Intelligence's Malaysia Facility Management Market Size Compared Against Other Published Estimates
Published market values for Malaysia facility management can differ because each publisher sets its own scope boundaries and timing choices, and then updates assumptions at a different pace. Differences also show up when some estimates blend in adjacent categories or use an older exchange rate and inflation view for a USD market value.
Key gap drivers usually come from whether in house activity is counted the same way as outsourced contracts, how single, bundled, and integrated offerings are treated, and how fast ASPs are allowed to move when wages and compliance needs change. The refresh cadence matters too, because a model that rechecks currency timing and rate progression after new macro prints can land at a different current year value than a model carried forward from older inputs. This is the refresh-led reason behind the spread you see in the table, plus the checks applied by Mordor Intelligence.
Benchmark comparison
| Source | Market Size | Gaps in Research Methodology |
|---|---|---|
| Mordor Intelligence | USD 8.59 B (2025) | |
| Trade Journal A | USD 12.47 B (2025) | The estimate appears to use a broader basket that likely blends more in house delivered activity and adjacent property services, and it is less clear how bundled and integrated contracts are netted to avoid double counting. |
| Industry Blog B | USD 15.57 B (2025) | The figure is presented alongside software and digitization themes, which can inflate the scope by mixing FM operations with technology spend, and the pricing build is not transparent on how ASPs move with wage and inflation timing. |
Overall, the spread is mainly explained by scope and timing choices, not by a single growth assumption. By tying the total to a defined service contract boundary, checking outsourcing and offering mix, and keeping pricing logic consistent with observed labor and inflation movement, the market value becomes easier to trace and repeat.


Key Questions Answered in the Report
What is the current value of the Malaysia facility management market?
The market is worth USD 8.97 billion in 2026, moving toward USD 11.12 billion by 2031.
Which segment holds the largest Malaysia facility management market share?
Hard Services lead with 62.08% share in 2025, driven by mandatory safety and asset-integrity spending.
Why is Johor the fastest-growing regional market?
Massive data-center projects totaling RM90.2 billion and the Johor-Singapore Special Economic Zone boost specialized FM demand.
How are new safety regulations affecting service demand?
The Occupational Safety and Health Amendment Act 2022 widens coverage to all workplaces, raising penalties and pushing firms to outsource compliance tasks to certified facility managers.
What role do digital twins play in the Malaysia facility management industry?
Digital twins cut maintenance costs by up to 30% and improve asset uptime, making them a key selection criterion in outcome-based FM contracts.
Page last updated on:


