
Market Overview
| Study Period | 2020 - 2031 |
|---|---|
| Forecast Data Period | 2026 - 2031 |
| Base Year Market Size (2025) | USD 10.62 Billion |
| Market Size (2026) | USD 12.18 Billion |
| Market Size (2031) | USD 23.11 Billion |
| Growth Rate (2026 - 2031) | 13.67% CAGR |
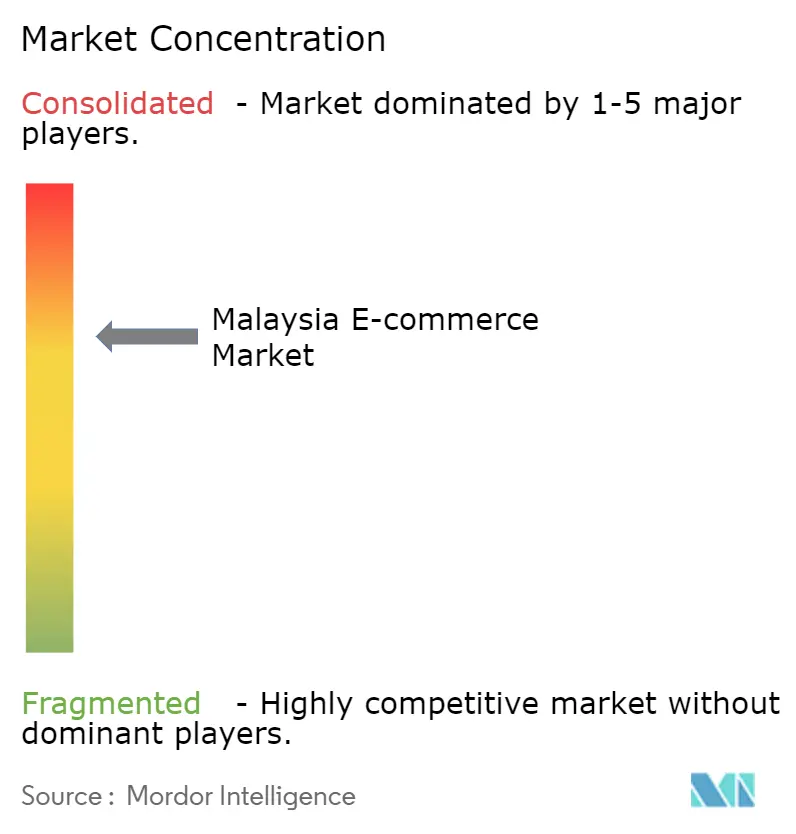
| Market Concentration | Medium |
Major Players *Disclaimer: Major Players sorted in no particular order Image © Mordor Intelligence. Reuse requires attribution under CC BY 4.0. | |
Malaysia E-commerce Market Analysis by Mordor Intelligence
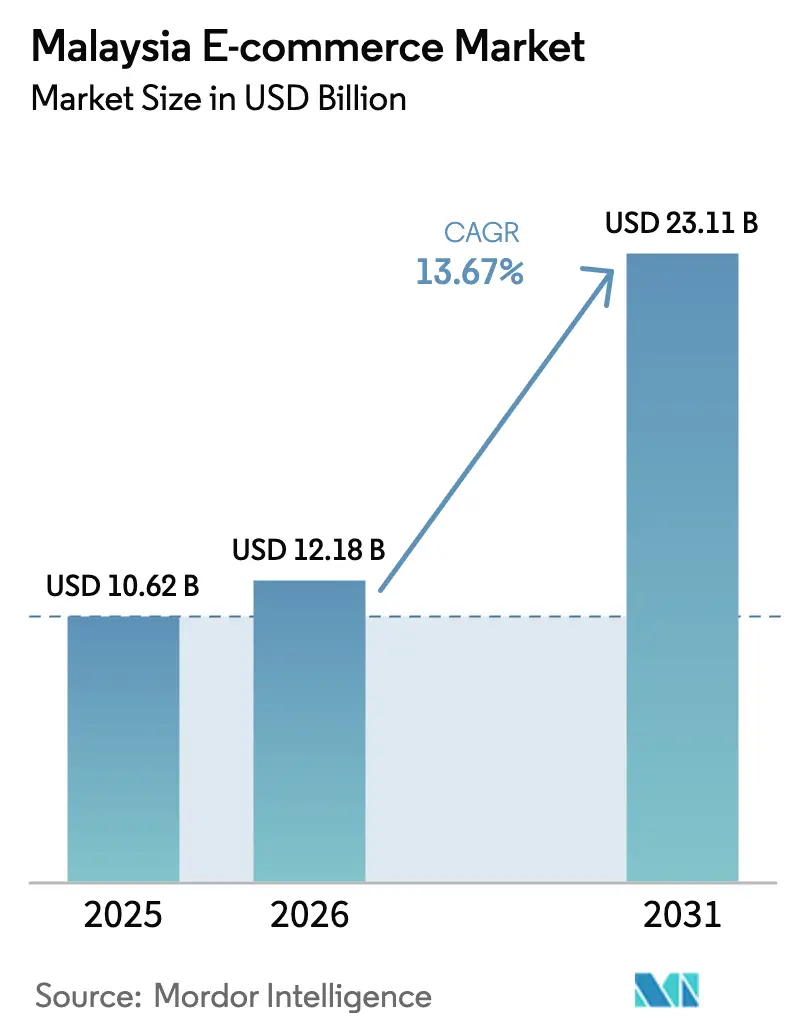
The Malaysia e-commerce market size is expected to increase from USD 10.62 billion in 2025 to USD 12.18 billion in 2026 and reach USD 23.11 billion by 2031, growing at a CAGR of 13.67% over 2026-2031. Strong policy support, ubiquitous mobile connectivity, and instant digital payments continue to propel the Malaysia e-commerce market, especially among millennials and first-time rural buyers. Government mandates such as the National E-Commerce Strategic Roadmap 2.0 and MyDIGITAL lower entry barriers for 1.1 million small businesses, while 82.4% 5G coverage underpins app-first shopping journeys. Interoperable DuitNow QR has removed payment friction at 2.6 million merchant points, enabling live-stream shopping to flourish as social video converts on-the-spot interest into sales. Competitive intensity is rising as TikTok Shop, Shopee, and Lazada pour subsidies into user acquisition even though urban penetration already exceeds 85% and customer acquisition costs keep climbing. The Malaysia e-commerce market retains considerable upside in halal-certified assortments and value-added reverse logistics that can unlock demand from East Malaysia’s underserved consumers.
Key Report Takeaways
- By product category, fashion and apparel led with 26.67% revenue share in 2025, while food and beverages are forecast to expand at a 16.46% CAGR through 2031.
- By business model, the B2C segment held 80.89% of the Malaysia e-commerce market share in 2025, whereas B2B is projected to record the fastest 15.63% CAGR to 2031.
- By device, smartphones captured 72.67% of the Malaysia e-commerce market size in 2025 and are projected to advance at a 15.87% CAGR over the forecast horizon.
- By payment method, digital wallets accounted for 34.92% of transaction value in 2025, while buy-now-pay-later solutions are set to grow at a 17.18% CAGR to 2031.
Note: Market size and forecast figures in this report are generated using Mordor Intelligence’s proprietary estimation framework, updated with the latest available data and insights as of January 2026.
Malaysia E-commerce Market Trends and Insights
Drivers Impact Analysis*
| Driver | (~) % Impact on CAGR Forecast | Geographic Relevance | Impact Timeline |
|---|---|---|---|
| Government Digitalisation Agendas (NESR 2.0, MyDIGITAL) | +2.2% | National, early gains in Klang Valley, Penang, Johor Bahru | Medium term (2-4 years) |
| 90%+ Smartphone Penetration and Expanding 5G Coverage Boosting M-Commerce | +1.8% | National, faster in urban centers | Short term (≤ 2 years) |
| Rapid E-Wallet Adoption and Interoperable DuitNow QR | +1.5% | Peninsular core, expanding to East Malaysia | Short term (≤ 2 years) |
| Dense Third-Party Logistics and On-Demand Delivery Build-Out | +1.3% | Peninsular Malaysia core | Medium term (2-4 years) |
| Live-Stream and Social-Commerce GMV Surge | +1.4% | National, urban youth leading | Short term (≤ 2 years) |
| Halal-Certified Online Shelves Unlocking Rural Demand | +0.9% | National, spillover to Indonesia, Brunei, Middle East | Long term (≥ 4 years) |
| Source: Mordor Intelligence | |||
Government Digitalisation Agendas (NESR 2.0, MyDIGITAL)
Policy blueprints act as scaffolding that de-risk private investment in fulfilment, payments, and digital skills. Grants lowered onboarding costs for 1.148 million businesses by 2025, while mandatory e-invoicing in July 2025 nudged legacy retailers online.[1]Malaysia Digital Economy Corporation, “MyDIGITAL Blueprint Progress Report 2025,” MDEC.MY Customs pre-clearance slashed parcel transit times from China and Singapore by 30% in 2024, yet the MYR 1.65 trillion GMV target for 2025 still outpaces current infrastructure. Continued public spending until 2031 remains pivotal for rural inclusion.
90%+ Smartphone and 5G Coverage Boosting M-Commerce
5G covered 82.4% of populated areas by Q3 2025, though median speeds fell to 243 Mbps as user density surged.[2]Opensignal, “Malaysia 5G Experience Report Q3 2025,” OPENSIGNAL.COM Smartphones already drive nearly three-quarters of Malaysia e-commerce market transactions, and progressive web apps that load under three seconds shield conversion rates even on congested towers. Planned mid-band spectrum in 2026 will triple capacity in Kuala Lumpur, Penang, and Johor Bahru, while rural Sabah and Sarawak still depend on 4G backhaul that struggles with high-definition product videos.
Rapid E-Wallet Adoption and Interoperable DuitNow QR
Digital wallets processed MYR 31.1 billion (USD 7.2 billion) in 2024 and held 34.92% share of online payments in 2025.[3]PayNet, “DuitNow QR Annual Report 2024,” PAYNET.MY Cross-border QR linkages with Singapore, Thailand, and Indonesia handled 4.1 million transactions, supporting frictionless tourist shopping and seller liquidity via same-day payouts. A 2025 directive will force all licensed wallets onto DuitNow by mid-2026, yet wallet proliferation, 3.2 active accounts per user, creates brand-loyalty challenges.
Live-Stream and Social-Commerce (TikTok Shop) GMV Surge
The two-month suspension of TikTok Shop in 2024 erased around USD 200 million in monthly GMV, proving both its scale and regulatory vulnerability. After local registration, TikTok Shop recaptured Gen Z buyers, and live-stream formats now generate up to 22% of platform GMV. Brands are reallocating budgets from static ads to interactive sessions that convert three-to-five times faster, but stricter content moderation raises compliance costs that favor incumbents with deep resources.
Restraints Impact Analysis*
| Restraint | (~) % Impact on CAGR Forecast | Geographic Relevance | Impact Timeline |
|---|---|---|---|
| Rising Cyber-Fraud and Data-Breach Incidents Eroding Trust | -1.6% | National, higher in urban centers | Short term (≤ 2 years) |
| High Last-Mile Cost to East Malaysia and Remote Islands | -0.8% | Sabah, Sarawak, Labuan, islands | Long term (≥ 4 years) |
| Escalating CAC From Urban Market Saturation | -1.1% | Klang Valley, Penang, Johor Bahru | Medium term (2-4 years) |
| Emerging Data-Localisation and Cross-Border Compliance Risk | -0.7% | National, ASEAN trade | Medium term (2-4 years) |
| Source: Mordor Intelligence | |||
Rising Cyber-Fraud and Data-Breach Incidents Eroding Trust
The communications regulator logged over 70,000 online-scam cases in 2024, costing consumers more than MYR 1.8 billion (USD 420 million).[4]Malaysian Communications and Multimedia Commission, “Cyber Security Incident Report 2024,” MCMC.GOV.MY High-profile telco breaches heightened fears around credential theft, pushing cart-abandonment to 68% in 2025. Two-factor authentication and biometrics reduce fraud but add 18 seconds to mobile checkout, straining user patience.
Escalating CAC From Urban Market Saturation
Urban penetration already exceeds 85% in the Klang Valley, Penang, and Johor Bahru, forcing platforms to spend more on cash-backs, free shipping, and influencer fees to capture incremental users. Customer acquisition cost (CAC) for first-time buyers climbed 23% year on year in 2025, eroding contribution margins even as average order values plateaued. Promotional intensity peaked during peak-sale events when Shopee, Lazada, and TikTok Shop collectively offered more than MYR 150 million (USD 35 million) in vouchers in a single week, yet traffic gains proved short-lived. Rising digital-ad prices on Meta and Google further inflate CAC because social-commerce entrants compete for the same urban eyeballs. Platforms are responding by shifting budgets toward loyalty programs and in-app games that raise repeat-purchase frequency, but payback periods still stretch beyond 18 months for new city users. Unless rural onboarding accelerates, elevated CAC will keep pressuring profitability through at least 2028.
*Our forecasts treat driver/restraint impacts as directional, not additive. The impact forecasts reflect baseline growth, mix effects, and variable interactions.
Segment Analysis
By Business Model: B2B Digitization Accelerates as Procurement Shifts Online
Business-to-consumer transactions retained 80.89% of the Malaysia e-commerce market in 2025 on the back of subsidies and influencer-led discovery. The Malaysia e-commerce market size for B2B platforms is projected to grow at 15.63% CAGR to 2031 as mandatory e-invoicing drives enterprises toward API-ready procurement portals. Wholesale marketplaces such as Dropee and Ralali automate invoices, unlock bulk discounts, and shrink working-capital cycles by up to 18 days. Despite the momentum, B2B GMV remains clustered in Peninsular Malaysia because East Malaysian manufacturers still face prohibitive air-freight costs.
Consumer-facing platforms spent an estimated MYR 3.5 billion (USD 814 million) on shipping rebates and cashback in 2025, a tactic expected to moderate as investors demand profit. Fashion, electronics, and beauty comprised roughly 60% of B2C GMV, aided by live-stream tags that convert impulse interest at triple the rate of keyword search. B2B growth provides a new revenue pool, yet capturing it requires deeper logistics integrations and embedded financing tools.


By Device Type: Mobile Dominance Reinforced by 5G Rollout and App-First Strategies
Smartphones generated 72.67% of 2025 transactions, and this slice of the Malaysia e-commerce market size is forecast to climb with a 15.87% CAGR to 2031. Progressive web apps that load rapidly on 4G and in-app wallets that remember credentials keep friction low.
Desktop usage lingers among enterprise buyers and older shoppers but is declining 8% each year. Tablets and smart TVs remain niche; however, voice-assisted grocery purchasing is gaining popularity in family households. New privacy rules around device fingerprinting shift attribution toward persistent app logins, a clear advantage for mobile-centric ecosystems.
By Payment Method: BNPL Fastest Growth as Credit Access Widens
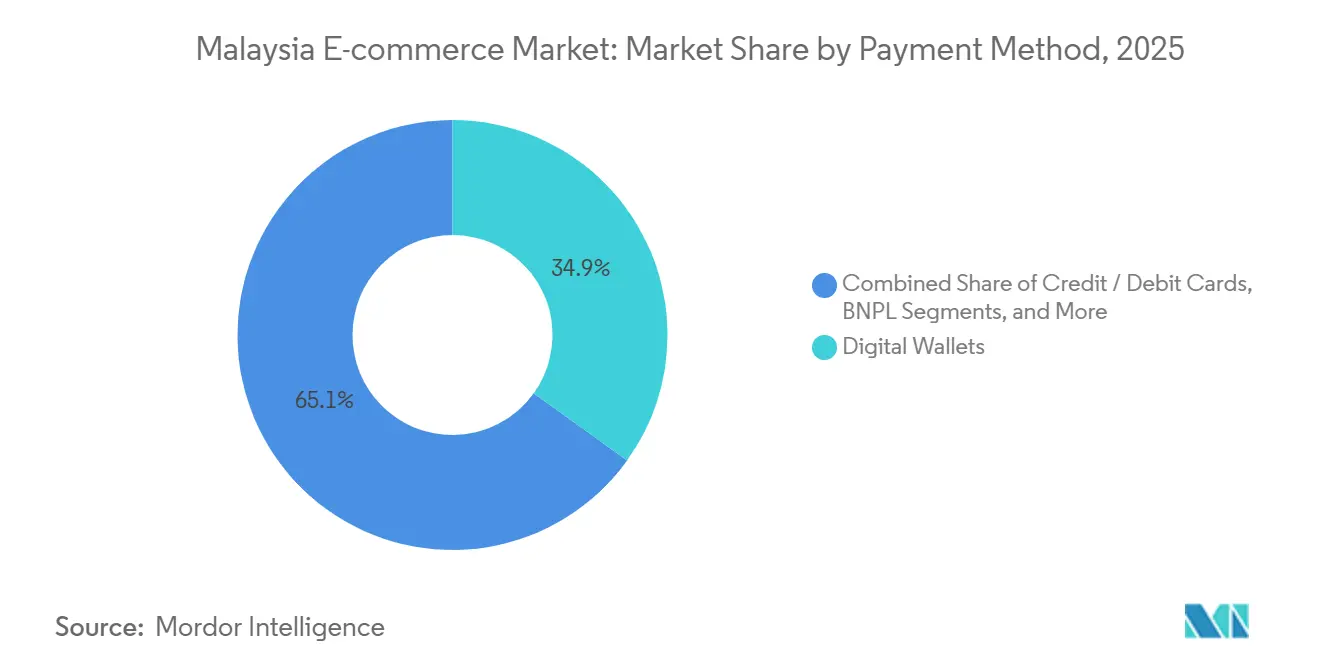
Digital wallets led with 34.92% share in 2025 as interoperable DuitNow QR wiped out checkout barriers. Buy-now-pay-later, the fastest rising slice of the Malaysia e-commerce market, is set to post 17.18% CAGR to 2031, fuelled by Gen Z’s appetite for installment plans on electronics and fashion.
Bank Negara Malaysia’s 2024 rules mandated affordability checks and delinquency reporting, raising compliance costs yet legitimizing the sector. Card payments still dominate cross-border orders but face merchant resistance due to 2% interchange fees. Cash on delivery continues to fade as e-invoicing demands traceable digital trails.

By B2C Product Category: Food and Beverages Fastest Growth on Quick-Commerce Momentum
Fashion and apparel captured 26.67% of 2025 revenue, benefiting from social try-ons and AI sizing that trim return rates. Food and beverages are poised to grow at 16.46% CAGR to 2031, the quickest in the Malaysia e-commerce market, thanks to GrabMart’s 30-minute delivery promise in major cities.
Consumer electronics enjoy strong brand partnerships and trade-in offers, while beauty gains from subscription replenishment models. Furniture, automotive parts, and pet supplies carve out smaller yet double-digit growth corridors as augmented-reality visualization and auto-reorder features mitigate past frictions.
Geography Analysis
Peninsular Malaysia accounted for roughly 75% of 2025 transactions as dense logistics hubs support same-day delivery and higher discretionary spend. The Malaysia e-commerce market continues to benefit from cross-border QR payments with Singapore, Thailand, and Indonesia that handled MYR 348.3 million (USD 81 million) in 2024.
East Malaysia, home to 5.8 million residents, generated close to 15% of volume but lags because last-mile costs inflate basket prices by up to 60%. The Malaysia e-commerce market share in rural Sabah and Sarawak will rise once the Pan Borneo Highway and Salam subsea cable narrow connectivity gaps, yet projects extend beyond 2028.
Digital-literacy drives and subsidies have already onboarded over a million small businesses, reducing the urban-rural divide from 5.2 million to 3.8 million unconnected adults between 2024 and 2026. Nevertheless, average order value outside the Klang Valley remains 30% lower, reflecting lower disposable incomes and a heavier focus on essentials.
Regulatory Landscape
Malaysia's e-commerce operating environment is being tightened through platform-accountability proposals and digital safety enforcement, alongside continuing pro-digitalization programs. In June 2026, the Ministry of Domestic Trade and Cost of Living (KPDN) said it was drafting new legislation to close regulatory gaps and increase e-commerce platform accountability, including areas linked to foreign cross-border sellers. This follows the July 2025 rollout of mandatory e-invoicing for large companies, which pushed merchants and enterprise platforms toward compliant, API-enabled transaction records.
Oversight affecting digital commerce also spans communications and digital-economy institutions. The Malaysian Communications and Multimedia Commission (MCMC) has been tracking online scam incidents (over 70,000 cases in 2024 in the report context) and, in July 2026, finalized subsidiary regulations under the Online Safety Act 2025 (Act 866). These rules include requirements related to private messaging features, raising compliance demands for social-commerce and marketplace communication tools. In parallel, Malaysia's regional posture includes an ASEAN-endorsed Malaysia-led framework on cross-border cloud computing (February 2026), supporting more standardized data-governance approaches for cloud-dependent marketplaces and payment integrations.
Value Chain Analysis
Malaysia's e-commerce value chain starts with brand owners and a large SME seller base onboarding through national digitalization programs, then moves through marketplace enablers (storefronts, search and recommendation, advertising, customer service), payments, fulfillment, and after-sales. Payments are anchored by bank transfers, cards, and e-wallets, with interoperable DuitNow QR expanding merchant acceptance and helping reduce checkout friction. Compliance requirements, including e-invoicing implemented for large companies in July 2025, are increasing demand for platforms and B2B procurement portals that can generate auditable transaction and invoice trails.
Fulfillment and delivery remain the main physical constraint, especially for East Malaysia, where high last-mile and inter-island costs raise basket prices and complicate returns. Government incentives such as the Smart Logistics Complex (SLC) program (2025-2027) are designed to accelerate Industry 4.0 adoption in warehousing and distribution (AI, IoT, robotics). Private investment is also adding capacity and automation in Peninsular hubs, including YCH Group's RM500 million Supply Chain City Malaysia project in Bandar Bukit Raja (May 2025), while corporate upgrades in 2026 (for example, AI-enabled warehousing initiatives reported for DHL Malaysia) show a shift toward more data-driven inventory handling. Reverse logistics, particularly affordable return flows from East Malaysia and quality-controlled recommerce, remains an underdeveloped link where specialist partners can integrate with marketplaces and 3PL networks.
Competitive Landscape
Shopee controlled about 60% of the Malaysia e-commerce market in 2025, powered by Sea Limited’s USD 2.7 billion Q3 2024 e-commerce revenue, up 27% year on year.[5]Sea Limited, “Third Quarter 2024 Financial Results,” INVESTORS.SEA.COM Lazada retained near-30% share after Alibaba’s divestment to Central Group, pivoting toward profitability with selective fulfillment-center closures.
TikTok Shop’s December 2024 re-entry re-ignited live-stream commerce and pushed incumbents to raise marketing outlays despite flattening urban penetration. Regulatory compliance around content moderation and data privacy is becoming a moat: platforms with established legal and cyber-security teams can absorb rising overheads more easily than start-ups.
Vertical specialists, Zalora for fashion, Senheng for electronics, PG Mall for general merchandise, address product niches and halal-certified demand. White-space remains in reverse logistics, especially affordable returns from East Malaysia, and in B2B procurement where 1.15 million SMEs still rely on manual ordering. AI-driven personalization and dynamic pricing are table stakes as leading platforms process billions of data points daily to refine rankings and inventory forecasting.
Malaysia E-commerce Industry Leaders
Shopee (Sea Ltd)
Lazada Group (Alibaba)
Lelong.my
Zalora (Global Fashion Group)
GoShop (Astro GS Shop Sdn Bhd)
- *Disclaimer: Major Players sorted in no particular order

Market Opportunities and Future Outlook
Regulatory tightening around platform accountability and foreign cross-border sellers is creating room for compliance-oriented services that help marketplaces, merchants, and enablers operationalize KPDN-driven requirements, including seller verification workflows, fee transparency tooling, and integrated tax and e-invoicing capabilities. The policy direction is reinforced by the government's ongoing digital-economy agenda (for example, MD2030, launched in June 2026) and cross-border enablement initiatives referenced in Belanjawan 2026, which includes allocations for cross-border e-commerce development programs and digital acceleration grants that support adoption of advanced technologies.
Infrastructure build-out around cloud and data center capacity is expanding the technical ceiling for personalization, live commerce, fraud detection, and B2B procurement integrations that depend on low-latency compute and resilient connectivity. In April 2026, AirTrunk announced an additional RM12 billion investment for two new hyperscale data centers in Johor (JHB3 and JHB4). In May 2026, Equinix announced a new purpose-built IBX data center in Kuala Lumpur (KL2) with investment of over USD 190 million, supporting higher-throughput workloads for marketplaces and payments players. On the physical side, logistics modernization programs and large projects, including YCH Group's RM500 million Supply Chain City Malaysia and continued automation investments across warehousing, point to whitespace in smart fulfillment, cold-chain and quick-commerce support for food and beverages, and reverse logistics solutions that reduce East Malaysia return frictions while protecting unit economics.
Recent Industry Developments
- July 2026: Lazada joined Meta's Facebook Affiliate Partnerships programme across Southeast Asia, including Malaysia, enabling creators to tag products and earn commissions through affiliate-driven social shopping. The move deepens Lazada's social-commerce funnel beyond in-app discovery and pushes more structured creator monetization into Malaysia's online retail ecosystem.
- April 2026: ZALORA launched its official store on PGMall to broaden its reach with shoppers on a Malaysia-grown marketplace. The partnership expands authenticated fashion assortment availability across platforms and reflects a broader push toward trust and brand verification rather than only price-led acquisition.
- July 2025: Malaysia's mandatory e-invoicing system went live for large companies, accelerating enterprise adoption of platforms with built-in invoicing APIs. The compliance milestone strengthened demand for B2B procurement portals and seller tools that can automate invoice issuance, reconciliation, and audit-ready digital records.


Research Methodology Framework and Report Scope
Market Definition and Coverage
For this study, the market covers the value of goods and fee-based services purchased through internet-enabled websites or mobile apps, where the seller is registered in Malaysia and the transaction is placed online.
Scope exclusions: This sizing does not count pure peer-to-peer resale activity, online travel bookings, or streaming subscriptions.
Segmentation Overview
- By Business Model
- B2C
- B2B
- By Device Type (B2C)
- Smartphone / Mobile
- Desktop and Laptop
- Other Device Types
- By Payment Method (B2C)
- Credit / Debit Cards
- Digital Wallets
- Buy Now Pay Later (BNPL)
- Other Payment Methods
- By Product Category (B2C)
- Beauty and Personal Care
- Consumer Electronics
- Fashion and Apparel
- Food and Beverages
- Furniture and Home
- Toys, DIY and Media
- Other Product Categories
Data Sources, Market Sizing, and Validation
Desk Research
Desk work started with public statistics that show how fast online buying is expanding in Malaysia, and what the supporting infrastructure looks like. Sources such as the Department of Statistics Malaysia (digital economy and e-commerce releases), Bank Negara Malaysia payment indicators, Malaysian Communications and Multimedia Commission connectivity statistics, and Royal Malaysian Customs trade publications helped us set realistic guardrails for demand, payments, and cross-border activity.
We also reviewed company filings and investor presentations from listed retailers, logistics providers, and consumer internet firms that operate meaningful Malaysia businesses, along with relevant ministry and agency updates tied to digital economy programs. When revenue splits were not disclosed, we relied on a paid subscription for company financials and intelligence, and another for news and financials, to track expansions, policy changes, and major category pushes. These desk sources are not exhaustive, and many other references were used to collect data, validate assumptions, and clarify open points during the study.
Primary Interviews and Surveys
Primary interviews and surveys were used to pressure-test what we saw in public data, especially around category mix, cross-border selling, and take-rate and discounting behavior that can shift the market number. We spoke with a spread of marketplace operators, brand and retailer e-commerce teams, logistics and fulfillment leaders, and payment and enabling service providers, then rechecked assumptions with additional calls when numbers did not line up cleanly across sources.
Distribution of primary research fieldwork respondents
| Company type | Respondent position | Region |
|---|---|---|
| Top tier: 27% | CXOs: 15% | |
| Mid tier: 58% | Functional/Unit leaders: 30% | |
| Smaller Players: 15% | Managers: 55% |
Market-Sizing & Forecasting
Our core build used a top-down demand pool reconstruction, where national digital economy signals and e-commerce intensity were translated into online transaction value aligned to Malaysia-specific buying behavior. The totals were then corroborated with selective bottom-up checks, such as sampled category GMV and order volume multiplied by typical selling prices, along with channel checks on fulfillment volumes, so the result was not overly dependent on any single input.
Inputs that mattered in this market included online shopper penetration and purchase frequency, share of retail transacted online, cross-border share and currency conversion timing, average order value by major category, platform take-rate and promotion intensity, and logistics cost and delivery speed trends that influence conversion. When a bottom-up check had gaps (for example, smaller sellers without clear disclosures), we applied conservative ranges and only widened them when multiple interviewees pointed to the same direction. For forecasting, scenario analysis was used so we could reflect different paths for consumer demand, payments adoption, and logistics performance, and the final outlook was selected only after scenarios matched what industry respondents considered achievable.
Data Validation & Update Cycle
To validate the final outputs, we compared the modeled market totals against independent signals such as official e-commerce series, payments activity, trade indicators linked to cross-border parcels, and reported performance commentary from major ecosystem participants. Outliers were reviewed in a step-by-step way, first by checking unit math and timing, and then by re-contacting sources when an assumption still looked stretched.
Each report goes through multi-stage analyst review before sign-off, with variances documented so the model can be re-run consistently. The study is refreshed annually, and interim updates are triggered when material events occur, such as policy changes, major platform shifts, or macro moves that affect consumer spending. Before delivery, we perform a fresh pass of key inputs so clients receive the latest updated view.
Mordor Intelligence's Malaysia Ecommerce Market Size Measured Against Other Published Estimates
Published market values for Malaysia e-commerce do not always match, even when they are describing a similar growth story, because what gets counted can vary more than expected. Differences usually come from whether the estimate is GMV or revenue-like, how cross-border flows are treated, and whether non-retail digital purchases are included.
Online travel bookings and streaming subscriptions sit outside Mordor Intelligence's scope, which can pull the total down versus figures that roll the full digital economy GMV into one number. Other gaps often come from aggressive assumptions on average order value inflation, the handling of heavy discounting periods, and older currency conversion rates that are not refreshed when FX moves. We also saw some estimates blend peer-to-peer resale into commerce, which raises totals but does not track the same seller base or fulfillment patterns as registered online retail.
Benchmark comparison
| Source | Market Size | Gaps in Research Methodology |
|---|---|---|
| Mordor Intelligence | USD 10.62 B (2025) | |
| Industry Association A | USD 16.00 B (2024) | Often reported as GMV and may include adjacent digital categories, and the year base can reflect peak promotion cycles without normalizing discount-led price effects. |
| Trade Journal B | USD 20.00 B (2025) | Can blend marketplace GMV with peer-to-peer resale and use simplified FX timing, which makes the total sensitive to currency swings and non-registered seller activity. |
The spread in the table is mainly explained by scope and what the headline number represents, not by a disagreement that online buying is growing. By keeping the market tied to Malaysia-registered sellers and excluding adjacent digital spending buckets, the estimate stays traceable to shopper activity, pricing, and cross-border handling that can be checked and repeated.


Key Questions Answered in the Report
How large is the Malaysia e-commerce market in 2026?
It reached USD 12.18 billion in 2026 and is on track for USD 23.11 billion by 2031, reflecting a 13.67% CAGR.
Which segment is growing fastest within Malaysia's online retail space?
Food and beverages are poised for the quickest 16.46% CAGR through 2031, fueled by quick-commerce models that promise 30-minute delivery.
What drives the dominance of smartphones in online shopping?
82.4% 5G coverage and app-first designs pushed smartphones to 72.67% of 2025 transactions, and this share keeps rising with faster spectrum rollouts.
Why is buy-now-pay-later expanding so quickly?
BNPL solutions combine instant credit decisions with capped interest rates under new regulations, enabling 17.18% CAGR as Gen Z shoppers finance higher-ticket items.
What challenges curb growth in East Malaysia?
Air-freight premiums and sparse infrastructure inflate delivery costs by up to 60%, delaying parity with Peninsular shopping experiences until highway and subsea-cable projects finish after 2028.
Page last updated on:


