| Study Period | 2018 - 2030 |
| Base Year For Estimation | 2024 |
| Forecast Data Period | 2025 - 2030 |
| Market Volume (2025) | 1.26 Thousand MW |
| Market Volume (2030) | 2.53 Thousand MW |
| CAGR | 15.01 % |
| Market Concentration | Medium |
Major Players*Disclaimer: Major Players sorted in no particular order |

Malaysia Data Center Market Analysis
The Malaysia Data Center Market size is estimated at 1.26 thousand MW in 2025, and is expected to reach 2.53 thousand MW by 2030, growing at a CAGR of 15.01%. Further, the market is expected to generate colocation revenue of USD 710 Million in 2025 and is projected to reach USD 1,873.2 Million by 2030, growing at a CAGR of 21.41% during the forecast period (2025-2030).
The Malaysian data center landscape is experiencing significant transformation through infrastructure modernization and certification upgrades. As of 2022, the country housed 42 Tier 3 data center facilities, demonstrating the industry's commitment to maintaining high operational standards and reliability. The emphasis on tier certification reflects the growing sophistication of Malaysia's digital infrastructure, with data center infrastructure being designed to ensure concurrent maintainability and minimal disruption during maintenance activities. This trend is further evidenced by the ongoing construction of 12 new data center facilities across the country, indicating robust expansion of the infrastructure backbone.
Geographic distribution of data centers in Malaysia shows strategic concentration in key digital corridors. Data center Cyberjaya has emerged as the premier data center hub, hosting 70.6% of the country's Tier 3 certified facilities, leveraging its position within the Multimedia Super Corridor. The development of new digital districts, such as the Johor Digital District, is creating additional technology ecosystems that enable collaboration between multinational companies and startups. These digital corridors are being supported by comprehensive infrastructure development, including advanced connectivity solutions and purpose-built facilities.
Industry consolidation and strategic partnerships are reshaping the competitive landscape. A notable development in late 2022 was the merger approval between Malaysian telcos Celcom and DiGi, which is set to create one of the country's largest carriers with over 20 million subscribers. This consolidation trend is complemented by increasing collaboration between local and international players, as evidenced by partnerships between Malaysian authorities and global cloud providers to accelerate public sector cloud adoption. The Public Sector Data Center (PDSA) has already demonstrated significant progress, having installed over 1,000 servers supporting 120 government agencies.
Sustainability initiatives and government support are driving the next phase of market development. The Malaysian government has implemented attractive incentives, including the Green Investment Tax Allowance (GITA) offering 100% of qualifying capital expenditure for three years, offset against 70% of statutory income. These initiatives are encouraging the development of green data centers and sustainable infrastructure. The data center industry is responding with innovative approaches to energy efficiency, with several new facilities incorporating renewable energy solutions and advanced cooling systems to minimize environmental impact while maintaining operational excellence.
Malaysia Data Center Market Trends
Growth in digital consumers boost the data center demand in country
- The total number of smartphone users in the country was 29.46 million in 2022. This is expected to witness a CAGR of 1.43% during the forecast period, reaching 32.54 million by 2029.
- According to Google's research findings regarding mobile searches in Malaysia, a share as high as 52% of the population use mobile phones to search, 36% use their computers or laptops, and 12% use tablets. Thus, a staggering 64% of the searches performed in Malaysia are through mobile devices. Due to the COVID-19 pandemic and the strict enforcement of MCO, which included remaining indoors at all times, internet traffic in Malaysia recorded a 23% increase in the first week of March 2020. While the second week saw an 8.6% increase, complaints of slow internet speeds also began emerging. This could be due to the growing number of active internet users.
- Malaysia added three million new digital consumers between the pandemic's start in 2020 and the first quarter of 2021. Considering that 55.9% of e-commerce transactions in Malaysia are completed on a mobile device, the growing smartphone penetration means more people will opt to shop online over the coming years, according to the Digital 2022-Malaysia report.

Understand The Key Trends Shaping This Market
Download PDF
Expansion of 5G and rising mergers between companies such as Malaysian telcos Celcom and DiGi increase data center facilities in Malaysia
- Major telecommunication operators in Malaysia include Celcom, Digi, Maxis, U Mobile, Telekom Malaysia, and Time dotCom. In terms of actual geographical mobile network coverage in Malaysia, Celcom is ranked first, with 9.2 out of 10 points, followed by Digi and Maxis, which have 8.6 points each, followed by U Mobile with 7.7 points and Unifi with 7.0 points.
- Ericsson is at the forefront of 5G services in Malaysia, where it is working closely with Digital Nasional Berhad to deliver a world-class 5G network for Malaysia. 5G will serve as the catalyst for Malaysia’s digital transformation and provide the platform for IR4.0. Currently, the government has identified 700MHz, 3.5GHz, and 26/28GHz as the pioneer spectrum bands for the roll-out of 5G in Malaysia.
- Malaysian telcos Celcom and DiGi have also approved a merger agreement. Once the two companies are fully merged, the new entity will be the largest carrier in Malaysia, with over 20 million subscribers. The company also said that the implementation of 5G technology would have a positive impact of MYR 150 billion on the country’s GDP and create 750,000 jobs.

OTHER KEY INDUSTRY TRENDS COVERED IN THE REPORT
- Rising smartphones use coupled with discounted internet services would boost the data centers in the country
- Malaysian government initiative such as Jendela Program drives data center market
- Phasing out of copper networks by 2023 and expansion of fiber optic high speed internet cables would boost the market
Segment Analysis: By Hotspot
Rest of Malaysia Segment in Malaysian Data Center Market
The Rest of Malaysia segment, which includes key regions like Johor Bahru and George Town, dominates the Malaysian data center market with approximately 56% data center market share in 2024, representing an IT load capacity of 402.09 MW. This segment is also experiencing the most rapid growth, projected to expand at around 25% CAGR from 2024 to 2029. The Johor Digital District has emerged as a dynamic tech ecosystem spread between Johor Bahru and Iskandar Puteri, enabling multinational companies to work alongside startups. The majority of startups are recording significant growth in Johor Bahru, positioning it as a major upcoming hotspot likely to compete with the Cyberjaya-Kuala Lumpur region. George Town is evolving as a major digital transformation hub, with the government's creative digital district (CD Square) initiative aimed at attracting digital companies and creating high-income jobs in the technology sector.
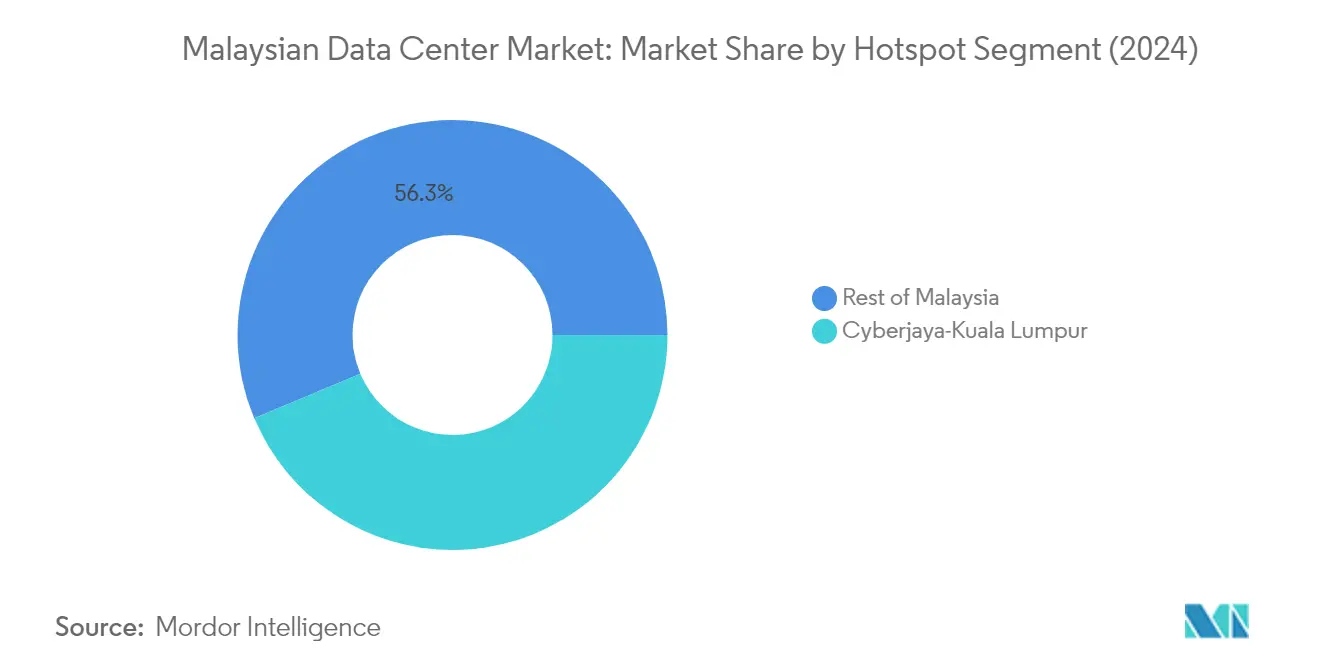
Cyberjaya-Kuala Lumpur Segment in Malaysian Data Center Market
The Cyberjaya-Kuala Lumpur hotspot represents a significant portion of Malaysia's data center market, holding approximately 44% data center market share in 2024. This region is primarily considered under the Multimedia Super Corridor, which has been revamped as Malaysia Digital, serving as the new national strategic initiative to encourage and attract companies, talents, and investments to Malaysia's digital economy. Cyberjaya stands out as a major city, with most of its data centers offering colocation facility solutions. The city's vast land availability makes it an ideal location for industry players. Meanwhile, Kuala Lumpur's growth transformation strategy involves pivoting toward next-generation digital industries, with prominent multinational corporations relocating their Asia-Pacific 'high-value, high-impact' central operating models to the city, leveraging Industry 4.0 technologies and the ICT talent pool.
Segment Analysis: By Data Center Size
Mega Segment in Malaysia Data Center Market
The mega segment dominates the Malaysia data center market, commanding approximately 64% of the total IT load capacity in 2024. With a substantial capacity of around 453 MW, mega data centers have established themselves as the cornerstone of Malaysia's digital infrastructure. Currently, there are four mega data centers operating in the country, with several providers like CSF Group, Bridge Data Center, and GDS Holdings Ltd constructing upcoming facilities. The segment's growth is significantly supported by the increasing adoption of renewable energy, with renewables currently contributing about 18% to Malaysia's energy mix, predominantly through hydropower technologies which account for 86% of renewable capacity. The mega data center construction developments are witnessing substantial investments, particularly in the Cyberjaya-Kuala Lumpur and Johor Bahru regions, driven by the rising demand for hyperscale facilities and the government's supportive policies for large-scale digital infrastructure.
Growth Trajectory of Mega Data Centers in Malaysia
The mega data center segment is experiencing remarkable growth and is projected to maintain its momentum with approximately a 24% growth rate from 2024 to 2029. This exceptional growth is primarily driven by the increasing demand for hyperscale facilities and the adoption of advanced technologies. Major industry players are making significant investments in this segment, with several new facilities under construction. For instance, Yondr Group has announced plans for a 200 MW hyperscale campus to be developed on 72.8 acres of land in Malaysia. The segment's growth is further supported by the country's favorable investment climate, including tax benefits and incentives for large-scale data center developments, particularly in free trade zones. The increasing adoption of cloud services, digital transformation initiatives, and the growing need for high-capacity data processing capabilities are also contributing to the segment's rapid expansion.
Remaining Segments in Data Center Size Market
The Malaysian data center market encompasses several other segments, including large, medium, massive, and small data centers, each serving specific market needs. The large segment maintains a significant presence, particularly in the Cyberjaya-Kuala Lumpur region, catering to enterprises requiring substantial but not hyperscale infrastructure. Medium-sized facilities primarily serve regional businesses and government organizations, offering balanced capacity and cost-effectiveness. The massive segment focuses on serving specific industry verticals with specialized requirements, while small data centers cater to local businesses and edge computing needs. These segments complement each other, creating a diverse ecosystem that supports various business requirements and technological needs across different scales of operation.
Segment Analysis: By Tier Type
Tier 3 Segment in Malaysia Data Center Market
The Tier 3 data center segment dominates the Malaysian data center market, accounting for approximately 81% of the total IT load capacity in 2024. This significant market share is driven by the segment's ability to provide concurrent maintainability, allowing for any planned maintenance activity of power and cooling systems without disrupting computer hardware operations. Most telecom operators prefer establishing Tier 3 data centers as they prevent uneven disturbances and provide enhanced reliability. The segment's prominence is further strengthened by its widespread adoption in Cyberjaya, which hosts the maximum number of Tier 3 data centers with a 70.6% share, followed by strategic locations in Kuala Lumpur, Johor Bahru, and George Town. Major industry players like VADS BERHAD, Open DC Sdn Bhd, and NTT Ltd have established multiple Tier 3 certified facilities across these locations, contributing to the segment's market leadership.
Tier 1 & 2 Segment in Malaysia Data Center Market
The Tier 1 & 2 segment is emerging as the fastest-growing segment in the Malaysian data center market, projected to expand at approximately 23% CAGR from 2024 to 2029. This growth trajectory is particularly noteworthy given the segment's relatively smaller base, indicating increasing demand for basic data center infrastructure among certain business segments. The segment's growth is supported by its cost-effectiveness and suitability for organizations with less critical data storage needs. Despite the market's general preference for higher tier facilities, Tier 1 & 2 data centers are finding their niche among smaller enterprises and specific applications where basic infrastructure suffices. The segment's expansion is also facilitated by the Malaysian government's digital transformation initiatives and support for diverse data center solutions across different tier levels.
Remaining Segments in Tier Type Segmentation
The Tier 4 data center segment represents the highest level of data center certification, offering the most robust infrastructure with complete fault tolerance and redundancy. Currently, only a select few companies, including TelcoHubeXchange and Regal Orion Sdn Bhd, operate Tier 4 certified facilities in Malaysia. These facilities cater to organizations with mission-critical operations requiring the highest levels of reliability and uptime. While the segment maintains a smaller market share compared to Tier 3, it plays a crucial role in serving enterprises with zero-tolerance for downtime, particularly in the financial services and critical infrastructure sectors. The segment's development is characterized by sophisticated infrastructure investments and stringent certification requirements, making it a specialized but essential component of Malaysia's data center ecosystem.
Segment Analysis: By Absorption
Malaysia Data Center Industry Overview
Top Companies in Malaysia Data Center Market
The data center market features a mix of global and regional players focusing on expanding their footprint through strategic initiatives. Companies are increasingly investing in renewable energy solutions, particularly solar power, to develop sustainable data center facilities. There is a strong emphasis on achieving industry certifications and implementing advanced data center security measures to meet evolving customer demands. Operators are actively pursuing partnerships with technology providers and telecom companies to enhance their data center services and network connectivity. The industry is witnessing significant investments in upgrading existing facilities with modern cooling systems and power infrastructure while also developing new state-of-the-art facilities. Companies are strategically positioning their data center facilities near business hubs and establishing interconnection points to create robust digital ecosystems.
Market Dominated by Regional Infrastructure Leaders
The Malaysian data center market exhibits a moderate level of consolidation with a mix of established telecom operators, specialized data center companies in Malaysia, and global technology companies. Local telecommunications giants leverage their existing infrastructure and customer relationships to maintain strong market positions, while international players bring global expertise and advanced technologies. The market is characterized by strategic partnerships between local and international players to combine regional knowledge with global best practices. Joint ventures and collaborations are becoming increasingly common as companies seek to share resources and expertise while managing investment risks.
The market is witnessing increased participation from real estate investment trusts and infrastructure funds, indicating growing institutional interest in the sector. Companies are actively pursuing mergers and acquisitions to expand their geographic presence and technical capabilities. The competitive landscape is evolving with new entrants from adjacent industries, particularly cloud service providers and digital infrastructure companies, who are establishing their presence through greenfield investments and strategic partnerships. Regional players are strengthening their positions by focusing on specific market segments and developing specialized data center solutions for different industries.
Innovation and Sustainability Drive Future Growth
Success in the market increasingly depends on operators' ability to provide sustainable, energy-efficient solutions while maintaining high reliability and security standards. Companies need to focus on developing smart infrastructure capabilities and implementing advanced monitoring systems to optimize operational efficiency. Building strong relationships with cloud service providers and establishing robust connectivity ecosystems will be crucial for maintaining a competitive advantage. Operators must also invest in skilled workforce development and maintain strong local partnerships to navigate regulatory requirements and ensure smooth operations.
Market players need to differentiate themselves through specialized services and industry-specific solutions, particularly for sectors like banking, e-commerce, and telecommunications. The ability to provide flexible scaling options and hybrid infrastructure solutions will become increasingly important as customer needs evolve. Companies must also focus on developing edge computing capabilities and establishing a presence in emerging business hubs to capture new opportunities. Success will depend on maintaining strong cybersecurity measures and compliance with evolving data protection regulations while also ensuring cost-effective operations through technological innovation and data center management optimization.
Malaysia Data Center Market Leaders
-
Bridge Data Center (Chindata Group)
-
Keppel DC REIT Management Pte. Ltd
-
NTT Ltd
-
VADS BERHAD (TM One)
-
YTL Data Center Holdings Pte Ltd (YTL Power International Berhad)
- *Disclaimer: Major Players sorted in no particular order

Need More Details on Market Players and Competiters?
Download PDF
Malaysia Data Center Market News
- October 2022: Zenlayer entered a joint venture with Megaport to strengthen and expand its presence globally. The partnership is aimed at providing enhanced services such as improved network connectivity, real-time provisioning, and on demand private connectivity for its clients around the globe.
- September 2022: NTT Ltd announced the commencement of construction of its sixth data center in Cyberjaya. It plans to invest over USD 50 million in the sixth data center called Cyberjaya 6 (CBJ6). CBJ6 and CBJ5 have a total facility load of 22 MW, spanning a combined 200,000 sq. ft.
- April 2022: Malaysian data center firm Open DC announced a partnership with the Malaysian government to build a data center in the north of the country. To emulate the existing Internet Exchange (IX) along the Malaysia-Singapore border, the company aims to enhance internet development at the northern border of Malaysia.
Free With This Report
We provide a complimentary and exhaustive set of data points on the country and regional level metrics that present the fundamental structure of the industry. Presented in the form of 50+ free charts, the sections cover difficult to find data on various countries on smartphone users, data traffic per smartphone, mobile and broadband data speed, fiber connectivity network, and submarine cables.


Malaysia Data Center Market Report - Table of Contents
1. EXECUTIVE SUMMARY & KEY FINDINGS
2. REPORT OFFERS
3. INTRODUCTION
- 3.1 Study Assumptions & Market Definition
- 3.2 Scope of the Study
- 3.3 Research Methodology
4. MARKET OUTLOOK
- 4.1 It Load Capacity
- 4.2 Raised Floor Space
- 4.3 Colocation Revenue
- 4.4 Installed Racks
- 4.5 Rack Space Utilization
- 4.6 Submarine Cable
5. Key Industry Trends
- 5.1 Smartphone Users
- 5.2 Data Traffic Per Smartphone
- 5.3 Mobile Data Speed
- 5.4 Broadband Data Speed
- 5.5 Fiber Connectivity Network
-
5.6 Regulatory Framework
- 5.6.1 Malaysia
- 5.7 Value Chain & Distribution Channel Analysis
6. MARKET SEGMENTATION (INCLUDES MARKET SIZE IN VOLUME, FORECASTS UP TO 2030 AND ANALYSIS OF GROWTH PROSPECTS)
-
6.1 Hotspot
- 6.1.1 Cyberjaya-Kuala Lumpur
- 6.1.2 Johor Bahru
- 6.1.3 Rest of Malaysia
-
6.2 Data Center Size
- 6.2.1 Large
- 6.2.2 Massive
- 6.2.3 Medium
- 6.2.4 Mega
- 6.2.5 Small
-
6.3 Tier Type
- 6.3.1 Tier 1 and 2
- 6.3.2 Tier 3
- 6.3.3 Tier 4
-
6.4 Absorption
- 6.4.1 Non-Utilized
- 6.4.2 Utilized
- 6.4.2.1 By Colocation Type
- 6.4.2.1.1 Hyperscale
- 6.4.2.1.2 Retail
- 6.4.2.1.3 Wholesale
- 6.4.2.2 By End User
- 6.4.2.2.1 BFSI
- 6.4.2.2.2 Cloud
- 6.4.2.2.3 E-Commerce
- 6.4.2.2.4 Government
- 6.4.2.2.5 Manufacturing
- 6.4.2.2.6 Media & Entertainment
- 6.4.2.2.7 Telecom
- 6.4.2.2.8 Other End User
7. COMPETITIVE LANDSCAPE
- 7.1 Market Share Analysis
- 7.2 Company Landscape
-
7.3 Company Profiles (includes Global Level Overview, Market Level Overview, Core Business Segments, Financials, Headcount, Key Information, Market Rank, Market Share, Products and Services, and Analysis of Recent Developments).
- 7.3.1 AIMS DATA CENTRE SDN BHD
- 7.3.2 Bridge Data Center (Chindata Group)
- 7.3.3 Csf Group
- 7.3.4 HDC Data Centre SDN BHD (HDC)
- 7.3.5 IPServerOne
- 7.3.6 Keppel DC REIT Management Pte. Ltd
- 7.3.7 NTT Ltd
- 7.3.8 Open DC SDN BHD
- 7.3.9 TelcoHubeXchange
- 7.3.10 VADS BERHAD (TM One)
- 7.3.11 YTL Data Center Holdings Pte Ltd (YTL Power International Berhad)
- 7.3.12 Zenlayer Inc.
- 7.4 LIST OF COMPANIES STUDIED
8. KEY STRATEGIC QUESTIONS FOR DATA CENTER CEOS
9. APPENDIX
-
9.1 Global Overview
- 9.1.1 Overview
- 9.1.2 Porter’s Five Forces Framework
- 9.1.3 Global Value Chain Analysis
- 9.1.4 Global Market Size and DROs
- 9.2 Sources & References
- 9.3 List of Tables & Figures
- 9.4 Primary Insights
- 9.5 Data Pack
- 9.6 Glossary of Terms
You Can Purchase Parts Of This Report. Check Out Prices For Specific Sections
Get Price Break-up Now
List of Tables & Figures
- Figure 1:
- VOLUME OF IT LOAD CAPACITY, MW, MALAYSIA, 2018 - 2030
- Figure 2:
- VOLUME OF RAISED FLOOR AREA, SQ.FT. ('000), MALAYSIA, 2018 - 2030
- Figure 3:
- VALUE OF COLOCATION REVENUE, USD MILLION, MALAYSIA, 2018 - 2030
- Figure 4:
- VOLUME OF INSTALLED RACKS, NUMBER, MALAYSIA, 2018 - 2030
- Figure 5:
- RACK SPACE UTILIZATION, %, MALAYSIA, 2018 - 2030
- Figure 6:
- COUNT OF SMARTPHONE USERS, IN MILLION, MALAYSIA, 2018 - 2030
- Figure 7:
- DATA TRAFFIC PER SMARTPHONE, GB, MALAYSIA, 2018 - 2030
- Figure 8:
- AVERAGE MOBILE DATA SPEED, MBPS, MALAYSIA, 2018 - 2030
- Figure 9:
- AVERAGE BROADBAND SPEED, MBPS, MALAYSIA, 2018 - 2030
- Figure 10:
- LENGTH OF FIBER CONNECTIVITY NETWORK, KILOMETER, MALAYSIA, 2018 - 2030
- Figure 11:
- VOLUME OF IT LOAD CAPACITY, MW, MALAYSIA, 2018 - 2030
- Figure 12:
- VOLUME OF HOTSPOT, MW, MALAYSIA, 2018 - 2030
- Figure 13:
- VOLUME SHARE OF HOTSPOT, %, MALAYSIA, 2018 - 2030
- Figure 14:
- VOLUME SIZE OF CYBERJAYA-KUALA LUMPUR, MW, MALAYSIA, 2018 - 2030
- Figure 15:
- VOLUME SHARE OF CYBERJAYA-KUALA LUMPUR, MW, HOTSPOT, %, MALAYSIA, 2018 - 2030
- Figure 16:
- VOLUME SIZE OF JOHOR BAHRU, MW, MALAYSIA, 2018 - 2030
- Figure 17:
- VOLUME SHARE OF JOHOR BAHRU, MW, HOTSPOT, %, MALAYSIA, 2018 - 2030
- Figure 18:
- VOLUME SIZE OF REST OF MALAYSIA, MW, MALAYSIA, 2018 - 2030
- Figure 19:
- VOLUME SHARE OF REST OF MALAYSIA, MW, HOTSPOT, %, MALAYSIA, 2018 - 2030
- Figure 20:
- VOLUME OF DATA CENTER SIZE, MW, MALAYSIA, 2018 - 2030
- Figure 21:
- VOLUME SHARE OF DATA CENTER SIZE, %, MALAYSIA, 2018 - 2030
- Figure 22:
- VOLUME SIZE OF LARGE, MW, MALAYSIA, 2018 - 2030
- Figure 23:
- VOLUME SIZE OF MASSIVE, MW, MALAYSIA, 2018 - 2030
- Figure 24:
- VOLUME SIZE OF MEDIUM, MW, MALAYSIA, 2018 - 2030
- Figure 25:
- VOLUME SIZE OF MEGA, MW, MALAYSIA, 2018 - 2030
- Figure 26:
- VOLUME SIZE OF SMALL, MW, MALAYSIA, 2018 - 2030
- Figure 27:
- VOLUME OF TIER TYPE, MW, MALAYSIA, 2018 - 2030
- Figure 28:
- VOLUME SHARE OF TIER TYPE, %, MALAYSIA, 2018 - 2030
- Figure 29:
- VOLUME SIZE OF TIER 1 AND 2, MW, MALAYSIA, 2018 - 2030
- Figure 30:
- VOLUME SIZE OF TIER 3, MW, MALAYSIA, 2018 - 2030
- Figure 31:
- VOLUME SIZE OF TIER 4, MW, MALAYSIA, 2018 - 2030
- Figure 32:
- VOLUME OF ABSORPTION, MW, MALAYSIA, 2018 - 2030
- Figure 33:
- VOLUME SHARE OF ABSORPTION, %, MALAYSIA, 2018 - 2030
- Figure 34:
- VOLUME SIZE OF NON-UTILIZED, MW, MALAYSIA, 2018 - 2030
- Figure 35:
- VOLUME OF COLOCATION TYPE, MW, MALAYSIA, 2018 - 2030
- Figure 36:
- VOLUME SHARE OF COLOCATION TYPE, %, MALAYSIA, 2018 - 2030
- Figure 37:
- VOLUME SIZE OF HYPERSCALE, MW, MALAYSIA, 2018 - 2030
- Figure 38:
- VOLUME SIZE OF RETAIL, MW, MALAYSIA, 2018 - 2030
- Figure 39:
- VOLUME SIZE OF WHOLESALE, MW, MALAYSIA, 2018 - 2030
- Figure 40:
- VOLUME OF END USER, MW, MALAYSIA, 2018 - 2030
- Figure 41:
- VOLUME SHARE OF END USER, %, MALAYSIA, 2018 - 2030
- Figure 42:
- VOLUME SIZE OF BFSI, MW, MALAYSIA, 2018 - 2030
- Figure 43:
- VOLUME SIZE OF CLOUD, MW, MALAYSIA, 2018 - 2030
- Figure 44:
- VOLUME SIZE OF E-COMMERCE, MW, MALAYSIA, 2018 - 2030
- Figure 45:
- VOLUME SIZE OF GOVERNMENT, MW, MALAYSIA, 2018 - 2030
- Figure 46:
- VOLUME SIZE OF MANUFACTURING, MW, MALAYSIA, 2018 - 2030
- Figure 47:
- VOLUME SIZE OF MEDIA & ENTERTAINMENT, MW, MALAYSIA, 2018 - 2030
- Figure 48:
- VOLUME SIZE OF TELECOM, MW, MALAYSIA, 2018 - 2030
- Figure 49:
- VOLUME SIZE OF OTHER END USER, MW, MALAYSIA, 2018 - 2030
- Figure 50:
- VOLUME SHARE OF MAJOR PLAYERS, %, MALAYSIA
Malaysia Data Center Industry Segmentation
Cyberjaya-Kuala Lumpur, Johor Bahru are covered as segments by Hotspot. Large, Massive, Medium, Mega, Small are covered as segments by Data Center Size. Tier 1 and 2, Tier 3, Tier 4 are covered as segments by Tier Type. Non-Utilized, Utilized are covered as segments by Absorption.| Hotspot | Cyberjaya-Kuala Lumpur | |||
| Johor Bahru | ||||
| Rest of Malaysia | ||||
| Data Center Size | Large | |||
| Massive | ||||
| Medium | ||||
| Mega | ||||
| Small | ||||
| Tier Type | Tier 1 and 2 | |||
| Tier 3 | ||||
| Tier 4 | ||||
| Absorption | Non-Utilized | |||
| Utilized | By Colocation Type | Hyperscale | ||
| Retail | ||||
| Wholesale | ||||
| By End User | BFSI | |||
| Cloud | ||||
| E-Commerce | ||||
| Government | ||||
| Manufacturing | ||||
| Media & Entertainment | ||||
| Telecom | ||||
| Other End User | ||||
Need A Different Region or Segment?
Customize Now
Market Definition
- IT LOAD CAPACITY - The IT load capacity or installed capacity, refers to the amount of energy consumed by servers and network equipments placed in a rack installed. It is measured in megawatt (MW).
- ABSORPTION RATE - It denotes the extend to which the data center capacity has been leased out. For instance, a 100 MW DC has leased out 75 MW, then absorption rate would be 75%. It is also referred as utilization rate and leased-out capacity.
- RAISED FLOOR SPACE - It is an elevated space build over the floor. This gap between the original floor and the elevated floor is used to accommodate wiring, cooling, and other data center equipment. This arrangement assist in having proper wiring and cooling infrastructure. It is measured in square feet (ft^2).
- DATA CENTER SIZE - Data Center Size is segmented based on the raised floor space allocated to the data center facilities. Mega DC - # of Racks must be more than 9000 or RFS (raised floor space) must be more than 225001 Sq. ft; Massive DC - # of Racks must be in between 9000 and 3001 or RFS must be in between 225000 Sq. ft and 75001 Sq. ft; Large DC - # of Racks must be in between 3000 and 801 or RFS must be in between 75000 Sq. ft and 20001 Sq. ft; Medium DC # of Racks must be in between 800 and 201 or RFS must be in between 20000 Sq. ft and 5001 Sq. ft; Small DC - # of Racks must be less than 200 or RFS must be less than 5000 Sq. ft.
- TIER TYPE - According to Uptime Institute the data centers are classified into four tiers based on the proficiencies of redundant equipment of the data center infrastructure. In this segment the data center are segmented as Tier 1,Tier 2, Tier 3 and Tier 4.
- COLOCATION TYPE - The segment is segregated into 3 categories namely Retail, Wholesale and Hyperscale Colocation service. The categorization is done based on the amount of IT load leased out to potential customers. Retail colocation service has leased capacity less than 250 kW; Wholesale colocation services has leased capacity between 251 kW and 4 MW and Hyperscale colocation services has leased capacity more than 4 MW.
- END CONSUMERS - The Data Center Market operates on a B2B basis. BFSI, Government, Cloud Operators, Media and Entertainment, E-Commerce, Telecom and Manufacturing are the major end-consumers in the market studied. The scope only includes colocation service operators catering to the increasing digitalization of the end-user industries.
| Keyword | Definition |
|---|---|
| Rack Unit | Generally referred as U or RU, it is the unit of measurement for the server unit housed in the racks in the data center. 1U is equal to 1.75 inches. |
| Rack Density | It defines the amount of power consumed by the equipment and server housed in a rack. It is measured in kilowatt (kW). This factor plays a critical role in data center design and, cooling and power planning. |
| IT Load Capacity | The IT load capacity or installed capacity, refers to the amount of energy consumed by servers and network equipment placed in a rack installed. It is measured in megawatt (MW). |
| Absorption Rate | It denotes how much of the data center capacity has been leased out. For instance, if a 100 MW DC has leased out 75 MW, then the absorption rate would be 75%. It is also referred to as utilization rate and leased-out capacity. |
| Raised Floor Space | It is an elevated space built over the floor. This gap between the original floor and the elevated floor is used to accommodate wiring, cooling, and other data center equipment. This arrangement assists in having proper wiring and cooling infrastructure. It is measured in square feet/meter. |
| Computer Room Air Conditioner (CRAC) | It is a device used to monitor and maintain the temperature, air circulation, and humidity inside the server room in the data center. |
| Aisle | It is the open space between the rows of racks. This open space is critical for maintaining the optimal temperature (20-25 °C) in the server room. There are primarily two aisles inside the server room, a hot aisle and a cold aisle. |
| Cold Aisle | It is the aisle wherein the front of the rack faces the aisle. Here, chilled air is directed into the aisle so that it can enter the front of the racks and maintain the temperature. |
| Hot Aisle | It is the aisle where the back of the racks faces the aisle. Here, the heat dissipated from the equipment’s in the rack is directed to the outlet vent of the CRAC. |
| Critical Load | It includes the servers and other computer equipment whose uptime is critical for data center operation. |
| Power Usage Effectiveness (PUE) | It is a metric which defines the efficiency of a data center. It is calculated by: (𝑇𝑜𝑡𝑎𝑙 𝐷𝑎𝑡𝑎 𝐶𝑒𝑛𝑡𝑒𝑟 𝐸𝑛𝑒𝑟𝑔𝑦 𝐶𝑜𝑛𝑠𝑢𝑚𝑝𝑡𝑖𝑜𝑛)/(𝑇𝑜𝑡𝑎𝑙 𝐼𝑇 𝐸𝑞𝑢𝑖𝑝𝑚𝑒𝑛𝑡 𝐸𝑛𝑒𝑟𝑔𝑦 𝐶𝑜𝑛𝑠𝑢𝑚𝑝𝑡𝑖𝑜𝑛). Further, a data center with a PUE of 1.2-1.5 is considered highly efficient, whereas, a data center with a PUE >2 is considered highly inefficient. |
| Redundancy | It is defined as a system design wherein additional component (UPS, generators, CRAC) is added so that in case of power outage, equipment failure, the IT equipment should not be affected. |
| Uninterruptible Power Supply (UPS) | It is a device that is connected in series with the utility power supply, storing energy in batteries such that the supply from UPS is continuous to IT equipment even during utility power is snapped. The UPS primarily supports the IT equipment only. |
| Generators | Just like UPS, generators are placed in the data center to ensure an uninterrupted power supply, avoiding downtime. Data center facilities have diesel generators and commonly, 48-hour diesel is stored in the facility to prevent disruption. |
| N | It denotes the tools and equipment required for a data center to function at full load. Only "N" indicates that there is no backup to the equipment in the event of any failure. |
| N+1 | Referred to as 'Need plus one', it denotes the additional equipment setup available to avoid downtime in case of failure. A data center is considered N+1 when there is one additional unit for every 4 components. For instance, if a data center has 4 UPS systems, then for to achieve N+1, an additional UPS system would be required. |
| 2N | It refers to fully redundant design wherein two independent power distribution system is deployed. Therefore, in the event of a complete failure of one distribution system, the other system will still supply power to the data center. |
| In-Row Cooling | It is the cooling design system installed between racks in a row where it draws warm air from the hot aisle and supplies cool air to the cold aisle, thereby maintaining the temperature. |
| Tier 1 | Tier classification determines the preparedness of a data center facility to sustain data center operation. A data center is classified as Tier 1 data center when it has a non-redundant (N) power component (UPS, generators), cooling components, and power distribution system (from utility power grids). The Tier 1 data center has an uptime of 99.67% and an annual downtime of <28.8 hours. |
| Tier 2 | A data center is classified as Tier 2 data center when it has a redundant power and cooling components (N+1) and a single non-redundant distribution system. Redundant components include extra generators, UPS, chillers, heat rejection equipment, and fuel tanks. The Tier 2 data center has an uptime of 99.74% and an annual downtime of <22 hours. |
| Tier 3 | A data center having redundant power and cooling components and multiple power distribution systems is referred to as a Tier 3 data center. The facility is resistant to planned (facility maintenance) and unplanned (power outage, cooling failure) disruption. The Tier 3 data center has an uptime of 99.98% and an annual downtime of <1.6 hours. |
| Tier 4 | It is the most tolerant type of data center. A Tier 4 data center has multiple, independent redundant power and cooling components and multiple power distribution paths. All IT equipment are dual powered, making them fault tolerant in case of any disruption, thereby ensuring interrupted operation. The Tier 4 data center has an uptime of 99.74% and an annual downtime of <26.3 minutes. |
| Small Data Center | Data center that has floor space area of ≤ 5,000 Sq. ft or the number of racks that can be installed is ≤ 200 is classified as a small data center. |
| Medium Data Center | Data center which has floor space area between 5,001-20,000 Sq. ft, or the number of racks that can be installed is between 201-800, is classified as a medium data center. |
| Large Data Center | Data center which has floor space area between 20,001-75,000 Sq. ft, or the number of racks that can be installed is between 801-3,000, is classified as a large data center. |
| Massive Data Center | Data center which has floor space area between 75,001-225,000 Sq. ft, or the number of racks that can be installed is between 3001-9,000, is classified as a massive data center. |
| Mega Data Center | Data center that has a floor space area of ≥ 225,001 Sq. ft or the number of racks that can be installed is ≥ 9001 is classified as a mega data center. |
| Retail Colocation | It refers to those customers who have a capacity requirement of 250 kW or less. These services are majorly opted by small and medium enterprises (SMEs). |
| Wholesale Colocation | It refers to those customers who have a capacity requirement between 250 kW to 4 MW. These services are majorly opted by medium to large enterprises. |
| Hyperscale Colocation | It refers to those customers who have a capacity requirement greater than 4 MW. The hyperscale demand primarily originates from large-scale cloud players, IT companies, BFSI, and OTT players (like Netflix, Hulu, and HBO+). |
| Mobile Data Speed | It is the mobile internet speed a user experiences via their smartphones. This speed is primarily dependent on the carrier technology being used in the smartphone. The carrier technologies available in the market are 2G, 3G, 4G, and 5G, where 2G provides the slowest speed while 5G is the fastest. |
| Fiber Connectivity Network | It is a network of optical fiber cables deployed across the country, connecting rural and urban regions with high-speed internet connection. It is measured in kilometer (km). |
| Data Traffic per Smartphone | It is a measure of average data consumption by a smartphone user in a month. It is measured in gigabyte (GB). |
| Broadband Data Speed | It is the internet speed that is supplied over the fixed cable connection. Commonly, copper cable and optic fiber cable are used in both residential and commercial use. Here, optic cable fiber provides faster internet speed than copper cable. |
| Submarine Cable | A submarine cable is a fiber optic cable laid down at two or more landing points. Through this cable, communication and internet connectivity between countries across the globe is established. These cables can transmit 100-200 terabits per second (Tbps) from one point to another. |
| Carbon Footprint | It is the measure of carbon dioxide generated during the regular operation of a data center. Since, coal, and oil & gas are the primary source of power generation, consumption of this power contributes to carbon emissions. Data center operators are incorporating renewable energy sources to curb the carbon footprint emerging in their facilities. |
Need More Details on Market Definition?
Ask a Question
Research Methodology
Mordor Intelligence follows a four-step methodology in all our reports.
- Step-1: Identify Key Variables: In order to build a robust forecasting methodology, the variables and factors identified in Step-1 are tested against available historical market numbers. Through an iterative process, the variables required for market forecast are set and the model is built on the basis of these variables.
- Step-2: Build a Market Model: Market-size estimations for the forecast years are in nominal terms. Inflation is not a part of the pricing, and the average selling price (ASP) is kept constant throughout the forecast period for each country.
- Step-3: Validate and Finalize: In this important step, all market numbers, variables and analyst calls are validated through an extensive network of primary research experts from the market studied. The respondents are selected across levels and functions to generate a holistic picture of the market studied.
- Step-4: Research Outputs: Syndicated Reports, Custom Consulting Assignments, Databases & Subscription Platforms

Get More Details On Research Methodology
Download PDF


