| Study Period | 2017 - 2030 |
| Base Year For Estimation | 2024 |
| Forecast Data Period | 2025 - 2030 |
| Market Size (2025) | USD 1.68 Billion |
| Market Size (2030) | USD 2.24 Billion |
| CAGR (2025 - 2030) | 5.98 % |
| Market Concentration | High |
Major Players*Disclaimer: Major Players sorted in no particular order |
 Market Size")
Malaysia Courier, Express, and Parcel (CEP) Market Analysis
The Malaysia Courier, Express, and Parcel (CEP) Market size is estimated at 1.68 billion USD in 2025, and is expected to reach 2.24 billion USD by 2030, growing at a CAGR of 5.98% during the forecast period (2025-2030).
The Malaysian courier market demonstrates robust development through its regulatory framework and infrastructure investments. With 120 parcel operator licenses issued compared to Indonesia's 30 and Thailand's 37 licenses in 2022, Malaysia maintains a highly competitive market environment. The Malaysian government has demonstrated its commitment to infrastructure development by investing USD 20.43 billion across 7,615 projects in 2023, significantly enhancing the logistics network's capability and efficiency. This comprehensive approach to infrastructure development includes road maintenance, new connectivity routes, and strategic transportation hubs that strengthen the foundation of the courier industry.
The market is witnessing a significant transformation in cross-border operations and international connectivity. Cross-border sales constitute approximately 44% of total e-commerce transactions, highlighting Malaysia's strong position as a regional logistics hub. In June 2024, Malaysia Airports Holdings Berhad (MAHB) signed a strategic Memorandum of Understanding with China Henan Aviation Group Co., Ltd (CHAGC) to enhance air cargo connectivity between Malaysia and China, particularly between Zhengzhou Xinzheng International Airport and Kuala Lumpur International Airport (KUL). This partnership is particularly significant as KUL currently handles around 700,000 metric tonnes of cargo annually and accommodates 21 scheduled freighters serving 40 countries.
The industry is experiencing a notable shift toward sustainable logistics solutions and technological innovation. In February 2024, FedEx Express marked a significant milestone by completing the first zero-emission cross-border delivery from Malaysia to Singapore, covering 406 kilometers with a single charge in Johor. This achievement, recognized by the Malaysia Book of Records, demonstrated a reduction of approximately 100 kg in CO2 emissions compared to traditional diesel vans. DHL Express has also embraced sustainable practices by deploying six electric vehicles in 2022, with plans to expand its electric fleet to 61 vehicles serving Malaysia, demonstrating the industry's commitment to environmental sustainability.
The market is being reshaped by strategic infrastructure developments and technological advancements. In May 2024, the government announced the National Semiconductor Strategy, allocating USD 5.3 billion in financial support and planning to train 60,000 semiconductor engineers, which will significantly impact logistics operations for high-value technology components. The ongoing development of the East Coast Railway Line (ECRL), scheduled for completion in 2026, represents a transformative project that will substantially reduce shipping times between Malaysia's east and west coasts. These infrastructure improvements are complemented by the expansion of logistics networks, exemplified by Best's growth to over 100 last-mile service stations and seven sorting centers across Malaysia, enhancing the industry's operational capabilities.
Malaysia Courier, Express, and Parcel (CEP) Market Trends
Malaysia's transportation and storage sector experienced 33.42% YoY growth in 2022, despite USD 7.25 million FDI deficit
- The Belt and Road Initiative is driving Malaysia's infrastructure growth. The East Coast Rail Link (ECRL) seeks to improve connectivity between Kelantan, Terengganu, and Pahang in the East Coast with Negeri Sembilan, Selangor, and Putrajaya in the West Coast. These areas currently lack complete railway connections. The ECRL is forecasted to boost Malaysia's economic growth by up to 2.7%. Furthermore, two decades after its construction, Malaysia's economic growth is expected to reach 4.6%. The ECRL project is set to finish by December 2026 and is expected to start operating in January 2027.
- The MRT3 is the last critical route to complete the Kuala Lumpur urban rail network; the line is 50.8 km long and runs around Kuala Lumpur's outskirts. Its construction began in early 2023 and is slated for full completion by 2030, while operations for the first phase are anticipated to commence in 2028. Through East Coast Rail Link (ECRL), a double-track railway linking infrastructure project, which includes 20 stations, began in 2017, with 14 passenger stations, five combined passenger and freight stations, and one freight station.
,-Share---Of-GDP,-Malaysia,-2017---2023.svg)
Understand The Key Trends Shaping This Market
Download PDF
Elimination of Diesel subsidies under discussions, in order to align retail fuel prices to align with market rates
- Starting in June 2024, Malaysia plans to eliminate diesel subsidies, allowing retail prices to align with the market rate of MYR 3.35 (USD 0.75) per litre, marking a 55% increase from MYR 2.15 (USD 0.48). Despite potential political consequences, this change is projected to have minimal impact on the country's inflation rate. In 2023, diesel subsidies amounted to MYR 14.5 billion (USD 3.28 billion), and the government anticipates saving approximately MYR 4 billion (USD 0.90 billion) annually through this Subsidy Rationalization. Diesel subsidies in the country amount to MYR 1 billion (USD 0.22 billion) monthly, with daily losses from leaks totaling MYR 4.5 million (USD 1.02 million).
- Diesel prices in Malaysia surged by over 50% in June 2024 as part of Prime Minister Anwar Ibrahim's efforts to reform the country's long-standing fuel subsidy system. The restructuring aimed to alleviate pressure on national finances by eliminating universal energy subsidies and focusing assistance on those most in need. This move also aims to address issues like the smuggling of subsidized diesel to neighboring countries, where it fetches higher prices.

OTHER KEY INDUSTRY TRENDS COVERED IN THE REPORT
- Malaysia is expected to hit the aged nation status by 2044, when 14% of the population aged 65 and above
- The oil and gas industry and manufacturing are the major industries contributing to GDP growth
- E-commerce is projected to register a CAGR of 13.26% during 2023-27, fueled by rising internet and smartphone use
- Malaysia anticipates exports of electrical and electronic components to generate USD 112.22 billion by 2025, fueled by high investments in the manufacturing sector
- Malaysia ranked 26th in the Logistic Performance Index in 2023, due to enhanced infrastructure and freight volumes
- Malaysia rolls out the New Industrial Master Plan 2030 to stimulate development of manufacturing sector
- Rising input and output costs, material shortages, and energy and fuel price fluctuations driving rates
- The government announced the National Semiconductor Strategy and aims to make Malaysia a global chip hub
- The government aims to produce 2.22 million tonnes of white rice in 2028, to reduce reliance on agricultural imports
- Malaysia invests USD 20.43 billion in 7,615 infrastructure projects in 2023, focusing on rural development and economic growth
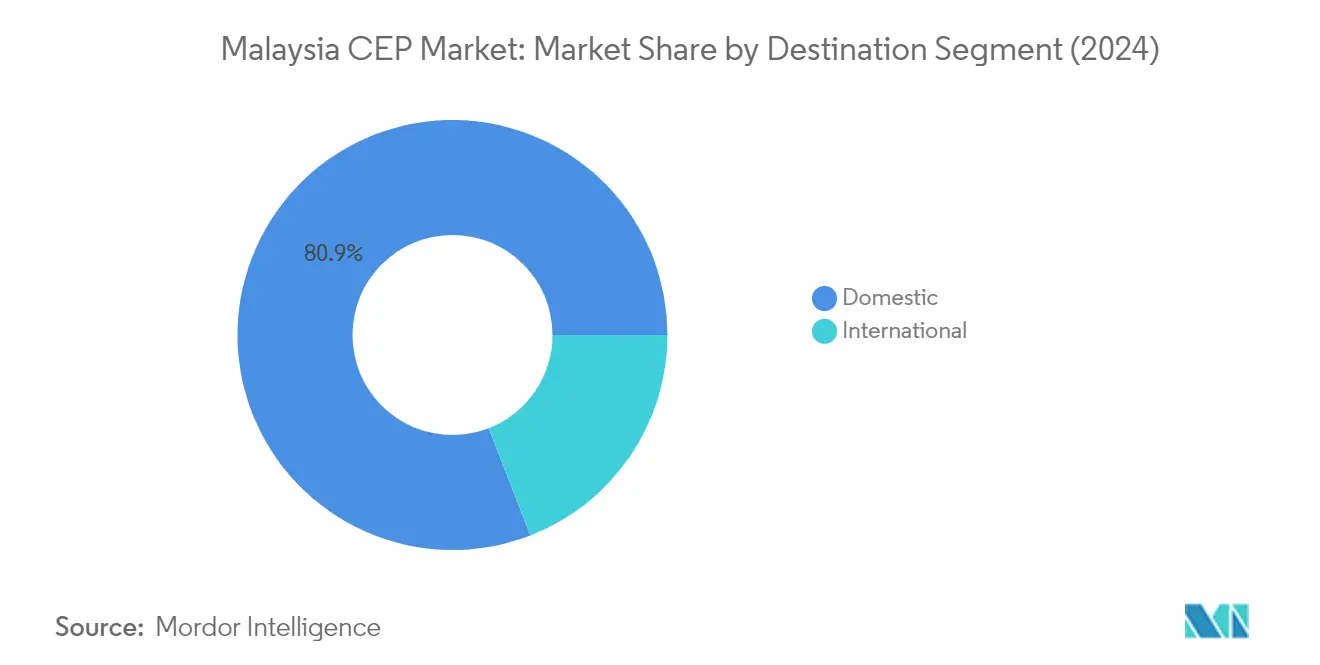
Segment Analysis: By Destination
Domestic Segment in Malaysia CEP Market
The domestic segment dominates the Malaysian courier, express, and parcel (CEP) market, accounting for approximately 81% of the total market volume in 2024. This significant market share is driven by the country's thriving e-commerce landscape and robust domestic delivery infrastructure. The segment's strong performance is supported by major players like Pos Malaysia, which operates over 3,800 retail points and 662 post offices, delivering around 390,000 parcels daily across Malaysia. The domestic CEP market has been further strengthened by strategic partnerships and infrastructure developments, such as DHL Express's expansion of its Johor Bahru Gateway within the Senai Airport City industrial park, featuring a high-speed conveyor system capable of sorting up to 1,900 shipments per hour. Additionally, the implementation of innovative solutions like parcel lockers at RapidKL Light Rail Transit stations and the establishment of collection points across major urban areas has enhanced the accessibility and efficiency of domestic deliveries.
International Segment in Malaysia CEP Market
The international segment of Malaysia's CEP market is projected to experience robust growth between 2024 and 2029, with an expected growth rate of approximately 6% annually. This growth is primarily driven by Malaysia's strategic position as a key logistics hub in Southeast Asia and its increasing cross-border e-commerce activities. The segment's expansion is supported by significant infrastructure developments and strategic initiatives, such as the Digital Free Trade Zone (DFTZ), which aims to streamline cross-border e-commerce activities and expand global market opportunities. Major international players are actively investing in the segment, as evidenced by FedEx Express's landmark electric vehicle delivery service between Malaysia and Singapore, demonstrating the industry's commitment to sustainable cross-border operations. The segment's growth is further bolstered by partnerships between local and international courier companies, enhanced air cargo connectivity agreements, and the development of efficient customs clearance processes to facilitate smoother international shipments.
Segment Analysis: By Speed of Delivery
Non-Express Segment in Malaysian CEP Market
The non-express segment dominates the Malaysian courier, express, and parcel (CEP) market, commanding approximately 76% market share in 2024. This segment's prominence is driven by cost-conscious customers who prioritize economical shipping options over speed. Pos Malaysia, a major player in this segment, has consistently achieved above 90% of their Service Level Agreement (SLA) delivery commitments, with parcel delivery reaching 92% of delivery commitments in 2024. The segment has been strengthened by strategic expansions, such as Ninja Van Malaysia's establishment of its largest warehouse in Shah Alam, covering 260,000 sq. ft. to support increasing volume and enhance support for local SMEs. Additionally, AirAsia Xpress's introduction of domestic delivery services offering affordable rates between eastern and western Malaysia has further solidified the non-express segment's market position.
Express Segment in Malaysian CEP Market
The express delivery segment is experiencing rapid growth in the Malaysian CEP market, with a projected growth rate of approximately 7% from 2024 to 2029. This growth is primarily driven by the increasing demand for time-sensitive deliveries and the expansion of e-commerce platforms requiring rapid fulfillment services. Major global express delivery firms are actively expanding their operations in Malaysia, with companies like DHL Express operating six gateways, 21 service centers, and 185 retail points of sale. The segment's growth is further supported by innovative services like Teleport Pink, launched by Capital A's logistics division, offering next-day international parcel delivery services from Kuala Lumpur to Singapore at competitive rates. Additionally, Cainiao Network's establishment of an intelligent warehouse network across Southeast Asia, including Malaysia, has enhanced the express delivery infrastructure and capabilities in the region.
Segment Analysis: By Model
Business-to-Business (B2B) Segment in Malaysian CEP Market
The Business-to-Business (B2B) segment dominates the Malaysian courier, express, and parcel market, commanding approximately 37% of the total market value in 2024. The segment's strong position is primarily driven by Malaysia's robust manufacturing sector and its role as a manufacturing base for global companies like Dell and Intel that ship large quantities of products internationally. The Malaysian government's Digital Free Trade Zone (DFTZ) initiative has been instrumental in stimulating growth in this segment by establishing KLIA Aeropolis as a strategic logistics center and positioning Malaysia as a regional e-commerce fulfillment hub. The B2B segment particularly benefits from the high volume of cross-border trade, with Malaysia serving as a crucial link in global supply chains. Additionally, the government's focus on supporting small and medium enterprises (SMEs) in leveraging e-commerce platforms has further strengthened the B2B segment's market position.
Business-to-Consumer (B2C) Segment in Malaysian CEP Market
The Business-to-Consumer (B2C) segment is experiencing the most rapid growth in the Malaysian CEP market, with projections indicating an impressive growth rate of approximately 8% from 2024 to 2029. This remarkable growth is primarily fueled by the increasing adoption of e-commerce platforms and changing consumer preferences toward online shopping. The Malaysian government's recognition of e-commerce's significance in promoting B2C transactions has led to various supportive initiatives and policies. The country's high internet penetration rate of 89%, among the highest in Southeast Asia, coupled with a growing population of digitally savvy consumers, continues to drive B2C delivery demand. The availability of customized payment options and the success of major e-commerce platforms like Shopee and Lazada have further accelerated the segment's growth. Additionally, the implementation of advanced delivery technologies and the expansion of last-mile delivery networks by major courier companies have significantly improved B2C service efficiency.
Remaining Segments in Model-Based Segmentation
The Consumer-to-Consumer (C2C) segment represents a significant portion of the Malaysian CEP market, primarily driven by the growing secondhand clothing industry and personal item shipping. The segment has gained prominence through popular resale platforms and the increasing trend of "bundle" shopping in Malaysia. The country's strategic position as a hub for vintage and secondhand items, particularly in fashion, has strengthened the C2C segment. The presence of various thrift stores, ranging from small roadside stalls to large corporate chains like Jalan Jalan Japan, has created substantial demand for C2C shipping services. The segment is further supported by Malaysia's proximity to Japan and other Asian markets, making it easier to import and redistribute rare and sought-after merchandise through C2C channels.
Segment Analysis: By Shipment Weight
Segment Analysis: By Mode of Transport
Road Segment in Malaysia CEP Market
The road transport segment dominates the Malaysian courier, express, and parcel (CEP) market, accounting for approximately 67% of the total market volume in 2024. This significant market share is primarily driven by the country's robust e-commerce landscape and well-developed road infrastructure network. Major global players like DHL, FedEx, Kuehne+Nagel, MAERSK, and CEVA Logistics, alongside local players such as Pos Laju, GDex, and Lalamove, have established strong road logistics networks across Malaysia. To support sustainable last-mile delivery operations, several companies have initiated green mobility solutions. For instance, DHL Express has deployed electric vehicles in Malaysia and aims to expand its electric fleet, while FedEx has introduced electric vehicles for parcel deliveries in the Klang Valley area. These initiatives align with the Malaysian government's objective to promote electric vehicles and achieve net-zero emissions by 2050.
Others Segment in Malaysia CEP Market
The Others segment in Malaysia's CEP market is experiencing robust growth, projected to expand at approximately 4% annually from 2024 to 2029. This growth is being driven by innovative delivery solutions and technological advancements in the logistics sector. The segment has witnessed significant developments in alternative delivery methods, including the integration of parcel locker networks at strategic locations such as RapidKL Light Rail Transit (LRT) stations. Companies like Cainiao Smart Logistics have been actively expanding their presence by establishing collection stations throughout West Malaysia and implementing new consolidated end-to-end logistics services. These developments have helped reduce shipping durations and improve delivery efficiency. The segment's growth is further supported by strategic partnerships between logistics companies and the increasing adoption of automated sorting systems and digital technologies.
Remaining Segments in Mode of Transport
The air transport segment plays a crucial role in Malaysia's CEP market, particularly for time-sensitive and international shipments. This segment is characterized by its focus on express delivery services and handling of high-value goods. Major cargo players in Malaysia are continuously expanding their routes and upgrading their licenses from Air Service Permits to Air Service Licenses to enhance their service capabilities. The segment has also witnessed innovation through automated drone testing initiatives and the introduction of new door-to-door delivery services. The integration of air transport with other modes of delivery has created a comprehensive logistics network that caters to diverse customer needs across Malaysia.
Segment Analysis: By End User Industry
Manufacturing Segment in Malaysia CEP Market
The manufacturing segment dominates Malaysia's courier, express, and parcel (CEP) market, accounting for approximately 35% market share in 2024. This significant share is driven by Malaysia's robust manufacturing sector, particularly in electronic component manufacturing which contributes 4.6% to the country's GDP. The segment's strength is further reinforced by major investments, including the government's National Semiconductor Strategy announced in May 2024, which allocated USD 5.3 billion in financial support and aims to train 60,000 semiconductor engineers to establish Malaysia as a global chip hub. The manufacturing sector's sales value demonstrated strong performance with a 10.3% increase reaching MYR 145.2 billion in early 2024, highlighting the sustained demand for CEP services from this sector. The segment's growth is also supported by various government initiatives like the National Policy on Industry 4.0 (Industry4WRD) and the New Industrial Master Plan 2030, which focus on digitizing the manufacturing sector and boosting industrial development.
E-commerce Segment in Malaysia CEP Market
The e-commerce segment is experiencing the most rapid growth in Malaysia's CEP market, with an expected growth rate of approximately 8% between 2024 and 2029. This exceptional growth is supported by Malaysia's high internet penetration rate of 89%, the highest in Southeast Asia, and its growing digitally savvy population. The segment's expansion is further facilitated by the government's implementation of various programs, including the 'Go-eCommerce Onboarding Campaign' which provides financial aid and subsidies to SMEs for online expansion. The robust growth is also driven by secure online payment systems, with payment cards accounting for nearly 25% of e-commerce transaction value. Major e-commerce platforms like Shopee, which attracts approximately 55 million visitors monthly, continue to drive demand for CEP services. The segment's growth is further supported by cross-border e-commerce activities, with Malaysia's Digital Free Trade Zone (DFTZ) initiative streamlining international trade and expanding global market opportunities for local businesses.
Remaining Segments in End User Industry
The Malaysian CEP market encompasses several other significant segments including Financial Services (BFSI), Healthcare, Primary Industry, and Wholesale and Retail Trade. The BFSI sector leverages CEP services for secure document delivery and financial instrument transportation, while the healthcare segment utilizes specialized delivery services for medical supplies and equipment. The primary industry segment, comprising agriculture, fishing, and forestry, requires CEP services for transporting time-sensitive agricultural products and supplies. The wholesale and retail trade segment continues to maintain its significance in the market through traditional retail operations and omnichannel delivery solutions. Each of these segments contributes uniquely to the market's dynamics, with varying requirements for speed, security, and handling specifications, thereby driving innovation and specialization in CEP services.
Malaysia Courier, Express, and Parcel (CEP) Industry Overview
Top Companies in Malaysia Courier, Express, and Parcel Market
The leading courier companies in the market are focusing on expanding their operational footprint through strategic partnerships and infrastructure development. Companies are investing in automated sorting facilities, digital tracking solutions, and last-mile delivery innovations to enhance operational efficiency. There is a strong emphasis on developing specialized services for e-commerce fulfillment, including same-day delivery options and smart locker networks. Market players are also strengthening their cross-border capabilities through international collaborations and the establishment of bonded warehouses. The integration of sustainable practices, including electric vehicles and eco-friendly packaging solutions, is becoming increasingly important for competitive differentiation. Companies are leveraging artificial intelligence and machine learning for route optimization and predictive analytics to improve service reliability.
Market Dominated by Global and Regional Leaders
The Malaysian CEP market exhibits a consolidated structure with a mix of global logistics giants and strong regional players. International companies like DHL Group and FedEx leverage their extensive global networks and technological capabilities to maintain significant market positions, while regional leaders like J&T Express have gained prominence through their deep understanding of local market dynamics and specialized e-commerce solutions. The market has witnessed the emergence of technology-driven logistics providers who are challenging traditional operators through innovative delivery models and digital-first approaches. The competitive landscape is characterized by strategic partnerships between established players and local companies to enhance market coverage and service capabilities.
The market shows limited merger and acquisition activity, with companies preferring strategic partnerships and organic growth strategies. Market players are focusing on vertical integration, expanding their service portfolios to include warehousing, fulfillment, and specialized delivery solutions. The competitive dynamics are shaped by investments in infrastructure development, including sorting centers, distribution hubs, and digital platforms. Companies are also establishing partnerships with e-commerce platforms and retailers to secure steady business volumes and enhance their market presence.
Innovation and Digital Integration Drive Success
Success in the Malaysian CEP market increasingly depends on the ability to integrate digital technologies and provide value-added services. Companies need to invest in automated sorting facilities, advanced tracking systems, and efficient last-mile delivery solutions to maintain competitiveness. The development of specialized services for key industry verticals, including e-commerce, manufacturing, and retail, is becoming crucial for market success. Players must also focus on building strong relationships with e-commerce platforms and establishing efficient cross-border delivery networks to capture growth opportunities.
Market participants need to address challenges related to last-mile delivery efficiency, particularly in rural areas, while maintaining cost competitiveness. The ability to provide flexible delivery options, including parcel lockers and alternative pickup points, is becoming increasingly important. Companies must also navigate regulatory requirements related to courier licensing and cross-border trade while maintaining service quality. Environmental sustainability and the adoption of green logistics practices are emerging as key differentiators in the market. Success also depends on the ability to maintain service reliability during peak seasons and adapt to changing consumer preferences for delivery speed and convenience. The delivery service industry in Malaysia is evolving rapidly, with courier service providers focusing on digital integration and sustainability.
Malaysia Courier, Express, and Parcel (CEP) Market Leaders
-
DHL Group
-
FedEx
-
J&T Express
-
Ninja Van
-
POS Malaysia Bhd
- *Disclaimer: Major Players sorted in no particular order
Market/1735915443746-MalaysiaCourier,Express,andParcel(CEP)Market-market-concentration.svg)
Need More Details on Market Players and Competiters?
Download PDF
Malaysia Courier, Express, and Parcel (CEP) Market News
- October 2024: UPS had enhanced its air network, enabling faster deliveries for customers across Asia, Africa, and the Middle East, covering over 35 countries. Customers from major Asia Pacific economies had enjoyed next-day delivery to Seoul, South Korea, and from Bangkok to various destinations in the region. In Vietnam, Ho Chi Minh City customers had benefited from next-day services to select regional cities. Shipments from Hanoi to certain Australian cities were completed in just two business days. Additionally, UPS had rolled out Saturday pick-ups in Hanoi for deliveries heading to Sydney, offering businesses more flexibility and accelerating their speed-to-market. Furthermore, deliveries from select Australian cities to Europe were made in as little as two business days.
- September 2024: FedEx partnered with and invested in Nimble, an AI robotics and autonomous e-commerce fulfillment technology company, to scale FedEx Fulfillment with their fully autonomous 3PL model. FedEx offered a comprehensive approach to help e-commerce and omnichannel brands make faster, smarter supply chain decisions. With more than 130 warehouse and fulfillment operations in North America and 475 million returns processed annually, FedEx Supply Chain helped brands consolidate functions, increase agility, and accelerate click-to-door speed to maximize supply chain value.
- September 2024: Ninja Van introduced two new services, namely, Ninja B2B and Ninja Cold, marking its foray into B2B and cold-chain delivery. These offerings were integral to the company's strategy to diversify beyond eCommerce. With Ninja B2B, businesses gained the advantage of real-time parcel tracking and enhanced flexibility, enabling them to restock their stores more frequently than the typical once-a-week cadence. Ninja B2B was introduced across all six of Ninja Van's markets, including Singapore, Malaysia, Indonesia, the Philippines, Vietnam, and Thailand.
Free With This Report
We provide a complimentary and exhaustive set of data points on global and regional metrics that present the fundamental structure of the industry. Presented in the form of 60+ free charts, the section covers difficult to find data on various regions pertaining to e-commerce industry trends, economic contribution of the transportation & storage sector, export-import trends, logistics performance among other key indicators.
-of-E-Commerce-Industry,-USD,-Global,-2017---2022.svg)
-of-E-Commerce-Industry,-North-America,-Value,-USD,-2017-2022.svg)
-of-E-Commerce-Industry,-Europe,-Value,-USD,-2017-2022.svg)
-of-E-Commerce-Industry,-Asia-Pacific,-Value,-USD,-2017-2022.svg)
,-Share---of-GDP,-Global,-2022.svg)


Malaysia Courier, Express, and Parcel (CEP) Market Report - Table of Contents
1. EXECUTIVE SUMMARY & KEY FINDINGS
2. REPORT OFFERS
3. INTRODUCTION
- 3.1 Study Assumptions & Market Definition
- 3.2 Scope of the Study
- 3.3 Research Methodology
4. KEY INDUSTRY TRENDS
- 4.1 Demographics
- 4.2 GDP Distribution By Economic Activity
- 4.3 GDP Growth By Economic Activity
- 4.4 Inflation
-
4.5 Economic Performance And Profile
- 4.5.1 Trends in E-Commerce Industry
- 4.5.2 Trends in Manufacturing Industry
- 4.6 Transport And Storage Sector GDP
- 4.7 Export Trends
- 4.8 Import Trends
- 4.9 Fuel Price
- 4.10 Logistics Performance
- 4.11 Infrastructure
-
4.12 Regulatory Framework
- 4.12.1 Malaysia
- 4.13 Value Chain & Distribution Channel Analysis
5. MARKET SEGMENTATION (includes Market Value in USD, Forecasts up to 2030 and analysis of growth prospects)
-
5.1 Destination
- 5.1.1 Domestic
- 5.1.2 International
-
5.2 Speed Of Delivery
- 5.2.1 Express
- 5.2.2 Non-Express
-
5.3 Model
- 5.3.1 Business-to-Business (B2B)
- 5.3.2 Business-to-Consumer (B2C)
- 5.3.3 Consumer-to-Consumer (C2C)
-
5.4 Shipment Weight
- 5.4.1 Heavy Weight Shipments
- 5.4.2 Light Weight Shipments
- 5.4.3 Medium Weight Shipments
-
5.5 Mode Of Transport
- 5.5.1 Air
- 5.5.2 Road
- 5.5.3 Others
-
5.6 End User Industry
- 5.6.1 E-Commerce
- 5.6.2 Financial Services (BFSI)
- 5.6.3 Healthcare
- 5.6.4 Manufacturing
- 5.6.5 Primary Industry
- 5.6.6 Wholesale and Retail Trade (Offline)
- 5.6.7 Others
6. COMPETITIVE LANDSCAPE
- 6.1 Key Strategic Moves
- 6.2 Market Share Analysis
- 6.3 Company Landscape
-
6.4 Company Profiles
- 6.4.1 City-Link Express
- 6.4.2 DHL Group
- 6.4.3 FedEx
- 6.4.4 GDEX Group
- 6.4.5 J&T Express
- 6.4.6 Ninja Van
- 6.4.7 POS Malaysia Bhd
- 6.4.8 SF Express (KEX-SF)
- 6.4.9 SkyNet Worldwide Express
- 6.4.10 United Parcel Service of America, Inc. (UPS)
- *List Not Exhaustive
7. KEY STRATEGIC QUESTIONS FOR CEP CEOS
8. APPENDIX
-
8.1 Global Overview
- 8.1.1 Overview
- 8.1.2 Porter’s Five Forces Framework
- 8.1.3 Global Value Chain Analysis
- 8.1.4 Market Dynamics (DROs)
- 8.1.5 Technological Advancements
- 8.2 Sources & References
- 8.3 List of Tables & Figures
- 8.4 Primary Insights
- 8.5 Data Pack
- 8.6 Glossary of Terms
You Can Purchase Parts Of This Report. Check Out Prices For Specific Sections
Get Price Break-up Now
List of Tables & Figures
- Figure 1:
- POPULATION DISTRIBUTION BY GENDER, COUNT, MALAYSIA, 2017 - 2030
- Figure 2:
- POPULATION DISTRIBUTION BY DEVELOPMENT AREA, COUNT, MALAYSIA, 2017 - 2030
- Figure 3:
- POPULATION DENSITY, POPULATION/SQ. KM, MALAYSIA, 2017 - 2030
- Figure 4:
- GROSS DOMESTIC PRODUCT (GDP) SHARE OF FINAL CONSUMPTION EXPENDITURE (IN CURRENT PRICES), SHARE % OF GDP, MALAYSIA, 2017 - 2022
- Figure 5:
- FINAL CONSUMPTION EXPENDITURE, ANNUAL GROWTH (%), MALAYSIA, 2017 - 2022
- Figure 6:
- POPULATION DISTRIBUTION BY MAJOR CITY, COUNT, MALAYSIA, 2022
- Figure 7:
- DISTRIBUTION OF GROSS DOMESTIC PRODUCT (GDP) BY ECONOMIC ACTIVITY, SHARE %, MALAYSIA, 2022
- Figure 8:
- GROWTH OF GROSS DOMESTIC PRODUCT (GDP) BY ECONOMIC ACTIVITY, CAGR %, MALAYSIA, 2017 – 2022
- Figure 9:
- WHOLESALE PRICE INFLATION RATE, %, MALAYSIA, 2017 - 2022
- Figure 10:
- CONSUMER PRICE INFLATION RATE, %, MALAYSIA, 2017 - 2022
- Figure 11:
- GROSS MERCHANDISE VALUE (GMV) OF E-COMMERCE INDUSTRY, USD, MALAYSIA, 2017 - 2027
- Figure 12:
- SECTORAL SHARE IN E-COMMERCE INDUSTRY GROSS MERCHANDISE VALUE (GMV), SHARE %, MALAYSIA, 2022
- Figure 13:
- GROSS VALUE ADDED (GVA) OF MANUFACTURING INDUSTRY (IN CURRENT PRICES), USD, MALAYSIA, 2017 - 2022
- Figure 14:
- SECTORAL SHARE IN GROSS VALUE ADDED (GVA) OF MANUFACTURING INDUSTRY, SHARE %, MALAYSIA, 2022
- Figure 15:
- VALUE OF TRANSPORT AND STORAGE SECTOR GROSS DOMESTIC PRODUCT (GDP), USD, MALAYSIA, 2017 – 2022
- Figure 16:
- TRANSPORT AND STORAGE SECTOR GROSS DOMESTIC PRODUCT (GDP), SHARE % OF GDP, MALAYSIA, 2022
- Figure 17:
- VALUE OF EXPORTS, USD, MALAYSIA, 2017 - 2022
- Figure 18:
- VALUE OF IMPORTS, USD, MALAYSIA, 2017 - 2022
- Figure 19:
- FUEL PRICE BY TYPE OF FUEL, USD/LITER, MALAYSIA, 2017 - 2022
- Figure 20:
- RANK OF LOGISTICS PERFORMANCE, RANK, MALAYSIA, 2010 - 2023
- Figure 21:
- LENGTH OF ROADS, KM, MALAYSIA, 2017 - 2022
- Figure 22:
- SHARE OF ROAD LENGTH BY SURFACE CATEGORY, %, MALAYSIA, 2022
- Figure 23:
- SHARE OF ROAD LENGTH BY ROAD CLASSIFICATION, %, MALAYSIA, 2022
- Figure 24:
- RAIL LENGTH, KM, MALAYSIA, 2017 - 2022
- Figure 25:
- CONTAINERS HANDLED AT MAJOR PORTS, TWENTY-FOOT EQUIVALENT UNITS (TEUS), MALAYSIA, 2022
- Figure 26:
- CARGO WEIGHT HANDLED AT MAJOR AIRPORTS, TONS, MALAYSIA, 2022
- Figure 27:
- VOLUME OF COURIER, EXPRESS, AND PARCEL (CEP) MARKET, NUMBER OF PARCELS, MALAYSIA, 2017 - 2030
- Figure 28:
- VALUE OF COURIER, EXPRESS, AND PARCEL (CEP) MARKET, USD, MALAYSIA, 2017 - 2030
- Figure 29:
- VOLUME OF COURIER, EXPRESS, AND PARCEL (CEP) MARKET BY DESTINATION, NUMBER OF PARCELS, MALAYSIA 2017 - 2030
- Figure 30:
- VALUE OF COURIER, EXPRESS, AND PARCEL (CEP) MARKET BY DESTINATION, USD, MALAYSIA 2017 - 2030
- Figure 31:
- VALUE SHARE OF COURIER, EXPRESS, AND PARCEL (CEP) MARKET BY DESTINATION, %, MALAYSIA, 2017 - 2030
- Figure 32:
- VOLUME SHARE OF COURIER, EXPRESS, AND PARCEL (CEP) MARKET BY DESTINATION, %, MALAYSIA, 2017 - 2030
- Figure 33:
- VOLUME OF DOMESTIC COURIER, EXPRESS, AND PARCEL (CEP) MARKET, NUMBER OF PARCELS, MALAYSIA, 2017 - 2030
- Figure 34:
- VALUE OF DOMESTIC COURIER, EXPRESS, AND PARCEL (CEP) MARKET, USD, MALAYSIA, 2017 - 2030
- Figure 35:
- VALUE SHARE OF DOMESTIC COURIER, EXPRESS, AND PARCEL (CEP) MARKET BY END USER INDUSTRY, %, MALAYSIA, 2022 VS 2030
- Figure 36:
- VOLUME OF INTERNATIONAL COURIER, EXPRESS, AND PARCEL (CEP) MARKET, NUMBER OF PARCELS, MALAYSIA, 2017 - 2030
- Figure 37:
- VALUE OF INTERNATIONAL COURIER, EXPRESS, AND PARCEL (CEP) MARKET, USD, MALAYSIA, 2017 - 2030
- Figure 38:
- VALUE SHARE OF INTERNATIONAL COURIER, EXPRESS, AND PARCEL (CEP) MARKET BY END USER INDUSTRY, %, MALAYSIA, 2022 VS 2030
- Figure 39:
- VOLUME OF COURIER, EXPRESS, AND PARCEL (CEP) MARKET BY SPEED OF DELIVERY, NUMBER OF PARCELS, MALAYSIA 2017 - 2030
- Figure 40:
- VALUE OF COURIER, EXPRESS, AND PARCEL (CEP) MARKET BY SPEED OF DELIVERY, USD, MALAYSIA 2017 - 2030
- Figure 41:
- VALUE SHARE OF COURIER, EXPRESS, AND PARCEL (CEP) MARKET BY SPEED OF DELIVERY, %, MALAYSIA, 2017 - 2030
- Figure 42:
- VOLUME SHARE OF COURIER, EXPRESS, AND PARCEL (CEP) MARKET BY SPEED OF DELIVERY, %, MALAYSIA, 2017 - 2030
- Figure 43:
- VOLUME OF EXPRESS COURIER, EXPRESS, AND PARCEL (CEP) MARKET, NUMBER OF PARCELS, MALAYSIA, 2017 - 2030
- Figure 44:
- VALUE OF EXPRESS COURIER, EXPRESS, AND PARCEL (CEP) MARKET, USD, MALAYSIA, 2017 - 2030
- Figure 45:
- VALUE SHARE OF EXPRESS COURIER, EXPRESS, AND PARCEL (CEP) MARKET BY END USER INDUSTRY, %, MALAYSIA, 2022 VS 2030
- Figure 46:
- VOLUME OF NON-EXPRESS COURIER, EXPRESS, AND PARCEL (CEP) MARKET, NUMBER OF PARCELS, MALAYSIA, 2017 - 2030
- Figure 47:
- VALUE OF NON-EXPRESS COURIER, EXPRESS, AND PARCEL (CEP) MARKET, USD, MALAYSIA, 2017 - 2030
- Figure 48:
- VALUE SHARE OF NON-EXPRESS COURIER, EXPRESS, AND PARCEL (CEP) MARKET BY END USER INDUSTRY, %, MALAYSIA, 2022 VS 2030
- Figure 49:
- VOLUME OF COURIER, EXPRESS, AND PARCEL (CEP) MARKET BY MODEL, NUMBER OF PARCELS, MALAYSIA 2017 - 2030
- Figure 50:
- VALUE OF COURIER, EXPRESS, AND PARCEL (CEP) MARKET BY MODEL, USD, MALAYSIA 2017 - 2030
- Figure 51:
- VALUE SHARE OF COURIER, EXPRESS, AND PARCEL (CEP) MARKET BY MODEL, %, MALAYSIA, 2017 - 2030
- Figure 52:
- VOLUME SHARE OF COURIER, EXPRESS, AND PARCEL (CEP) MARKET BY MODEL, %, MALAYSIA, 2017 - 2030
- Figure 53:
- VOLUME OF BUSINESS-TO-BUSINESS (B2B) COURIER, EXPRESS, AND PARCEL (CEP) MARKET, NUMBER OF PARCELS, MALAYSIA, 2017 - 2030
- Figure 54:
- VALUE OF BUSINESS-TO-BUSINESS (B2B) COURIER, EXPRESS, AND PARCEL (CEP) MARKET, USD, MALAYSIA, 2017 - 2030
- Figure 55:
- VALUE SHARE OF BUSINESS-TO-BUSINESS (B2B) COURIER, EXPRESS, AND PARCEL (CEP) MARKET BY END USER INDUSTRY, %, MALAYSIA, 2022 VS 2030
- Figure 56:
- VOLUME OF BUSINESS-TO-CONSUMER (B2C) COURIER, EXPRESS, AND PARCEL (CEP) MARKET, NUMBER OF PARCELS, MALAYSIA, 2017 - 2030
- Figure 57:
- VALUE OF BUSINESS-TO-CONSUMER (B2C) COURIER, EXPRESS, AND PARCEL (CEP) MARKET, USD, MALAYSIA, 2017 - 2030
- Figure 58:
- VALUE SHARE OF BUSINESS-TO-CONSUMER (B2C) COURIER, EXPRESS, AND PARCEL (CEP) MARKET BY END USER INDUSTRY, %, MALAYSIA, 2022 VS 2030
- Figure 59:
- VOLUME OF CONSUMER-TO-CONSUMER (C2C) COURIER, EXPRESS, AND PARCEL (CEP) MARKET, NUMBER OF PARCELS, MALAYSIA, 2017 - 2030
- Figure 60:
- VALUE OF CONSUMER-TO-CONSUMER (C2C) COURIER, EXPRESS, AND PARCEL (CEP) MARKET, USD, MALAYSIA, 2017 - 2030
- Figure 61:
- VALUE SHARE OF CONSUMER-TO-CONSUMER (C2C) COURIER, EXPRESS, AND PARCEL (CEP) MARKET BY END USER INDUSTRY, %, MALAYSIA, 2022 VS 2030
- Figure 62:
- VOLUME OF COURIER, EXPRESS, AND PARCEL (CEP) MARKET BY SHIPMENT WEIGHT, NUMBER OF PARCELS, MALAYSIA 2017 - 2030
- Figure 63:
- VALUE OF COURIER, EXPRESS, AND PARCEL (CEP) MARKET BY SHIPMENT WEIGHT, USD, MALAYSIA 2017 - 2030
- Figure 64:
- VALUE SHARE OF COURIER, EXPRESS, AND PARCEL (CEP) MARKET BY SHIPMENT WEIGHT, %, MALAYSIA, 2017 - 2030
- Figure 65:
- VOLUME SHARE OF COURIER, EXPRESS, AND PARCEL (CEP) MARKET BY SHIPMENT WEIGHT, %, MALAYSIA, 2017 - 2030
- Figure 66:
- VOLUME OF HEAVY WEIGHT SHIPMENTS COURIER, EXPRESS, AND PARCEL (CEP) MARKET, NUMBER OF PARCELS, MALAYSIA, 2017 - 2030
- Figure 67:
- VALUE OF HEAVY WEIGHT SHIPMENTS COURIER, EXPRESS, AND PARCEL (CEP) MARKET, USD, MALAYSIA, 2017 - 2030
- Figure 68:
- VALUE SHARE OF HEAVY WEIGHT SHIPMENTS COURIER, EXPRESS, AND PARCEL (CEP) MARKET BY END USER INDUSTRY, %, MALAYSIA, 2022 VS 2030
- Figure 69:
- VOLUME OF LIGHT WEIGHT SHIPMENTS COURIER, EXPRESS, AND PARCEL (CEP) MARKET, NUMBER OF PARCELS, MALAYSIA, 2017 - 2030
- Figure 70:
- VALUE OF LIGHT WEIGHT SHIPMENTS COURIER, EXPRESS, AND PARCEL (CEP) MARKET, USD, MALAYSIA, 2017 - 2030
- Figure 71:
- VALUE SHARE OF LIGHT WEIGHT SHIPMENTS COURIER, EXPRESS, AND PARCEL (CEP) MARKET BY END USER INDUSTRY, %, MALAYSIA, 2022 VS 2030
- Figure 72:
- VOLUME OF MEDIUM WEIGHT SHIPMENTS COURIER, EXPRESS, AND PARCEL (CEP) MARKET, NUMBER OF PARCELS, MALAYSIA, 2017 - 2030
- Figure 73:
- VALUE OF MEDIUM WEIGHT SHIPMENTS COURIER, EXPRESS, AND PARCEL (CEP) MARKET, USD, MALAYSIA, 2017 - 2030
- Figure 74:
- VALUE SHARE OF MEDIUM WEIGHT SHIPMENTS COURIER, EXPRESS, AND PARCEL (CEP) MARKET BY END USER INDUSTRY, %, MALAYSIA, 2022 VS 2030
- Figure 75:
- VOLUME OF COURIER, EXPRESS, AND PARCEL (CEP) MARKET BY MODE OF TRANSPORT, NUMBER OF PARCELS, MALAYSIA 2017 - 2030
- Figure 76:
- VALUE OF COURIER, EXPRESS, AND PARCEL (CEP) MARKET BY MODE OF TRANSPORT, USD, MALAYSIA 2017 - 2030
- Figure 77:
- VALUE SHARE OF COURIER, EXPRESS, AND PARCEL (CEP) MARKET BY MODE OF TRANSPORT, %, MALAYSIA, 2017 - 2030
- Figure 78:
- VOLUME SHARE OF COURIER, EXPRESS, AND PARCEL (CEP) MARKET BY MODE OF TRANSPORT, %, MALAYSIA, 2017 - 2030
- Figure 79:
- VOLUME OF AIR COURIER, EXPRESS, AND PARCEL (CEP) MARKET, NUMBER OF PARCELS, MALAYSIA, 2017 - 2030
- Figure 80:
- VALUE OF AIR COURIER, EXPRESS, AND PARCEL (CEP) MARKET, USD, MALAYSIA, 2017 - 2030
- Figure 81:
- VALUE SHARE OF AIR COURIER, EXPRESS, AND PARCEL (CEP) MARKET BY END USER INDUSTRY, %, MALAYSIA, 2022 VS 2030
- Figure 82:
- VOLUME OF ROAD COURIER, EXPRESS, AND PARCEL (CEP) MARKET, NUMBER OF PARCELS, MALAYSIA, 2017 - 2030
- Figure 83:
- VALUE OF ROAD COURIER, EXPRESS, AND PARCEL (CEP) MARKET, USD, MALAYSIA, 2017 - 2030
- Figure 84:
- VALUE SHARE OF ROAD COURIER, EXPRESS, AND PARCEL (CEP) MARKET BY END USER INDUSTRY, %, MALAYSIA, 2022 VS 2030
- Figure 85:
- VOLUME OF OTHERS COURIER, EXPRESS, AND PARCEL (CEP) MARKET, NUMBER OF PARCELS, MALAYSIA, 2017 - 2030
- Figure 86:
- VALUE OF OTHERS COURIER, EXPRESS, AND PARCEL (CEP) MARKET, USD, MALAYSIA, 2017 - 2030
- Figure 87:
- VALUE SHARE OF OTHERS COURIER, EXPRESS, AND PARCEL (CEP) MARKET BY END USER INDUSTRY, %, MALAYSIA, 2022 VS 2030
- Figure 88:
- VOLUME OF COURIER, EXPRESS, AND PARCEL (CEP) MARKET BY END USER INDUSTRY, NUMBER OF PARCELS, MALAYSIA 2017 - 2030
- Figure 89:
- VALUE OF COURIER, EXPRESS, AND PARCEL (CEP) MARKET BY END USER INDUSTRY, USD, MALAYSIA 2017 - 2030
- Figure 90:
- VALUE SHARE OF COURIER, EXPRESS, AND PARCEL (CEP) MARKET BY END USER INDUSTRY, %, MALAYSIA, 2017 - 2030
- Figure 91:
- VOLUME SHARE OF COURIER, EXPRESS, AND PARCEL (CEP) MARKET BY END USER INDUSTRY, %, MALAYSIA, 2017 - 2030
- Figure 92:
- VOLUME OF E-COMMERCE COURIER, EXPRESS, AND PARCEL (CEP) MARKET, NUMBER OF PARCELS, MALAYSIA, 2017 - 2030
- Figure 93:
- VALUE OF E-COMMERCE COURIER, EXPRESS, AND PARCEL (CEP) MARKET, USD, MALAYSIA, 2017 - 2030
- Figure 94:
- VALUE SHARE OF E-COMMERCE COURIER, EXPRESS, AND PARCEL (CEP) MARKET BY DESTINATION, %, MALAYSIA, 2022 VS 2030
- Figure 95:
- VOLUME OF FINANCIAL SERVICES (BFSI) COURIER, EXPRESS, AND PARCEL (CEP) MARKET, NUMBER OF PARCELS, MALAYSIA, 2017 - 2030
- Figure 96:
- VALUE OF FINANCIAL SERVICES (BFSI) COURIER, EXPRESS, AND PARCEL (CEP) MARKET, USD, MALAYSIA, 2017 - 2030
- Figure 97:
- VALUE SHARE OF FINANCIAL SERVICES (BFSI) COURIER, EXPRESS, AND PARCEL (CEP) MARKET BY DESTINATION, %, MALAYSIA, 2022 VS 2030
- Figure 98:
- VOLUME OF HEALTHCARE COURIER, EXPRESS, AND PARCEL (CEP) MARKET, NUMBER OF PARCELS, MALAYSIA, 2017 - 2030
- Figure 99:
- VALUE OF HEALTHCARE COURIER, EXPRESS, AND PARCEL (CEP) MARKET, USD, MALAYSIA, 2017 - 2030
- Figure 100:
- VALUE SHARE OF HEALTHCARE COURIER, EXPRESS, AND PARCEL (CEP) MARKET BY DESTINATION, %, MALAYSIA, 2022 VS 2030
- Figure 101:
- VOLUME OF MANUFACTURING COURIER, EXPRESS, AND PARCEL (CEP) MARKET, NUMBER OF PARCELS, MALAYSIA, 2017 - 2030
- Figure 102:
- VALUE OF MANUFACTURING COURIER, EXPRESS, AND PARCEL (CEP) MARKET, USD, MALAYSIA, 2017 - 2030
- Figure 103:
- VALUE SHARE OF MANUFACTURING COURIER, EXPRESS, AND PARCEL (CEP) MARKET BY DESTINATION, %, MALAYSIA, 2022 VS 2030
- Figure 104:
- VOLUME OF PRIMARY INDUSTRY COURIER, EXPRESS, AND PARCEL (CEP) MARKET, NUMBER OF PARCELS, MALAYSIA, 2017 - 2030
- Figure 105:
- VALUE OF PRIMARY INDUSTRY COURIER, EXPRESS, AND PARCEL (CEP) MARKET, USD, MALAYSIA, 2017 - 2030
- Figure 106:
- VALUE SHARE OF PRIMARY INDUSTRY COURIER, EXPRESS, AND PARCEL (CEP) MARKET BY DESTINATION, %, MALAYSIA, 2022 VS 2030
- Figure 107:
- VOLUME OF WHOLESALE AND RETAIL TRADE (OFFLINE) COURIER, EXPRESS, AND PARCEL (CEP) MARKET, NUMBER OF PARCELS, MALAYSIA, 2017 - 2030
- Figure 108:
- VALUE OF WHOLESALE AND RETAIL TRADE (OFFLINE) COURIER, EXPRESS, AND PARCEL (CEP) MARKET, USD, MALAYSIA, 2017 - 2030
- Figure 109:
- VALUE SHARE OF WHOLESALE AND RETAIL TRADE (OFFLINE) COURIER, EXPRESS, AND PARCEL (CEP) MARKET BY DESTINATION, %, MALAYSIA, 2022 VS 2030
- Figure 110:
- VOLUME OF OTHERS COURIER, EXPRESS, AND PARCEL (CEP) MARKET, NUMBER OF PARCELS, MALAYSIA, 2017 - 2030
- Figure 111:
- VALUE OF OTHERS COURIER, EXPRESS, AND PARCEL (CEP) MARKET, USD, MALAYSIA, 2017 - 2030
- Figure 112:
- VALUE SHARE OF OTHERS COURIER, EXPRESS, AND PARCEL (CEP) MARKET BY DESTINATION, %, MALAYSIA, 2022 VS 2030
- Figure 113:
- MOST ACTIVE COMPANIES BY NUMBER OF STRATEGIC MOVES, COUNT, MALAYSIA, 2017 - 2023
- Figure 114:
- MOST ADOPTED STRATEGIES, COUNT, MALAYSIA, 2017 - 2023
- Figure 115:
- VALUE SHARE OF MAJOR PLAYERS, %, MALAYSIA
Malaysia Courier, Express, and Parcel (CEP) Industry Segmentation
Domestic, International are covered as segments by Destination. Express, Non-Express are covered as segments by Speed Of Delivery. Business-to-Business (B2B), Business-to-Consumer (B2C), Consumer-to-Consumer (C2C) are covered as segments by Model. Heavy Weight Shipments, Light Weight Shipments, Medium Weight Shipments are covered as segments by Shipment Weight. Air, Road, Others are covered as segments by Mode Of Transport. E-Commerce, Financial Services (BFSI), Healthcare, Manufacturing, Primary Industry, Wholesale and Retail Trade (Offline), Others are covered as segments by End User Industry.| Destination | Domestic |
| International | |
| Speed Of Delivery | Express |
| Non-Express | |
| Model | Business-to-Business (B2B) |
| Business-to-Consumer (B2C) | |
| Consumer-to-Consumer (C2C) | |
| Shipment Weight | Heavy Weight Shipments |
| Light Weight Shipments | |
| Medium Weight Shipments | |
| Mode Of Transport | Air |
| Road | |
| Others | |
| End User Industry | E-Commerce |
| Financial Services (BFSI) | |
| Healthcare | |
| Manufacturing | |
| Primary Industry | |
| Wholesale and Retail Trade (Offline) | |
| Others |
Need A Different Region or Segment?
Customize Now
Market Definition
- Courier, Express, and Parcel - The Courier, Express, and Parcel services, often called as CEP Market, refers to the logistics and postal service providers which specialize in moving small goods (parcels/packages). It captures the overall market size (USD) and market volume (number of parcels) of (1) the shipments/parcels/packages which are under 70kgs/ 154lbs weight, (2) Business Customer packages viz. Business-to-Business (B2B) & Business-to-Consumer (B2C) as well as private customer packages (C2C), (3) non-express parcel delivery services (Standard and Deferred) as well as express parcel delivery services (Day-Definite-Express and Time-Definite-Express), (4) domestic as well as international shipments.
- Demographics - To analyse total addressable market demand, population growth & forecasts have been studied and presented in this industry trend. It represents population distribution across categories like gender (male/female), development area (urban/rural), major cities among other key parameters like population density and final consumption expenditure (growth and share % of GDP). This data has been used for assessing the fluctations in demand & consumption expenditure, and the major hotspots (cities) of potential demand.
- Domestic Courier Market - Domestic Courier Market refers to the CEP shipments wherein the origin and destination is within the boundary of the geography studied (country or region as per the scope of report). It captures the market size (USD) and market volume (number of parcels) of (1) the shipments/parcels/packages which are under 70kgs/ 154lbs weight, including light weight shipments, medium weight shipments and heavy weight shipments (2) Business Customer packages viz. Business-to-Business (B2B) & Business-to-Consumer (B2C) as well as private customer packages (C2C), (3) non-express parcel delivery services (Standard and Deferred) as well as express parcel delivery services (Day-Definite-Express and Time-Definite-Express).
- E-Commerce - This end user industry segment captures the external (outsourced) logistics expenditure incurred by the e-tailers, through online sales channel, on Courier, Express, and Parcel (CEP) services. The scope includes (i) the supply chain of a company's online customer orders being fulfilled, (ii) the process of getting a product from the point of manufacturing to the point at which it is delivered to consumers. It involves managing inventory (deferred as well as time critical), shipping, and distribution.
- Export Trends and Import Trends - Overall logistics performance of an economy is positively and significantly (statistically) correlated to its trade performance (exports and imports). Hence, in this industry trend, total value of trade, major commodities/ commodity groups and the major trade partners, for the studied geography (country or region as per the scope of report) have been analysed alongside the impact of major trade/logistics infrastructure investments & regulatory environment.
- Financial Services (BFSI) - This end user industry segment captures the external (outsourced) logistics expenditure incurred by the BFSI players, on Courier, Express, and Parcel (CEP) services. CEP is important to the financial services industry in shipping of confidential documents and files. The establishments in this sector are engaged in (i) financial transactions (that is, transactions involving the creation, liquidation, or change in ownership of financial assets) or in facilitating financial transactions, (ii) financial intermediation, (iii) the pooling of risk by underwriting annuities and insurance, (iv) providing specialized services that facilitate or support financial intermediation, insurance and employee benefit programs, and (v) monetary control - the monetary authorities.
- Fuel Price - Fuel price spikes can cause delays and diruption for logistics service providers (LSPs), while drops in the same can result in higher short-term profitability and increased market rivalry to offer consumers with the best deals. Hence, the fuel price variations have been studied over the review period and presented along with the causes as well as market impacts.
- GDP Distribution by Economic Activity - Nominal Gross Domestic Product and distribution of the same, across major economic sectors in the geography studied (country or region as per scope of the report) have been studied and presented in this industry trend. As GDP is positively related to the profitability and growth of logistics industry, this data has been used in adjunction to the input-output tables/ supply-use tables for analyzing the potential major contributing sectors towards the logistics demand.
- GDP Growth by Economic Activity - Growth of Nominal Gross Domestic Product across major economic sectors, for the geography studied (country or region as per scope of the report) have been presented in this industry trend. This data has been utilized for assessing the growth of logistics demand from all the market end users (economic sectors considered here).
- Healthcare - This end user industry segment captures the external (outsourced) logistics expenditure incurred by the Healthcare players (Hospitals, clinics, mrdical centres) , on Courier, Express, and Parcel (CEP) services. The scope includes CEP services involved in the defrerred as well time critical movement of medical goods & supplies (surgical supplies and instruments, including gloves, masks, syringes, equipment). The establishments in this sector (i) include the ones providing medical care exclusively (ii) deliver services by trained professionals (iii) involve processes, including labor inputs of health practitioners with the requisite expertise (iv) are defined based on the educational degree held by the practitioners included in the industry.
- Inflation - Variations in both Wholesale Price Inflation (YoY change in producer price index) and Consumer Price Inflation have been presented in this industry trend. This data has been used to assess the inflationary environment as it plays a vital role in smooth functioning of the supply chain, directly impacting the logistics operational cost components e.g., pricing of tyres, driver wages & benefits, energy/fuel prices, maintenace costs, toll charges, warehousing rents, custom brokerage, forwarding rates, courier rates etc. hence impacting the overall freight and logistics market.
- Infrastructure - As infrastructure plays a vital role in an economy's logistics performance, variables like length of roads, distribution of road length by surface category (paved v/s unpaved), distribution of road length by road classification (expressways v/s highways v/s other roads), rail length, volume of containers handled by major ports and tonnage handled by major airports have been analysed and presented in this industry trend.
- International Express Service Market - International Express Service Market refers to the CEP shipments wherein the origin or destination is not within the boundary of the geography studied (country or region as per the scope of report). It captures the market size (USD) and market volume (number of parcels) of (1) the shipments/parcels/packages which are under 70kgs/ 154lbs weight, including light weight shipments, medium weight shipments and heavy weight shipments (ii) Inter-Region as well as Intra-Region Shipments
- Key Industry Trends - The report section named "Key Industry Trends" include all the key variables/parameters studied to better analyze the market size estimates and forecasts. All the trends have been presented in the form of data points (time series or latest available data points) along with analysis of the paramter in the form of concise market relevant commentary, for the geography studied (country or region as per the scope of report).
- Key Strategic Moves - The action taken by a company to differentiate from its competitor or used as a general strategy is referred to as a key strategic move (KSM). This includes (1) Agreements (2) Expansions (3) Financial Restructuring (4) Mergers and Acquisitions (5) Partnerships, and (6) Product Innovations. Key players (Logistics Service Providers, LSPs) in the market have been shortlisted, their KSM have been studied and presented in this section.
- Logistics Performance - Logistics Performance and Logistics Costs are the backbone of trade, and influences trade costs, making countries compete globally. Logistics performance is influenced by market wide adopted supply chain management strategies, government services, investments & policies, fuel/ energy costs, inflationary environment etc. Hence, in this industry trend, the logistics performance of the geography studied (country/ region as per the scope of report) has been analysed and presented over the review period.
- Manufacturing - This end user industry segment captures the external (outsourced) logistics expenditure incurred by the Manufacturing industry (including Hi-Tech/Technology) players, on Courier, Express, and Parcel (CEP) services. The end user players considered are the establishments primarily engaged in the chemical, mechanical or physical transformation of materials or substances into new products. Logistics Service Providers (LSPs) play a crucial role in maintaining a smooth flow of raw materials across the supply chain, enabling timely delivery of finished goods to distributors or end customers and storing & supplying the raw materials to clients for just-in-time manufacturing.
- Other End Users - Other end user segment captures the external (outsourced) logistics expenditure incurred by the construction, real estate, educational services, and professional services (administrative, waste management, legal, architectural, engineering, design, consulting, scientific R&D), on Courier, Express, and Parcel (CEP) services. Logistics Service Providers (LSPs) plays a crucial role in the reliable movement of time critical supplies and documents to/from these industries such as transporting any equipment or resources required, shipping confidential documents and files.
- Primary Industry - This end user industry segment captures the external (outsourced) logistics expenditure incurred by the AFF (Agriculture, Fishing, and Forestry) and Extraction indsutry (Oil &Gas, Quarrying and Mining) players, on Courier, Express, and Parcel (CEP) services. The end user players considered are the establishments (i) primarily engaged in growing crops, raising animals, harvesting timber, harvesting fish & other animals from their natural habitats and providing related support activities; (ii) that extract naturally occurring mineral solids, such as coal and ores; liquid minerals, such as crude petroleum; and gases, such as natural gas. Herein, Logistics Service Providers (LSPs) (i) play a crucial role in acquisition, storage, handling, transportation, and distribution activities for the optimal & continuous flow of inputs (seeds, pesticides, fertilizers, equipment, and water) from manufacturers or suppliers to the producers and smooth flow of output (produce, agro-goods) to distributors/ consumers; (ii) cover entire phases from upstream to downstream and play a crucial role in the transportation of machinery, drilling equipments, extracted minerals, crude oil & natural gas and refined/ processed products from one place to another. This includes both termperature controlled and non-temperature controlled logistics, as and when required according to the shelf life of goods being transported or stored.
- Producer Price Inflation - It indicates inflation from viewpoint of the producers viz. the average selling price received for their output over a period of time. Annual change (YoY) of producer price index is reported as wholesale price inflation in the "Inflation" industry trend. As WPI captures dynamic price movements in most comprehensive way, it is widely used by governments, banks, industry, business circles and is deemed important in formulation of trade, fiscal and other economic policies. The data has been used in adjunction to consumer price inflation for better understanding the inflationary environment.
- Segmental Revenue - Segmental Revenue has been triangulated or computed and presented for all the major players in the market. It refers to the courier, express, and parcel (CEP) market specific revenue earned by the company, over the base year of study, in the geography studied (country or region as per the scope of report). It is computed through the study and analysis of major parameters like financials, service portfolio, employee strength, fleet size, investments, number of countries present in, major economies of concern, etc. that have been reported by the company in its annual reports, webpage. For companies having scarce financial disclosures, paid databases like D&B Hoovers, Dow Jones Factiva have been resorted to and verified through industry/expert interactions.
- Transport and Storage Sector GDP - Value and growth of Transport and Storage Sector GDP has a direct relation to the freight and logistics market size. Hence, this variable has been studied and presented over the review period, in value terms (USD) and as share % of total GDP, in this industry trend. The data has been supported by concise and relevant commentary around the investments, developments, and current market scenario.
- Trends in E-Commerce Industry - Enhanced internet connectivity and boom in smartphone penetration, coupled with increasing disposable incomes, has led to a phenomenal growth in the e-commerce market globally. Online shoppers require fast and efficient delivery of their orders leading to an increase in the demand for logistics services especially e-commerce fulfilment services. Hence, the Gross Merchandise Value (GMV), historial and projected growth, breakup of major commodity groups in e-commerce industry for the studied geography (country or region as per scope of the report) have been analysed and presented in this industry trend.
- Trends in Manufacturing Industry - Manufacturing industry involves the transformation of raw materials into finished products, while logistics industry ensures the efficient flow of raw materials to the factory, and the transport of manufactured products to the distributors & consumers. Demand-Supply of both industries are highly cross-linked and critical for a seamless supply chain. Hence, the Gross Value Added (GVA), breakup of GVA into major manufacturing sectors, and growth of manufacturing industry over the review period have been analysed and presented, in this industry trend.
- Wholesale and Retail Trade (Offline) - This end user industry segment captures the external (outsourced) logistics expenditure incurred by the wholesalers and retailers, through offline sales channel, on Courier, Express, and Parcel (CEP) services. The end user players considered are the establishments primarily engaged in wholesaling or retailing merchandise, generally without transformation, and rendering services incidental to the sale of merchandise. Logistics Service Providers (LSPs) plays a crucial role in the reliable movement of supplies to and finished products from production houses to the distributors and finally to the end customer covering activites like material sourcing, transportation, order fulfillment, warehousing & storage, demand forecasting, inventory management etc.
| Keyword | Definition |
|---|---|
| Axle Load | The axle load refers to the total load (weight) bearing on the roadway through wheels connected to a given axle. Across the globe, there are systems in place to ensure axle load monitoring, wherein surpassing the defined limits set by the concerned regulatory authority can lead to penalty/fine. For transportation of goods via road this can be an important determinant of costs as knowledge about the axle load limits can be used to (i) load the vehicle optimally for maximizing profits (ii) avoid exceeding the same and hence the probable fines associated (iii) avoid wear and tear of the vehicle (iv) avoid damage to pavement resulting in noticeable public maintenance and repair costs (v) achieve better turnaround time. |
| Back Haul | Backhaul is the return movement of a transport vehicle from its original destination to its original point of departure, and can include full, partial, or empty truck loads (all or part of the way) depending on the visibility of the local freight ecosystem. In this regard, transportation of empty containers to the point of origin, known as deadheading is also a significant factor, considering the supply/container shortages across the geographies, resulting in cost escalation and under optimized profit potential attainment. Generally, the carriers offer discounts on the backhaul, to secure freight for the trip. |
| Bill of Lading (BOL) | A bill of lading is a legal contract document issued by a carrier to a shipper to acknowledge reception of their cargo, and is evidence for the contract of carriage between the two parties. Broadly it details the (i) type, quantity, and other specifications of the goods being carried (ii) destination, and terms & conditions of the shipment (iii) carrier and drivers with all the necessary information to process the shipment, which can be used for insurance and customs clearance purposes (iv) assurance that the consignment is damage-free and ready to be shipped to the consignee. In this regard, a house bill of lading (HBL) is a document issued by a freight forwarder or a non-vessel operating common carrier (NVOCC) to acknowledge receipt of items for shipment (to a shipper). If shipments from several shippers are involved a master bill of lading (MBL) might be involved which is a consolidated version of the same for all the shipments being taken care of by the carrier (to a common destination) and might be issued by the carrier to the freight forwarder or the shipper (depending on who books the transport). |
| Bunkering | Bunkering is the process of supplying fuel to power the propulsion system of a ship. It includes the logistics of loading and distributing the fuel among available shipboard tanks. In this regard, (i) Bunker fuel is technically any type of fuel oil used aboard ships. It gets its name from the containers on ships and in ports that it is stored in; in the days of steam they were coal bunkers but now they are bunker-fuel tanks, (ii) Bunker refers to the spaces (Tank) on board a vessel to store fuel, (iii) Bunker trader refers to a person dealing in trade of bunker (fuel), (iv) Bunker call is made when a cargo ship anchors or berths in a port to take on bunker oil or supplies, (v) Bunkering service is the supply of a requested quality and quantity of bunkers to a ship. Bunkering is signficant from point of view of freight rates applicable to the shipper as Bunker Contribution (BUC)/ Fuel Adjustment Factor (FAF)/ Bunker Adjustment Factor (BAF) are applied by shipping lines to offset the effect of fluctuations in the cost of bunkers. |
| Cabotage | Transport by a vehicle registered in a country, performed on the national territory of another country. Cabotage law may restrict domestic cargo traffic to be carried in its own nationally registered, and sometimes built and crewed vehicles, though regulations vary across industries/commodity groups/countries and sometimes specify maximum allowable percentage of cabotage that can be serviced by foreign registered fleet. |
| C-commerce | Collaborative commerce (also known as C-commerce), (i) describes electronically enabled business interactions among an enterprise’s internal personnel, business partners and customers throughout a trading community (industry, industry segment, supply chain or supply chain segment); (ii) is the optimization of supply and distribution channels to capitalize on the global economy by using new technology efficiently. Advantages of C-commerce, to detail few include (i) maximization of organization's efficiency and profitability (ii) technology integration with physical channels to allow companies to work together (iii) increased information exchange such as inventory and product specifications, using the web as an intermediary (iv) increased competitiveness by reaching a broader audience. Examples of C-commerce, also known as peer-to-peer commerce, include (i) companies that allow consumers to rent things from each other, or marketplaces, such as Meta (formerly Facebook) Marketplace, that allow the sale of used goods; (ii) DoorDash teamed up with many national brands, such as McDonald’s and Chipotle, to offer fast food delivery, building their business model on c-commerce. They have since expanded their delivery service from restaurants to retailers and even offer 'fleets' of drivers to businesses. |
| Courier | A business/company that delivers packages/parcels/shipments (upto 70 kgs) including quick door to door pickup and delivery service for goods or documents, domestically or internationally, on a commercial contract basis. Example, DHL Group, FedEx, United Parcel Service of America, Inc., USPS, International Distributions Services, J&T Express, SF Express among several others |
| Cross docking | Cross docking is a practice in logistics management that includes unloading incoming delivery vehicles and loading the materials directly into outbound delivery vehicles, omitting traditional warehouse logistical practices and saving time and money. It requires close synchronization of both inbound and outbound movements. It is highly significant in reduction of costs pertaining to warehousing & storage (and the associated Value Added Services). |
| Cross Trade | International transport between two different countries performed by a vehicle registered in a third country. A third country is a country other than the country of loading/embarkation and the country of unloading/disembarkation. Cross Trade law may restrict international cargo traffic to be carried by respective country's registered vehicles, and sometimes built and crewed vehicles, though regulations vary across industries/commodity groups/countries and sometimes specify maximum allowable percentage of cross trade that can be serviced by foreign registered fleet. |
| Customs Clearance | The process of declaring and clearing cargoes through customs. It includes the procedures involved in getting cargo released by Customs through designated formalities such as presenting import license/permit, payment of import duties and other required documentations by the nature of the cargo. In this regard, a customs broker is a person or company licensed by the respective department of the country to act on behalf of freight importers and exporters. |
| Dangerous Goods | Dangerous goods (or hazardous materials or HAZMAT) include flammable liquids/solids, gases (compressed, liquified, dissolved under pressure), corrosives, oxidising substances, explosive substances and articles, substances which on contact with water emit flammable gasses, organic peroxides, toxic substances, infectious substances, radioactive materials, miscellaneous dangerous goods and articles. |
| First mile Delivery | First mile delivery refers to the (i) first stage of the freight/shipment/cargo/courier transportation (ii) the transportation of goods from a merchant’s premises or warehouse to the next fulfillment centre/warehouse/hub from where the goods are forwarded (iii) shipping goods from local distribution centers to stores (For retailers) (iv) transportation of finished goods from a plant or a factory to a distribution center (For manufacturers), (v) pick up of goods from the end-customer’s home or store followed by movement to a warehouse or storage location (movers and packers), (vi) process where goods are picked up from a retailer and then transferred to third-party logistics providers or courier service providers to be delivered to the end-consumer (e-commerce). Once the package reaches the next warehouse or the courier’s hub, it is then sorted and transported further until it reaches the customer’s doorstep. Example, if one chooses UPS as a courier, first-mile delivery will be the product being delivered from manufacturer's/retailer's warehouse to the UPS’s warehouse/ fulfilment centre. |
| Last Mile Delivery | Last mile delivery refers to the very last step of the delivery process when a parcel is moved from a transportation hub (warehouse or a distribution center or fulfillment centre) to its final destination, which usually is a personal residence/retail store/ business, or parcel locker. It accounts for around half of the total cost involved in entire process of first mile, middle mile, and last mile delivery, though it can vary shipment to shipment, based on commodity, business model and similar factors. |
| Milkrun | A Milk Run is a delivery method used to transport mixed loads from various suppliers to one customer, using lean management principles applied to logistics. Instead of each supplier sending a truck every week to meet the needs of one customer, one truck (or vehicle) visits the suppliers to pick up the loads for that customer. This method of transport got its name from the dairy industry practice, where one tanker used to collect milk from several dairy farms for delivery to a milk processing company. A milk run can be a more efficient way to handle logistics but require proper planning. If the route involves products from different companies, there is need for an agreement about cost-sharing and other aspects of the cooperative delivery arrangement. Once the group settles these issues, this delivery method can save time and money for everyone by pooling operation costs and resources. |
| Multi country consolidation | Multi-Country Consolidation (MCC) is a cost-effective solution that consolidates one's cargo from different countries of origin to build Full Container Loads (FCL). MCC is most suitable for companies that import light volumes of goods from multiple countries but want to take advantage of the more economic FCL freight rates. Apart from costing some of the other advantages include (i) flexibility to choose suppliers from a wider range of origin countries without worrying about the logistics to final destination from each origin, (ii) ability to pick the most suitable suppliers from many different countries for one's business operations. The increase in one's sourcing options by MCC provides the kind of flexibility needed in competitive global markets. |
| Q-commerce | Q-commerce, also referred to as quick commerce, is a type of e-commerce where emphasis is on quick deliveries, typically in less than an hour. The companies providing Q-Commerce services might have vertically intergrated model or might be using third party delivery platforms (outsourced logistics). It has advantages like (i) competitve USP, (ii) potential to earn greater profit margins, (iii) better customer experience, (iv) guaranteed availability of products, (v) traceability, and (vi) scaleability. |
| ReverseLogistics | Reverse logistics is a type of supply chain management that moves goods from customers back to the sellers or manufacturers and may involve ciruclar economy principles (3Rs) viz. recycling, reuse (repurposing, reselling), reducing or repairing. In this regard, reverse commerce (or Recommerce) is the selling of previously owned items through physical or online marketplaces/distribution channels to buyers who reuse, recycle or resell them. |
Need More Details on Market Definition?
Ask a Question
Research Methodology
Mordor Intelligence follows a four-step methodology in all our reports.
- Step-1: Identify Key Variables: In order to build a robust forecasting methodology, the variables and factors identified in Step-1 are tested against available historical market numbers. Through an iterative process, the variables required for market forecast are set and the model is built on the basis of these variables.
- Step-2: Build a Market Model: Market-size estimations for the forecast years are in nominal terms. Inflation is considered to be a part of the pricing, and the average selling price (ASP) is varying throughout the forecast period for each country
- Step-3: Validate and Finalize: In this important step, all market numbers, variables and analyst calls are validated through an extensive network of primary research experts from the market studied. The respondents are selected across levels and functions to generate a holistic picture of the market studied.
- Step-4: Research Outputs: Syndicated Reports, Custom Consulting Assignments, Databases & Subscription Platforms

Get More Details On Research Methodology
Download PDF


