Market Overview
| Study Period | 2017 - 2030 |
| Base Year For Estimation | 2024 |
| Forecast Data Period | 2025 - 2030 |
| Market Size (2025) | USD 25.32 Billion |
| Market Size (2030) | USD 33.19 Billion |
| Growth Rate (2025 - 2030) | 5.56% CAGR |
| Market Concentration | High |
Major Players*Disclaimer: Major Players sorted in no particular order Image © Mordor Intelligence. Reuse requires attribution under CC BY 4.0. |
|

Maize Seed Market Analysis
The Maize Seed Market size is estimated at 25.32 billion USD in 2025, and is expected to reach 33.19 billion USD by 2030, growing at a CAGR of 5.56% during the forecast period (2025-2030).
The maize seed market industry has witnessed significant transformation in recent years, with maize seeds commanding a dominant 65% share of the global grain and cereal seeds market in 2022. This dominance reflects the crop's critical role in global food security and its versatility across various applications, from human consumption to animal feed and industrial uses. The industry has seen substantial technological advancements in seed development, particularly in genetic modification and hybrid breeding techniques. Private sector investments in research and development have accelerated, focusing on developing varieties that offer higher yields and better resistance to environmental stresses. These developments have been particularly crucial in addressing global food security concerns and meeting the rising demand for sustainable agricultural practices.
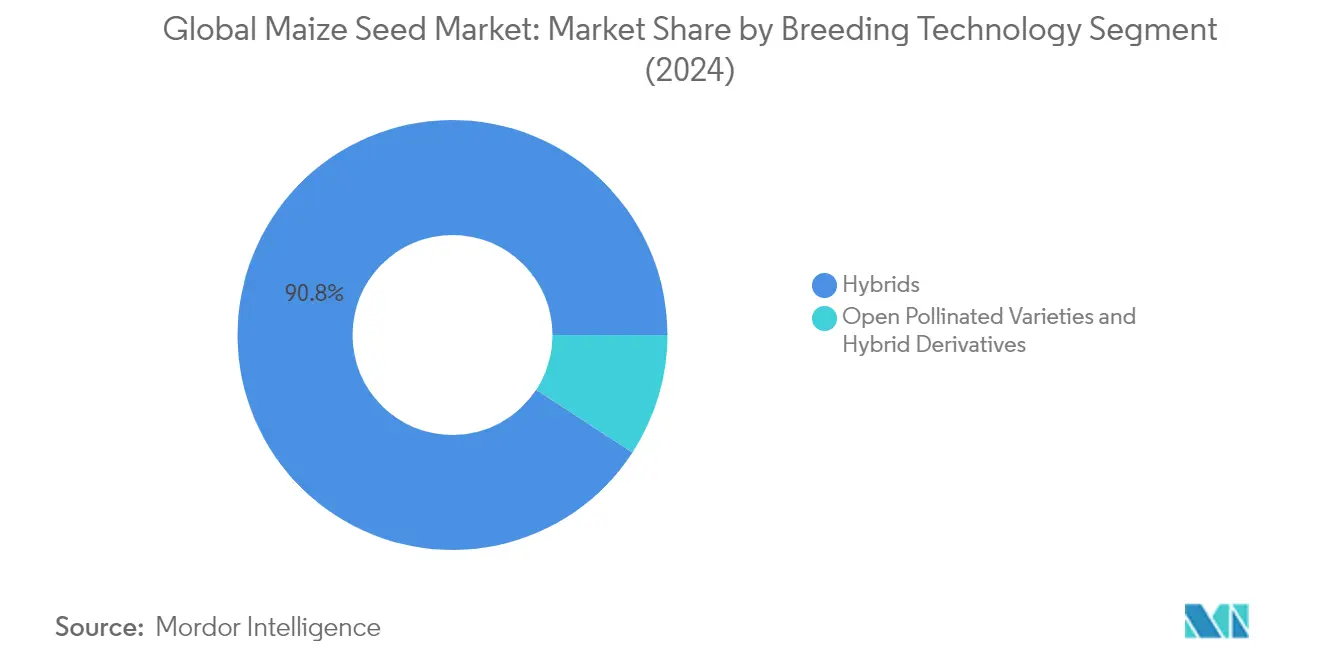
The hybrid seed segment has emerged as a cornerstone of the maize seed market, accounting for 90.8% of the global market value in 2022. This overwhelming preference for hybrid corn seed stems from its superior performance characteristics, including enhanced yield potential, disease resistance, and adaptability to diverse growing conditions. Seed companies are increasingly investing in advanced breeding technologies and biotechnology tools to develop improved hybrid varieties. The industry has witnessed a notable shift towards sustainable agriculture practices, with seed companies focusing on developing varieties that require fewer chemical inputs while maintaining high productivity levels.
A significant industry trend has been the growing emphasis on weed management solutions, as weeds are estimated to reduce crop production and affect growers' profits by 30-40%. This has led to increased development and adoption of herbicide-tolerant varieties and integrated weed management solutions. The industry has also seen a rising focus on drought-tolerant and climate-resilient varieties, responding to global climate change concerns. Seed companies are increasingly incorporating traits for stress tolerance, disease resistance, and improved nutritional content in their breeding programs, addressing both agricultural and nutritional security needs.
The industry landscape is evolving with increasing emphasis on sustainable and environmentally friendly farming practices. Non-transgenic hybrid maize seed has gained significant attention due to growing consumer preference for non-GMO products and stricter regulations in various markets. The sector has witnessed substantial investments in precision breeding technologies and molecular markers to develop improved varieties without genetic modification. Companies are also focusing on developing varieties with enhanced nitrogen use efficiency and better adaptation to conservation agriculture practices, aligning with global sustainability goals. These developments are complemented by increasing digitalization in seed development and distribution, with companies leveraging data analytics and artificial intelligence for more efficient breeding programs.
Global Maize Seed Market Trends
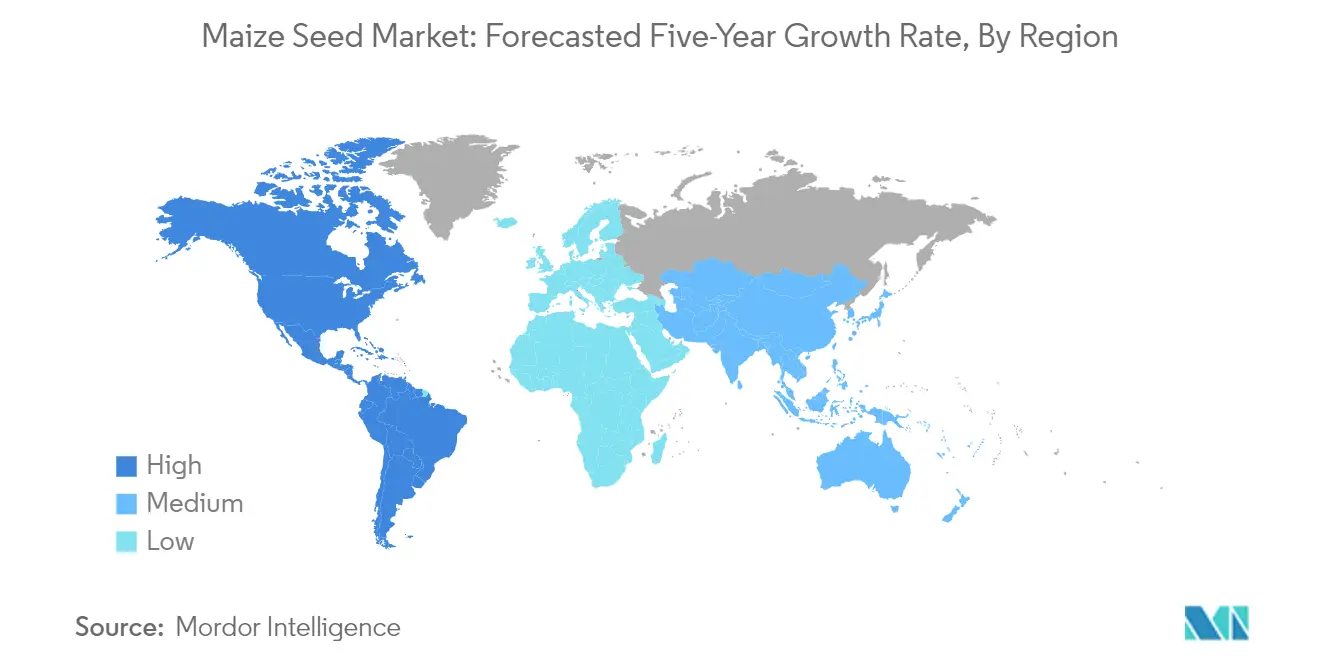
The Asia-Pacific dominates global maize cultivation due to favorable market prices and conducive geographical conditions
- Maize is the most versatile cereal crop known for its adaptability, diverse types, and wide-ranging use. It is the second most cultivated crop globally, mainly in tropical, sand subtropical, and temperate climates. Its global cultivation encompasses various types, including field corn, sweet corn, popcorn, and baby corn. In 2022, maize production crossed 1.21 billion metric ton, spread across 208.9 million hectares in over 170 countries, with an average yield of 5.87 metric ton. Driven by a growing global population and rising incomes, the demand for maize for human consumption and livestock feed has surged. This surge has prompted farmers to expand their maize cultivation areas, resulting in a 5.5% increase in acreage between 2017 and 2022.
- Asia-Pacific dominates global corn production, accounting for 32.4% of the global maize cultivation area in 2022. This marked a 0.9% increase from 2017 to 2022. Corn has the highest acreage in the region, with the region's expansion of maize cultivation area fueled by favorable market prices and the promise of profitability.
- In 2022, North America accounted for the second-largest maize cultivation acreage, with a dedicated 45.6 million hectares. This represented a 3.3% increase over the historic period. The surge in access to global markets and the demand for corn from international buyers were key drivers behind this expansion. Between 2017 and 2022, Europe witnessed a notable rise in maize cultivation area, from 18.1 million to 21.1 million hectares. This uptick was particularly pronounced in the spring of 2021, buoyed by favorable weather conditions in major maize-producing nations and a price rise.
- Therefore, favorable climatic conditions and market prices are estimated to drive the expansion of maize cultivation globally.

Understand The Key Trends Shaping This Market
Download PDF
Drought tolerance, disease resistance, and wider adaptability are the major traits being purchased by farmers for meeting the global corn production demand
- The United States, Mexico, and China are key global players in corn production. This crop holds significant value for growers, given its high profitability and the demand for specific traits. Growers seek traits like weed control, enhanced grain quality, early maturity, lodging tolerance, disease resistance (e.g., leaf curl, early rots), and wider adaptability to diverse agro-climatic conditions. Notably, companies like Bayer AG, KWS SAAT SE & KGaA, and Syngenta are offering traits that combat early rots and leaf diseases and boost productivity. These traits are in high demand as no other sprays or alternatives effectively tackle these diseases. Additionally, traits like color, height, and grain count per cob are favored by growers in the Asia-Pacific.
- Growers also prioritize traits like insect resistance and adaptability to safeguard against prevalent pests like moths (e.g., cutworms, armyworms, and borers) and beetles (e.g., grubs and weevils). They also value traits that enable off-season growth and adaptability to diverse soil conditions. Notable product brands like Winfield and Deklab offer corn varieties with these traits. In Europe, there is a rising demand for lodging-resistant varieties, as they can withstand adverse weather conditions and minimize crop losses. Corteva Agriscience's offerings, such as P7179 and P7326, are known for their enhanced standability in strong winds.
- Challenges like water scarcity due to climatic conditions, pests, and diseases impacting corn growth are expected to drive the introduction of new seed varieties and fuel market growth in the coming years.

OTHER KEY INDUSTRY TRENDS COVERED IN THE REPORT
- Transgenic corn hybrids hold a high share globally for their higher yield and ease of cultivation due to their resistance to pests and weeds
Segment Analysis: Breeding Technology
Hybrids Segment in Global Maize Seed Market
Hybrids dominate the global maize seed market, commanding approximately 91% of the total market share in 2024. This significant market position is attributed to hybrids' superior characteristics, including higher resistance to diseases, enhanced drought tolerance, and improved grain quality for processing industries. The segment's dominance is particularly strong in major markets like North America and South America, where adoption rates are nearly 100% due to the extensive availability of both transgenic and non-transgenic hybrid varieties. Non-transgenic hybrids account for about 42% of the hybrid segment, driven by growing consumer demand for non-GMO corn seed products and strict regulations in several countries regarding GMO usage. Meanwhile, GMO corn seed hybrids, comprising both herbicide-tolerant and insect-resistant varieties, represent the remaining portion, with a particularly strong presence in markets like the United States, Brazil, and Argentina. The demand for hybrid corn seed continues to grow as these seeds offer substantial benefits to commercial corn seed producers.
Open Pollinated Varieties & Hybrid Derivatives Segment in Global Maize Seed Market
The Open Pollinated Varieties (OPV) and Hybrid Derivatives segment is experiencing robust growth, projected to expand at approximately 6% CAGR from 2024 to 2029. This growth trajectory is primarily driven by increasing demand from small-scale farmers in developing regions who prefer these varieties due to their lower input costs compared to hybrids. The segment's expansion is further supported by rising interest in organic corn seed cultivation practices and the varieties' better adaptability to local conditions. These seeds are gaining particular traction in regions with limited access to advanced agricultural technologies or where farmers prefer to save seeds for subsequent seasons. The segment is also benefiting from ongoing research and development efforts to improve the performance and yield potential of open-pollinated varieties, making them more competitive with hybrid options while maintaining their cost advantage. The preference for conventional corn seed among traditional farmers also contributes to this segment's growth.
Maize Seed Market Geography Segment Analysis
Maize Seed Market in Africa
Africa represents a significant market for maize seeds, with the crop serving as a dietary mainstay for over 50% of the population, sustaining more than 300 million people. The region's maize seed market spans diverse countries, including South Africa, Nigeria, Egypt, Tanzania, Ethiopia, Kenya, and Ghana. Each country brings unique agricultural practices and market dynamics, influenced by factors such as climate conditions, farming techniques, and local demand patterns. The region's growth is driven by escalating consumption, expanding cultivation areas, and rising demand from both feed and processing sectors.
Maize Seed Market in South Africa
South Africa dominates the African corn seed market, holding approximately a 40% market share in 2024. The country stands apart from other African nations due to its larger cultivable land and the approval of genetically modified (GM) corn. South African farmers benefit from the availability of hybrid varieties specifically tailored to local conditions, introduced by global players. The Northern Cape province leads in production, followed by the Free State, Eastern Cape, and North West, while Limpopo and Gauteng maintain a comparatively smaller share. The country's advanced agricultural infrastructure and strong research capabilities have helped maintain its position as the continent's leading maize producer.
Maize Seed Market in Saudi Arabia
Saudi Arabia emerges as the fastest-growing market in Africa, projected to grow at approximately 12% during 2024-2029. The country's rapid growth is attributed to the increasing adoption of improved seeds, rising market prices, and growing demand from neighboring countries for ethanol. The government's focus on modernizing agricultural practices, including advanced irrigation systems and mechanized farming techniques, has created a conducive environment for market expansion. Despite challenging climatic conditions, farmers are increasingly adopting high-yielding hybrid varieties, particularly those with enhanced drought tolerance capabilities. This trend underscores the potential for field corn seed to support agricultural resilience in the region.
Get Analysis on Important Geographic Markets
Download PDF
Maize Seed Industry Overview
Top Companies in Maize Seed Market
The global corn seed market is characterized by intense competition and continuous innovation among major players. Companies are heavily investing in research and development to introduce new hybrid varieties with enhanced traits like disease resistance, drought tolerance, and higher yield potential. Strategic moves in the industry primarily focus on expanding production capacities, strengthening distribution networks, and establishing research facilities in key agricultural regions. Market leaders are actively pursuing geographical expansion through new facility establishments and partnerships with local distributors. Product innovation remains the dominant strategy, with companies regularly launching new seed varieties adapted to specific regional conditions and incorporating advanced biotechnology traits. Operational agility is demonstrated through investments in digital farming solutions, precision agriculture technologies, and integrated crop management systems to provide comprehensive solutions to farmers.
Consolidated Market Led By Global Players
The maize seed market exhibits a highly consolidated structure dominated by large multinational corporations with extensive research capabilities and global distribution networks. These major players leverage their substantial research and development infrastructure, established brand presence, and comprehensive product portfolios to maintain their market positions. The industry is characterized by the presence of both diversified agricultural conglomerates that offer complete farming solutions and specialized seed companies focusing exclusively on seed development and distribution. Regional players maintain significance in specific markets through their understanding of local farming conditions and established relationships with farming communities.
The competitive landscape shows limited merger and acquisition activity, with companies preferring organic growth through capacity expansion and product development. Market leaders focus on strengthening their positions through strategic collaborations with research institutions, technology providers, and local agricultural organizations. The barrier to entry remains high due to significant investments required in research and development, regulatory compliance, and establishment of distribution networks. Local players often operate as distributors or licensees for global companies, creating a symbiotic relationship that benefits both parties while maintaining market stability.
Innovation and Adaptation Drive Future Success
Success in the corn seed market increasingly depends on companies' ability to develop varieties that address emerging challenges like climate change, evolving pest resistance, and changing consumer preferences. Market leaders must continue investing in advanced breeding technologies, including genetic modification and gene editing, while also maintaining traditional breeding programs to serve diverse market segments. Companies need to focus on developing integrated solutions that combine high-performing seeds with complementary agricultural inputs and digital farming tools. Building strong relationships with farmers through extensive technical support and education programs will become increasingly crucial for maintaining market share.
For emerging players and challengers, success lies in identifying and serving niche markets with specialized products or focusing on regions underserved by major companies. Developing varieties specifically adapted to local conditions and meeting specific end-user requirements can provide competitive advantages. Companies must also prepare for potential regulatory changes regarding genetic modification and seed certification while maintaining flexibility in their breeding programs. The increasing focus on sustainable agriculture and environmental concerns presents opportunities for companies to develop eco-friendly varieties that require fewer inputs. Building strong distribution networks and establishing credibility through consistent product performance will be crucial for gaining market share. Additionally, the exploration of corn germplasm and conducting corn seed analysis are pivotal in driving innovation and meeting the specific needs of different regions.
Maize Seed Market Leaders
-
Advanta Seeds - UPL
-
Bayer AG
-
Corteva Agriscience
-
KWS SAAT SE & Co. KGaA
-
Syngenta Group
- *Disclaimer: Major Players sorted in no particular order

Need More Details on Market Players and Competitors?
Download PDF
Maize Seed Market News
- August 2023: Bayer AG launched the herbicide-tolerant biotech corn Dekalb DK95R in Banggo village, Manggalewa district, Dompu Regency, West Nusa Tenggara, Indonesia.
- March 2023: Corteva Agriscience introduced gene-editing technology for added protection to corn hybrids, which helps in providing resistance to multiple diseases.
- March 2023: Pioneer Seeds, a subsidiary of Corteva Agriscience, launched 44 new corn seed hybrid varieties with new Vorceed Enlist corn technology to help manage corn rootworms.
Free With This Report
We provide a complimentary and exhaustive set of data points on regional and country-level metrics that present the fundamental structure of the industry. Presented in the form of 90+ free charts, the section covers difficult-to-find data from various regions regarding the area under cultivation for different crops within the scope


List of Tables & Figures
- Figure 1:
- AREA UNDER CULTIVATION OF CORN, HECTARE, GLOBAL, 2017-2022
- Figure 2:
- VALUE SHARE OF MAJOR CORN TRAITS, %, GLOBAL, 2022
- Figure 3:
- VALUE SHARE OF CORN BREEDING TECHNIQUES, %, GLOBAL, 2022
- Figure 4:
- VOLUME OF CORN SEED, METRIC TON, GLOBAL, 2017 - 2030
- Figure 5:
- VALUE OF CORN SEED, USD, GLOBAL, 2017 - 2030
- Figure 6:
- VOLUME OF CORN SEED BY BREEDING TECHNOLOGY CATEGORIES, METRIC TON, GLOBAL, 2017 - 2030
- Figure 7:
- VALUE OF CORN SEED BY BREEDING TECHNOLOGY CATEGORIES, USD, GLOBAL, 2017 - 2030
- Figure 8:
- VOLUME SHARE OF CORN SEED BY BREEDING TECHNOLOGY CATEGORIES, %, GLOBAL, 2017 VS 2023 VS 2030
- Figure 9:
- VALUE SHARE OF CORN SEED BY BREEDING TECHNOLOGY CATEGORIES, %, GLOBAL, 2017 VS 2023 VS 2030
- Figure 10:
- VOLUME OF CORN SEED BY HYBRIDS CATEGORIES, METRIC TON, GLOBAL, 2017 - 2030
- Figure 11:
- VALUE OF CORN SEED BY HYBRIDS CATEGORIES, USD, GLOBAL, 2017 - 2030
- Figure 12:
- VOLUME SHARE OF CORN SEED BY HYBRIDS CATEGORIES, %, GLOBAL, 2017 VS 2023 VS 2030
- Figure 13:
- VALUE SHARE OF CORN SEED BY HYBRIDS CATEGORIES, %, GLOBAL, 2017 VS 2023 VS 2030
- Figure 14:
- VOLUME OF NON-TRANSGENIC HYBRIDS CORN SEED, METRIC TON, GLOBAL, 2017 - 2030
- Figure 15:
- VALUE OF NON-TRANSGENIC HYBRIDS CORN SEED, USD, GLOBAL, 2017 - 2030
- Figure 16:
- VALUE SHARE OF NON-TRANSGENIC HYBRIDS CORN SEED BY COUNTRY, %, GLOBAL, 2023 AND 2030
- Figure 17:
- VOLUME OF CORN SEED BY TRANSGENIC HYBRIDS CATEGORIES, METRIC TON, GLOBAL, 2017 - 2030
- Figure 18:
- VALUE OF CORN SEED BY TRANSGENIC HYBRIDS CATEGORIES, USD, GLOBAL, 2017 - 2030
- Figure 19:
- VOLUME SHARE OF CORN SEED BY TRANSGENIC HYBRIDS CATEGORIES, %, GLOBAL, 2017 VS 2023 VS 2030
- Figure 20:
- VALUE SHARE OF CORN SEED BY TRANSGENIC HYBRIDS CATEGORIES, %, GLOBAL, 2017 VS 2023 VS 2030
- Figure 21:
- VOLUME OF HERBICIDE TOLERANT HYBRIDS CORN SEED, METRIC TON, GLOBAL, 2017 - 2030
- Figure 22:
- VALUE OF HERBICIDE TOLERANT HYBRIDS CORN SEED, USD, GLOBAL, 2017 - 2030
- Figure 23:
- VALUE SHARE OF HERBICIDE TOLERANT HYBRIDS CORN SEED BY COUNTRY, %, GLOBAL, 2023 AND 2030
- Figure 24:
- VOLUME OF INSECT RESISTANT HYBRIDS CORN SEED, METRIC TON, GLOBAL, 2017 - 2030
- Figure 25:
- VALUE OF INSECT RESISTANT HYBRIDS CORN SEED, USD, GLOBAL, 2017 - 2030
- Figure 26:
- VALUE SHARE OF INSECT RESISTANT HYBRIDS CORN SEED BY COUNTRY, %, GLOBAL, 2023 AND 2030
- Figure 27:
- VOLUME OF OTHER TRAITS CORN SEED, METRIC TON, GLOBAL, 2017 - 2030
- Figure 28:
- VALUE OF OTHER TRAITS CORN SEED, USD, GLOBAL, 2017 - 2030
- Figure 29:
- VALUE SHARE OF OTHER TRAITS CORN SEED BY COUNTRY, %, GLOBAL, 2023 AND 2030
- Figure 30:
- VOLUME OF OPEN POLLINATED VARIETIES & HYBRID DERIVATIVES CORN SEED, METRIC TON, GLOBAL, 2017 - 2030
- Figure 31:
- VALUE OF OPEN POLLINATED VARIETIES & HYBRID DERIVATIVES CORN SEED, USD, GLOBAL, 2017 - 2030
- Figure 32:
- VALUE SHARE OF OPEN POLLINATED VARIETIES & HYBRID DERIVATIVES CORN SEED BY COUNTRY, %, GLOBAL, 2023 AND 2030
- Figure 33:
- VOLUME OF CORN SEED BY REGION, METRIC TON, GLOBAL, 2017 - 2030
- Figure 34:
- VALUE OF CORN SEED BY REGION, USD, GLOBAL, 2017 - 2030
- Figure 35:
- VOLUME SHARE OF CORN SEED BY REGION, %, GLOBAL, 2017 VS 2023 VS 2030
- Figure 36:
- VALUE SHARE OF CORN SEED BY REGION, %, GLOBAL, 2017 VS 2023 VS 2030
- Figure 37:
- VOLUME OF CORN SEED BY BREEDING TECHNOLOGY CATEGORIES, METRIC TON, AFRICA, 2017 - 2030
- Figure 38:
- VALUE OF CORN SEED BY BREEDING TECHNOLOGY CATEGORIES, USD, AFRICA, 2017 - 2030
- Figure 39:
- VOLUME SHARE OF CORN SEED BY BREEDING TECHNOLOGY CATEGORIES, %, AFRICA, 2017 VS 2023 VS 2030
- Figure 40:
- VALUE SHARE OF CORN SEED BY BREEDING TECHNOLOGY CATEGORIES, %, AFRICA, 2017 VS 2023 VS 2030
- Figure 41:
- VOLUME OF CORN SEED BY COUNTRY, METRIC TON, AFRICA, 2017 - 2030
- Figure 42:
- VALUE OF CORN SEED BY COUNTRY, USD, AFRICA, 2017 - 2030
- Figure 43:
- VOLUME SHARE OF CORN SEED BY COUNTRY, %, AFRICA, 2017 VS 2023 VS 2030
- Figure 44:
- VALUE SHARE OF CORN SEED BY COUNTRY, %, AFRICA, 2017 VS 2023 VS 2030
- Figure 45:
- VOLUME OF EGYPT CORN SEED, METRIC TON, AFRICA, 2017 - 2030
- Figure 46:
- VALUE OF EGYPT CORN SEED, USD, AFRICA, 2017 - 2030
- Figure 47:
- VALUE SHARE OF EGYPT CORN SEED BY BREEDING TECHNOLOGY, %, AFRICA, 2023 AND 2030
- Figure 48:
- VOLUME OF ETHIOPIA CORN SEED, METRIC TON, AFRICA, 2017 - 2030
- Figure 49:
- VALUE OF ETHIOPIA CORN SEED, USD, AFRICA, 2017 - 2030
- Figure 50:
- VALUE SHARE OF ETHIOPIA CORN SEED BY BREEDING TECHNOLOGY, %, AFRICA, 2023 AND 2030
- Figure 51:
- VOLUME OF GHANA CORN SEED, METRIC TON, AFRICA, 2017 - 2030
- Figure 52:
- VALUE OF GHANA CORN SEED, USD, AFRICA, 2017 - 2030
- Figure 53:
- VALUE SHARE OF GHANA CORN SEED BY BREEDING TECHNOLOGY, %, AFRICA, 2023 AND 2030
- Figure 54:
- VOLUME OF KENYA CORN SEED, METRIC TON, AFRICA, 2017 - 2030
- Figure 55:
- VALUE OF KENYA CORN SEED, USD, AFRICA, 2017 - 2030
- Figure 56:
- VALUE SHARE OF KENYA CORN SEED BY BREEDING TECHNOLOGY, %, AFRICA, 2023 AND 2030
- Figure 57:
- VOLUME OF NIGERIA CORN SEED, METRIC TON, AFRICA, 2017 - 2030
- Figure 58:
- VALUE OF NIGERIA CORN SEED, USD, AFRICA, 2017 - 2030
- Figure 59:
- VALUE SHARE OF NIGERIA CORN SEED BY BREEDING TECHNOLOGY, %, AFRICA, 2023 AND 2030
- Figure 60:
- VOLUME OF SOUTH AFRICA CORN SEED, METRIC TON, AFRICA, 2017 - 2030
- Figure 61:
- VALUE OF SOUTH AFRICA CORN SEED, USD, AFRICA, 2017 - 2030
- Figure 62:
- VALUE SHARE OF SOUTH AFRICA CORN SEED BY BREEDING TECHNOLOGY, %, AFRICA, 2023 AND 2030
- Figure 63:
- VOLUME OF TANZANIA CORN SEED, METRIC TON, AFRICA, 2017 - 2030
- Figure 64:
- VALUE OF TANZANIA CORN SEED, USD, AFRICA, 2017 - 2030
- Figure 65:
- VALUE SHARE OF TANZANIA CORN SEED BY BREEDING TECHNOLOGY, %, AFRICA, 2023 AND 2030
- Figure 66:
- VOLUME OF REST OF AFRICA CORN SEED, METRIC TON, AFRICA, 2017 - 2030
- Figure 67:
- VALUE OF REST OF AFRICA CORN SEED, USD, AFRICA, 2017 - 2030
- Figure 68:
- VALUE SHARE OF REST OF AFRICA CORN SEED BY BREEDING TECHNOLOGY, %, AFRICA, 2023 AND 2030
- Figure 69:
- VOLUME OF CORN SEED BY BREEDING TECHNOLOGY CATEGORIES, METRIC TON, ASIA-PACIFIC, 2017 - 2030
- Figure 70:
- VALUE OF CORN SEED BY BREEDING TECHNOLOGY CATEGORIES, USD, ASIA-PACIFIC, 2017 - 2030
- Figure 71:
- VOLUME SHARE OF CORN SEED BY BREEDING TECHNOLOGY CATEGORIES, %, ASIA-PACIFIC, 2017 VS 2023 VS 2030
- Figure 72:
- VALUE SHARE OF CORN SEED BY BREEDING TECHNOLOGY CATEGORIES, %, ASIA-PACIFIC, 2017 VS 2023 VS 2030
- Figure 73:
- VOLUME OF CORN SEED BY COUNTRY, METRIC TON, ASIA-PACIFIC, 2017 - 2030
- Figure 74:
- VALUE OF CORN SEED BY COUNTRY, USD, ASIA-PACIFIC, 2017 - 2030
- Figure 75:
- VOLUME SHARE OF CORN SEED BY COUNTRY, %, ASIA-PACIFIC, 2017 VS 2023 VS 2030
- Figure 76:
- VALUE SHARE OF CORN SEED BY COUNTRY, %, ASIA-PACIFIC, 2017 VS 2023 VS 2030
- Figure 77:
- VOLUME OF AUSTRALIA CORN SEED, METRIC TON, ASIA-PACIFIC, 2017 - 2030
- Figure 78:
- VALUE OF AUSTRALIA CORN SEED, USD, ASIA-PACIFIC, 2017 - 2030
- Figure 79:
- VALUE SHARE OF AUSTRALIA CORN SEED BY BREEDING TECHNOLOGY, %, ASIA-PACIFIC, 2023 AND 2030
- Figure 80:
- VOLUME OF BANGLADESH CORN SEED, METRIC TON, ASIA-PACIFIC, 2017 - 2030
- Figure 81:
- VALUE OF BANGLADESH CORN SEED, USD, ASIA-PACIFIC, 2017 - 2030
- Figure 82:
- VALUE SHARE OF BANGLADESH CORN SEED BY BREEDING TECHNOLOGY, %, ASIA-PACIFIC, 2023 AND 2030
- Figure 83:
- VOLUME OF CHINA CORN SEED, METRIC TON, ASIA-PACIFIC, 2017 - 2030
- Figure 84:
- VALUE OF CHINA CORN SEED, USD, ASIA-PACIFIC, 2017 - 2030
- Figure 85:
- VALUE SHARE OF CHINA CORN SEED BY BREEDING TECHNOLOGY, %, ASIA-PACIFIC, 2023 AND 2030
- Figure 86:
- VOLUME OF INDIA CORN SEED, METRIC TON, ASIA-PACIFIC, 2017 - 2030
- Figure 87:
- VALUE OF INDIA CORN SEED, USD, ASIA-PACIFIC, 2017 - 2030
- Figure 88:
- VALUE SHARE OF INDIA CORN SEED BY BREEDING TECHNOLOGY, %, ASIA-PACIFIC, 2023 AND 2030
- Figure 89:
- VOLUME OF INDONESIA CORN SEED, METRIC TON, ASIA-PACIFIC, 2017 - 2030
- Figure 90:
- VALUE OF INDONESIA CORN SEED, USD, ASIA-PACIFIC, 2017 - 2030
- Figure 91:
- VALUE SHARE OF INDONESIA CORN SEED BY BREEDING TECHNOLOGY, %, ASIA-PACIFIC, 2023 AND 2030
- Figure 92:
- VOLUME OF JAPAN CORN SEED, METRIC TON, ASIA-PACIFIC, 2017 - 2030
- Figure 93:
- VALUE OF JAPAN CORN SEED, USD, ASIA-PACIFIC, 2017 - 2030
- Figure 94:
- VALUE SHARE OF JAPAN CORN SEED BY BREEDING TECHNOLOGY, %, ASIA-PACIFIC, 2023 AND 2030
- Figure 95:
- VOLUME OF MYANMAR CORN SEED, METRIC TON, ASIA-PACIFIC, 2017 - 2030
- Figure 96:
- VALUE OF MYANMAR CORN SEED, USD, ASIA-PACIFIC, 2017 - 2030
- Figure 97:
- VALUE SHARE OF MYANMAR CORN SEED BY BREEDING TECHNOLOGY, %, ASIA-PACIFIC, 2023 AND 2030
- Figure 98:
- VOLUME OF PAKISTAN CORN SEED, METRIC TON, ASIA-PACIFIC, 2017 - 2030
- Figure 99:
- VALUE OF PAKISTAN CORN SEED, USD, ASIA-PACIFIC, 2017 - 2030
- Figure 100:
- VALUE SHARE OF PAKISTAN CORN SEED BY BREEDING TECHNOLOGY, %, ASIA-PACIFIC, 2023 AND 2030
- Figure 101:
- VOLUME OF PHILIPPINES CORN SEED, METRIC TON, ASIA-PACIFIC, 2017 - 2030
- Figure 102:
- VALUE OF PHILIPPINES CORN SEED, USD, ASIA-PACIFIC, 2017 - 2030
- Figure 103:
- VALUE SHARE OF PHILIPPINES CORN SEED BY BREEDING TECHNOLOGY, %, ASIA-PACIFIC, 2023 AND 2030
- Figure 104:
- VOLUME OF THAILAND CORN SEED, METRIC TON, ASIA-PACIFIC, 2017 - 2030
- Figure 105:
- VALUE OF THAILAND CORN SEED, USD, ASIA-PACIFIC, 2017 - 2030
- Figure 106:
- VALUE SHARE OF THAILAND CORN SEED BY BREEDING TECHNOLOGY, %, ASIA-PACIFIC, 2023 AND 2030
- Figure 107:
- VOLUME OF VIETNAM CORN SEED, METRIC TON, ASIA-PACIFIC, 2017 - 2030
- Figure 108:
- VALUE OF VIETNAM CORN SEED, USD, ASIA-PACIFIC, 2017 - 2030
- Figure 109:
- VALUE SHARE OF VIETNAM CORN SEED BY BREEDING TECHNOLOGY, %, ASIA-PACIFIC, 2023 AND 2030
- Figure 110:
- VOLUME OF REST OF ASIA-PACIFIC CORN SEED, METRIC TON, ASIA-PACIFIC, 2017 - 2030
- Figure 111:
- VALUE OF REST OF ASIA-PACIFIC CORN SEED, USD, ASIA-PACIFIC, 2017 - 2030
- Figure 112:
- VALUE SHARE OF REST OF ASIA-PACIFIC CORN SEED BY BREEDING TECHNOLOGY, %, ASIA-PACIFIC, 2023 AND 2030
- Figure 113:
- VOLUME OF CORN SEED BY BREEDING TECHNOLOGY CATEGORIES, METRIC TON, EUROPE, 2017 - 2030
- Figure 114:
- VALUE OF CORN SEED BY BREEDING TECHNOLOGY CATEGORIES, USD, EUROPE, 2017 - 2030
- Figure 115:
- VOLUME SHARE OF CORN SEED BY BREEDING TECHNOLOGY CATEGORIES, %, EUROPE, 2017 VS 2023 VS 2030
- Figure 116:
- VALUE SHARE OF CORN SEED BY BREEDING TECHNOLOGY CATEGORIES, %, EUROPE, 2017 VS 2023 VS 2030
- Figure 117:
- VOLUME OF CORN SEED BY COUNTRY, METRIC TON, EUROPE, 2017 - 2030
- Figure 118:
- VALUE OF CORN SEED BY COUNTRY, USD, EUROPE, 2017 - 2030
- Figure 119:
- VOLUME SHARE OF CORN SEED BY COUNTRY, %, EUROPE, 2017 VS 2023 VS 2030
- Figure 120:
- VALUE SHARE OF CORN SEED BY COUNTRY, %, EUROPE, 2017 VS 2023 VS 2030
- Figure 121:
- VOLUME OF FRANCE CORN SEED, METRIC TON, EUROPE, 2017 - 2030
- Figure 122:
- VALUE OF FRANCE CORN SEED, USD, EUROPE, 2017 - 2030
- Figure 123:
- VALUE SHARE OF FRANCE CORN SEED BY BREEDING TECHNOLOGY, %, EUROPE, 2023 AND 2030
- Figure 124:
- VOLUME OF GERMANY CORN SEED, METRIC TON, EUROPE, 2017 - 2030
- Figure 125:
- VALUE OF GERMANY CORN SEED, USD, EUROPE, 2017 - 2030
- Figure 126:
- VALUE SHARE OF GERMANY CORN SEED BY BREEDING TECHNOLOGY, %, EUROPE, 2023 AND 2030
- Figure 127:
- VOLUME OF ITALY CORN SEED, METRIC TON, EUROPE, 2017 - 2030
- Figure 128:
- VALUE OF ITALY CORN SEED, USD, EUROPE, 2017 - 2030
- Figure 129:
- VALUE SHARE OF ITALY CORN SEED BY BREEDING TECHNOLOGY, %, EUROPE, 2023 AND 2030
- Figure 130:
- VOLUME OF NETHERLANDS CORN SEED, METRIC TON, EUROPE, 2017 - 2030
- Figure 131:
- VALUE OF NETHERLANDS CORN SEED, USD, EUROPE, 2017 - 2030
- Figure 132:
- VALUE SHARE OF NETHERLANDS CORN SEED BY BREEDING TECHNOLOGY, %, EUROPE, 2023 AND 2030
- Figure 133:
- VOLUME OF POLAND CORN SEED, METRIC TON, EUROPE, 2017 - 2030
- Figure 134:
- VALUE OF POLAND CORN SEED, USD, EUROPE, 2017 - 2030
- Figure 135:
- VALUE SHARE OF POLAND CORN SEED BY BREEDING TECHNOLOGY, %, EUROPE, 2023 AND 2030
- Figure 136:
- VOLUME OF ROMANIA CORN SEED, METRIC TON, EUROPE, 2017 - 2030
- Figure 137:
- VALUE OF ROMANIA CORN SEED, USD, EUROPE, 2017 - 2030
- Figure 138:
- VALUE SHARE OF ROMANIA CORN SEED BY BREEDING TECHNOLOGY, %, EUROPE, 2023 AND 2030
- Figure 139:
- VOLUME OF RUSSIA CORN SEED, METRIC TON, EUROPE, 2017 - 2030
- Figure 140:
- VALUE OF RUSSIA CORN SEED, USD, EUROPE, 2017 - 2030
- Figure 141:
- VALUE SHARE OF RUSSIA CORN SEED BY BREEDING TECHNOLOGY, %, EUROPE, 2023 AND 2030
- Figure 142:
- VOLUME OF SPAIN CORN SEED, METRIC TON, EUROPE, 2017 - 2030
- Figure 143:
- VALUE OF SPAIN CORN SEED, USD, EUROPE, 2017 - 2030
- Figure 144:
- VALUE SHARE OF SPAIN CORN SEED BY BREEDING TECHNOLOGY, %, EUROPE, 2023 AND 2030
- Figure 145:
- VOLUME OF TURKEY CORN SEED, METRIC TON, EUROPE, 2017 - 2030
- Figure 146:
- VALUE OF TURKEY CORN SEED, USD, EUROPE, 2017 - 2030
- Figure 147:
- VALUE SHARE OF TURKEY CORN SEED BY BREEDING TECHNOLOGY, %, EUROPE, 2023 AND 2030
- Figure 148:
- VOLUME OF UKRAINE CORN SEED, METRIC TON, EUROPE, 2017 - 2030
- Figure 149:
- VALUE OF UKRAINE CORN SEED, USD, EUROPE, 2017 - 2030
- Figure 150:
- VALUE SHARE OF UKRAINE CORN SEED BY BREEDING TECHNOLOGY, %, EUROPE, 2023 AND 2030
- Figure 151:
- VOLUME OF UNITED KINGDOM CORN SEED, METRIC TON, EUROPE, 2017 - 2030
- Figure 152:
- VALUE OF UNITED KINGDOM CORN SEED, USD, EUROPE, 2017 - 2030
- Figure 153:
- VALUE SHARE OF UNITED KINGDOM CORN SEED BY BREEDING TECHNOLOGY, %, EUROPE, 2023 AND 2030
- Figure 154:
- VOLUME OF REST OF EUROPE CORN SEED, METRIC TON, EUROPE, 2017 - 2030
- Figure 155:
- VALUE OF REST OF EUROPE CORN SEED, USD, EUROPE, 2017 - 2030
- Figure 156:
- VALUE SHARE OF REST OF EUROPE CORN SEED BY BREEDING TECHNOLOGY, %, EUROPE, 2023 AND 2030
- Figure 157:
- VOLUME OF CORN SEED BY BREEDING TECHNOLOGY CATEGORIES, METRIC TON, MIDDLE EAST, 2017 - 2030
- Figure 158:
- VALUE OF CORN SEED BY BREEDING TECHNOLOGY CATEGORIES, USD, MIDDLE EAST, 2017 - 2030
- Figure 159:
- VOLUME SHARE OF CORN SEED BY BREEDING TECHNOLOGY CATEGORIES, %, MIDDLE EAST, 2017 VS 2023 VS 2030
- Figure 160:
- VALUE SHARE OF CORN SEED BY BREEDING TECHNOLOGY CATEGORIES, %, MIDDLE EAST, 2017 VS 2023 VS 2030
- Figure 161:
- VOLUME OF CORN SEED BY COUNTRY, METRIC TON, MIDDLE EAST, 2017 - 2030
- Figure 162:
- VALUE OF CORN SEED BY COUNTRY, USD, MIDDLE EAST, 2017 - 2030
- Figure 163:
- VOLUME SHARE OF CORN SEED BY COUNTRY, %, MIDDLE EAST, 2017 VS 2023 VS 2030
- Figure 164:
- VALUE SHARE OF CORN SEED BY COUNTRY, %, MIDDLE EAST, 2017 VS 2023 VS 2030
- Figure 165:
- VOLUME OF IRAN CORN SEED, METRIC TON, MIDDLE EAST, 2017 - 2030
- Figure 166:
- VALUE OF IRAN CORN SEED, USD, MIDDLE EAST, 2017 - 2030
- Figure 167:
- VALUE SHARE OF IRAN CORN SEED BY BREEDING TECHNOLOGY, %, MIDDLE EAST, 2023 AND 2030
- Figure 168:
- VOLUME OF SAUDI ARABIA CORN SEED, METRIC TON, MIDDLE EAST, 2017 - 2030
- Figure 169:
- VALUE OF SAUDI ARABIA CORN SEED, USD, MIDDLE EAST, 2017 - 2030
- Figure 170:
- VALUE SHARE OF SAUDI ARABIA CORN SEED BY BREEDING TECHNOLOGY, %, MIDDLE EAST, 2023 AND 2030
- Figure 171:
- VOLUME OF REST OF MIDDLE EAST CORN SEED, METRIC TON, MIDDLE EAST, 2017 - 2030
- Figure 172:
- VALUE OF REST OF MIDDLE EAST CORN SEED, USD, MIDDLE EAST, 2017 - 2030
- Figure 173:
- VALUE SHARE OF REST OF MIDDLE EAST CORN SEED BY BREEDING TECHNOLOGY, %, MIDDLE EAST, 2023 AND 2030
- Figure 174:
- VOLUME OF CORN SEED BY BREEDING TECHNOLOGY CATEGORIES, METRIC TON, NORTH AMERICA, 2017 - 2030
- Figure 175:
- VALUE OF CORN SEED BY BREEDING TECHNOLOGY CATEGORIES, USD, NORTH AMERICA, 2017 - 2030
- Figure 176:
- VOLUME SHARE OF CORN SEED BY BREEDING TECHNOLOGY CATEGORIES, %, NORTH AMERICA, 2017 VS 2023 VS 2030
- Figure 177:
- VALUE SHARE OF CORN SEED BY BREEDING TECHNOLOGY CATEGORIES, %, NORTH AMERICA, 2017 VS 2023 VS 2030
- Figure 178:
- VOLUME OF CORN SEED BY COUNTRY, METRIC TON, NORTH AMERICA, 2017 - 2030
- Figure 179:
- VALUE OF CORN SEED BY COUNTRY, USD, NORTH AMERICA, 2017 - 2030
- Figure 180:
- VOLUME SHARE OF CORN SEED BY COUNTRY, %, NORTH AMERICA, 2017 VS 2023 VS 2030
- Figure 181:
- VALUE SHARE OF CORN SEED BY COUNTRY, %, NORTH AMERICA, 2017 VS 2023 VS 2030
- Figure 182:
- VOLUME OF CANADA CORN SEED, METRIC TON, NORTH AMERICA, 2017 - 2030
- Figure 183:
- VALUE OF CANADA CORN SEED, USD, NORTH AMERICA, 2017 - 2030
- Figure 184:
- VALUE SHARE OF CANADA CORN SEED BY BREEDING TECHNOLOGY, %, NORTH AMERICA, 2023 AND 2030
- Figure 185:
- VOLUME OF MEXICO CORN SEED, METRIC TON, NORTH AMERICA, 2017 - 2030
- Figure 186:
- VALUE OF MEXICO CORN SEED, USD, NORTH AMERICA, 2017 - 2030
- Figure 187:
- VALUE SHARE OF MEXICO CORN SEED BY BREEDING TECHNOLOGY, %, NORTH AMERICA, 2023 AND 2030
- Figure 188:
- VOLUME OF UNITED STATES CORN SEED, METRIC TON, NORTH AMERICA, 2017 - 2030
- Figure 189:
- VALUE OF UNITED STATES CORN SEED, USD, NORTH AMERICA, 2017 - 2030
- Figure 190:
- VALUE SHARE OF UNITED STATES CORN SEED BY BREEDING TECHNOLOGY, %, NORTH AMERICA, 2023 AND 2030
- Figure 191:
- VOLUME OF REST OF NORTH AMERICA CORN SEED, METRIC TON, NORTH AMERICA, 2017 - 2030
- Figure 192:
- VALUE OF REST OF NORTH AMERICA CORN SEED, USD, NORTH AMERICA, 2017 - 2030
- Figure 193:
- VALUE SHARE OF REST OF NORTH AMERICA CORN SEED BY BREEDING TECHNOLOGY, %, NORTH AMERICA, 2023 AND 2030
- Figure 194:
- VOLUME OF CORN SEED BY BREEDING TECHNOLOGY CATEGORIES, METRIC TON, SOUTH AMERICA, 2017 - 2030
- Figure 195:
- VALUE OF CORN SEED BY BREEDING TECHNOLOGY CATEGORIES, USD, SOUTH AMERICA, 2017 - 2030
- Figure 196:
- VOLUME SHARE OF CORN SEED BY BREEDING TECHNOLOGY CATEGORIES, %, SOUTH AMERICA, 2017 VS 2023 VS 2030
- Figure 197:
- VALUE SHARE OF CORN SEED BY BREEDING TECHNOLOGY CATEGORIES, %, SOUTH AMERICA, 2017 VS 2023 VS 2030
- Figure 198:
- VOLUME OF CORN SEED BY COUNTRY, METRIC TON, SOUTH AMERICA, 2017 - 2030
- Figure 199:
- VALUE OF CORN SEED BY COUNTRY, USD, SOUTH AMERICA, 2017 - 2030
- Figure 200:
- VOLUME SHARE OF CORN SEED BY COUNTRY, %, SOUTH AMERICA, 2017 VS 2023 VS 2030
- Figure 201:
- VALUE SHARE OF CORN SEED BY COUNTRY, %, SOUTH AMERICA, 2017 VS 2023 VS 2030
- Figure 202:
- VOLUME OF ARGENTINA CORN SEED, METRIC TON, SOUTH AMERICA, 2017 - 2030
- Figure 203:
- VALUE OF ARGENTINA CORN SEED, USD, SOUTH AMERICA, 2017 - 2030
- Figure 204:
- VALUE SHARE OF ARGENTINA CORN SEED BY BREEDING TECHNOLOGY, %, SOUTH AMERICA, 2023 AND 2030
- Figure 205:
- VOLUME OF BRAZIL CORN SEED, METRIC TON, SOUTH AMERICA, 2017 - 2030
- Figure 206:
- VALUE OF BRAZIL CORN SEED, USD, SOUTH AMERICA, 2017 - 2030
- Figure 207:
- VALUE SHARE OF BRAZIL CORN SEED BY BREEDING TECHNOLOGY, %, SOUTH AMERICA, 2023 AND 2030
- Figure 208:
- VOLUME OF REST OF SOUTH AMERICA CORN SEED, METRIC TON, SOUTH AMERICA, 2017 - 2030
- Figure 209:
- VALUE OF REST OF SOUTH AMERICA CORN SEED, USD, SOUTH AMERICA, 2017 - 2030
- Figure 210:
- VALUE SHARE OF REST OF SOUTH AMERICA CORN SEED BY BREEDING TECHNOLOGY, %, SOUTH AMERICA, 2023 AND 2030
- Figure 211:
- MOST ACTIVE COMPANIES BY NUMBER OF STRATEGIC MOVES, COUNT, GLOBAL, 2017-2023
- Figure 212:
- MOST ADOPTED STRATEGIES, COUNT, GLOBAL, 2017-2023
- Figure 213:
- VALUE SHARE OF MAJOR PLAYERS, %, GLOBAL
Maize Seed Industry Segmentation
Hybrids, Open Pollinated Varieties & Hybrid Derivatives are covered as segments by Breeding Technology. Africa, Asia-Pacific, Europe, Middle East, North America, South America are covered as segments by Region.| Breeding Technology | Hybrids | Non-Transgenic Hybrids | ||
| Transgenic Hybrids | Herbicide Tolerant Hybrids | |||
| Insect Resistant Hybrids | ||||
| Other Traits | ||||
| Open Pollinated Varieties & Hybrid Derivatives | ||||
| Region | Africa | By Breeding Technology | ||
| By Country | Egypt | |||
| Ethiopia | ||||
| Ghana | ||||
| Kenya | ||||
| Nigeria | ||||
| South Africa | ||||
| Tanzania | ||||
| Rest of Africa | ||||
| Asia-Pacific | By Breeding Technology | |||
| Australia | ||||
| Bangladesh | ||||
| China | ||||
| India | ||||
| Indonesia | ||||
| Japan | ||||
| Myanmar | ||||
| Pakistan | ||||
| Philippines | ||||
| Thailand | ||||
| Vietnam | ||||
| Rest of Asia-Pacific | ||||
| Europe | By Breeding Technology | |||
| France | ||||
| Germany | ||||
| Italy | ||||
| Netherlands | ||||
| Poland | ||||
| Romania | ||||
| Russia | ||||
| Spain | ||||
| Turkey | ||||
| Ukraine | ||||
| United Kingdom | ||||
| Rest of Europe | ||||
| Middle East | By Breeding Technology | |||
| Iran | ||||
| Saudi Arabia | ||||
| Rest of Middle East | ||||
| North America | By Breeding Technology | |||
| Canada | ||||
| Mexico | ||||
| United States | ||||
| Rest of North America | ||||
| South America | By Breeding Technology | |||
| Argentina | ||||
| Brazil | ||||
| Rest of South America | ||||
Breeding Technology
| Hybrids | Non-Transgenic Hybrids | ||
| Transgenic Hybrids | Herbicide Tolerant Hybrids | ||
| Insect Resistant Hybrids | |||
| Other Traits | |||
| Open Pollinated Varieties & Hybrid Derivatives | |||
Region
| Africa | By Breeding Technology | ||
| By Country | Egypt | ||
| Ethiopia | |||
| Ghana | |||
| Kenya | |||
| Nigeria | |||
| South Africa | |||
| Tanzania | |||
| Rest of Africa | |||
| Asia-Pacific | By Breeding Technology | ||
| Australia | |||
| Bangladesh | |||
| China | |||
| India | |||
| Indonesia | |||
| Japan | |||
| Myanmar | |||
| Pakistan | |||
| Philippines | |||
| Thailand | |||
| Vietnam | |||
| Rest of Asia-Pacific | |||
| Europe | By Breeding Technology | ||
| France | |||
| Germany | |||
| Italy | |||
| Netherlands | |||
| Poland | |||
| Romania | |||
| Russia | |||
| Spain | |||
| Turkey | |||
| Ukraine | |||
| United Kingdom | |||
| Rest of Europe | |||
| Middle East | By Breeding Technology | ||
| Iran | |||
| Saudi Arabia | |||
| Rest of Middle East | |||
| North America | By Breeding Technology | ||
| Canada | |||
| Mexico | |||
| United States | |||
| Rest of North America | |||
| South America | By Breeding Technology | ||
| Argentina | |||
| Brazil | |||
| Rest of South America | |||
Need A Different Region or Segment?
Customize Now
Market Definition
- Commercial Seed - For the purpose of this study, only commercial seeds have been included as part of the scope. Farm-saved Seeds, which are not commercially labeled are excluded from scope, even though a minor percentage of farm-saved seeds are exchanged commercially among farmers. The scope also excludes vegetatively reproduced crops and plant parts, which may be commercially sold in the market.
- Crop Acreage - While calculating the acreage under different crops, the Gross Cropped Area has been considered. Also known as Area Harvested, according to the Food & Agricultural Organization (FAO), this includes the total area cultivated under a particular crop across seasons.
- Seed Replacement Rate - Seed Replacement Rate is the percentage of area sown out of the total area of crop planted in the season by using certified/quality seeds other than the farm-saved seed.
- Protected Cultivation - The report defines protected cultivation as the process of growing crops in a controlled environment. This includes greenhouses, glasshouses, hydroponics, aeroponics, or any other cultivation system that protects the crop against any abiotic stress. However, cultivation in an open field using plastic mulch is excluded from this definition and is included under open field.
| Keyword | Definition |
|---|---|
| Row Crops | These are usually the field crops which include the different crop categories like grains & cereals, oilseeds, fiber crops like cotton, pulses, and forage crops. |
| Solanaceae | These are the family of flowering plants which includes tomato, chili, eggplants, and other crops. |
| Cucurbits | It represents a gourd family consisting of about 965 species in around 95 genera. The major crops considered for this study include Cucumber & Gherkin, Pumpkin and squash, and other crops. |
| Brassicas | It is a genus of plants in the cabbage and mustard family. It includes crops such as carrots, cabbage, cauliflower & broccoli. |
| Roots & Bulbs | The roots and bulbs segment includes onion, garlic, potato, and other crops. |
| Unclassified Vegetables | This segment in the report includes the crops which don’t belong to any of the above-mentioned categories. These include crops such as okra, asparagus, lettuce, peas, spinach, and others. |
| Hybrid Seed | It is the first generation of the seed produced by controlling cross-pollination and by combining two or more varieties, or species. |
| Transgenic Seed | It is a seed that is genetically modified to contain certain desirable input and/or output traits. |
| Non-Transgenic Seed | The seed produced through cross-pollination without any genetic modification. |
| Open-Pollinated Varieties & Hybrid Derivatives | Open-pollinated varieties produce seeds true to type as they cross-pollinate only with other plants of the same variety. |
| Other Solanaceae | The crops considered under other Solanaceae include bell peppers and other different peppers based on the locality of the respective countries. |
| Other Brassicaceae | The crops considered under other brassicas include radishes, turnips, Brussels sprouts, and kale. |
| Other Roots & Bulbs | The crops considered under other roots & bulbs include Sweet Potatoes and cassava. |
| Other Cucurbits | The crops considered under other cucurbits include gourds (bottle gourd, bitter gourd, ridge gourd, Snake gourd, and others). |
| Other Grains & Cereals | The crops considered under other grains & cereals include Barley, Buck Wheat, Canary Seed, Triticale, Oats, Millets, and Rye. |
| Other Fibre Crops | The crops considered under other fibers include Hemp, Jute, Agave fibers, Flax, Kenaf, Ramie, Abaca, Sisal, and Kapok. |
| Other Oilseeds | The crops considered under other oilseeds include Ground nut, Hempseed, Mustard seed, Castor seeds, safflower seeds, Sesame seeds, and Linseeds. |
| Other Forage Crops | The crops considered under other forages include Napier grass, Oat grass, White clover, Ryegrass, and Timothy. Other forage crops were considered based on the locality of the respective countries. |
| Pulses | Pigeon peas, Lentils, Broad and horse beans, Vetches, Chickpeas, Cowpeas, Lupins, and Bambara beans are the crops considered under pulses. |
| Other Unclassified Vegetables | The crops considered under other unclassified vegetables include Artichokes, Cassava Leaves, Leeks, Chicory, and String beans. |
Need More Details on Market Definition?
Ask a Question
Research Methodology
Mordor Intelligence follows a four-step methodology in all our reports.
- Step-1: IDENTIFY KEY VARIABLES: In order to build a robust forecasting methodology, the variables and factors identified in Step-1 are tested against available historical market numbers. Through an iterative process, the variables required for market forecast are set and the model is built on the basis of these variables.
- Step-2: Build a Market Model: Market-size estimations for the forecast years are in nominal terms. Inflation is not a part of the pricing, and the average selling price (ASP) is kept constant throughout the forecast period.
- Step-3: Validate and Finalize: In this important step, all market numbers, variables and analyst calls are validated through an extensive network of primary research experts from the market studied. The respondents are selected across levels and functions to generate a holistic picture of the market studied.
- Step-4: Research Outputs: Syndicated Reports, Custom Consulting Assignments, Databases, and Subscription Platforms

Get More Details On Research Methodology
Download PDF


