
Magnetic Materials Market Size and Share
Market Overview
| Study Period | 2021 - 2031 |
|---|---|
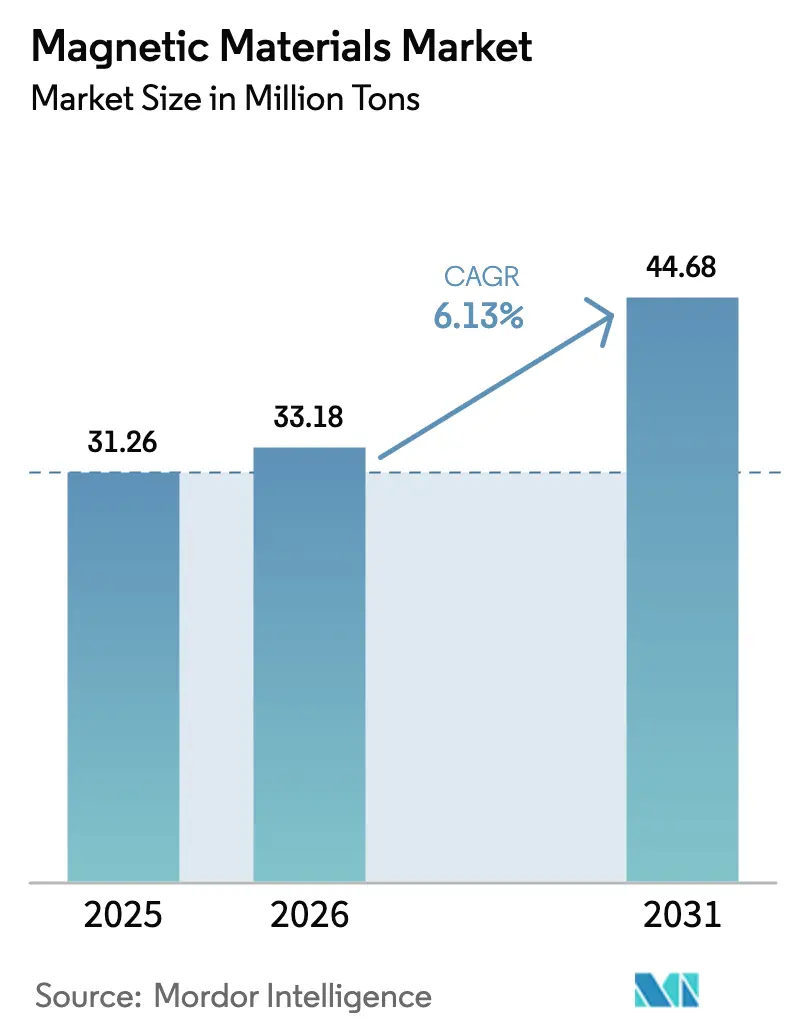
| Market Volume (2026) | 33.18 Million tons |
| Market Volume (2031) | 44.68 Million tons |
| Growth Rate (2026 - 2031) | 6.13 % |
| Fastest Growing Market | Asia Pacific |
| Largest Market | Asia Pacific |
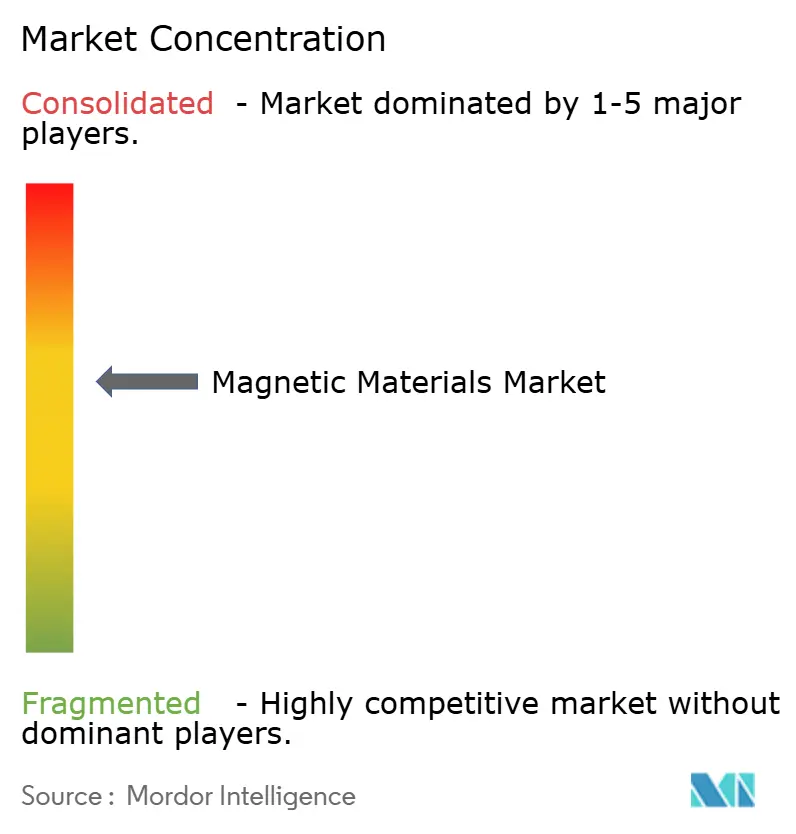
| Market Concentration | Medium |
Major Players *Disclaimer: Major Players sorted in no particular order Image © Mordor Intelligence. Reuse requires attribution under CC BY 4.0. | |
Magnetic Materials Market Analysis by Mordor Intelligence
The Magnetic Materials Market size was valued at 31.26 Million tons in 2025 and is estimated to grow from 33.18 Million tons in 2026 to reach 44.68 Million tons by 2031, at a CAGR of 6.13% during the forecast period (2026-2031). Demand is rising as automakers shift from induction drives to permanent-magnet traction motors, wind-turbine OEMs embrace direct-drive architectures, and hyperscale data centers adopt nanocrystalline cores for high-frequency power conversion. Each end-use prefers a different alloy—NdFeB for torque density, ferrite for cost-sensitive gadgets, and amorphous ribbons for switching speed—so headline growth masks margin pressure in specialty grades. Asia-Pacific dominates because China owns most sintering capacity, Japan leads grain-boundary diffusion know-how, and South Korea scales MRAM fabs that consume high-purity targets. Western buyers are reacting to export-control risk by dual-sourcing and exploring recycling, yet oxide prices remain elevated, reinforcing the region’s cost advantage.
Key Report Takeaways
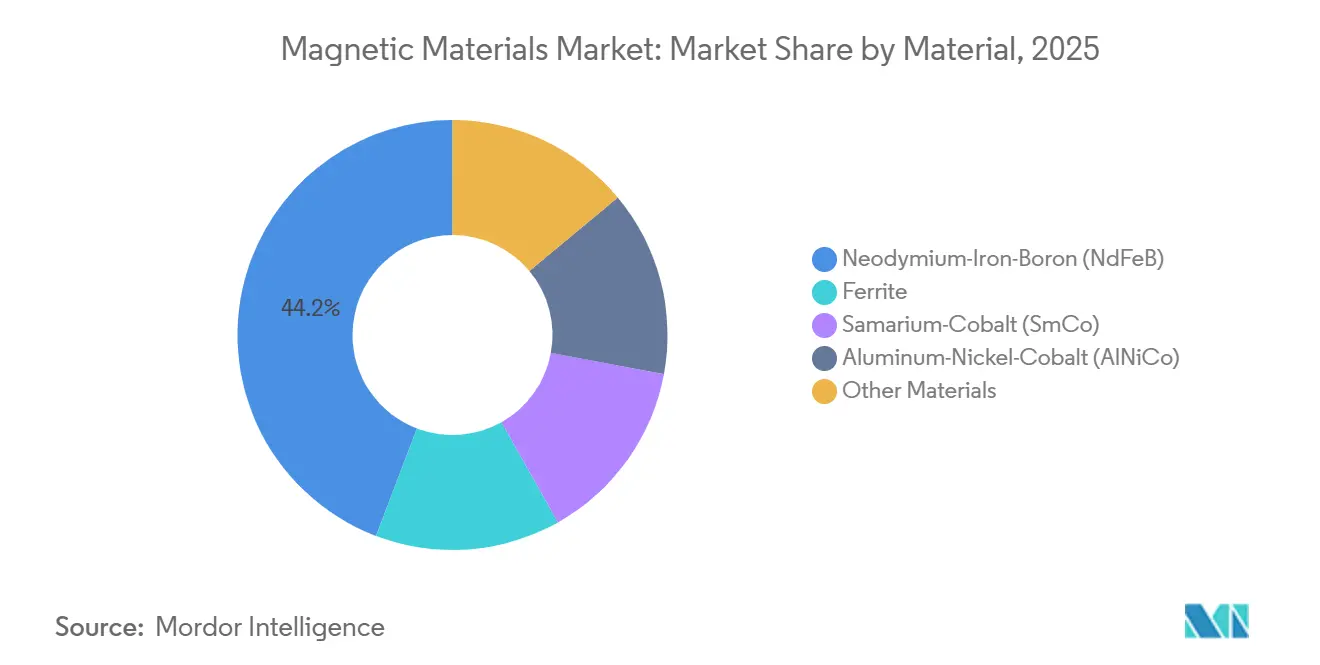
- By material, Neodymium-Iron-Boron (NdFeB) led with 44.21% Volume share in 2025; ferrite is projected to expand at a 6.28% CAGR to 2031.
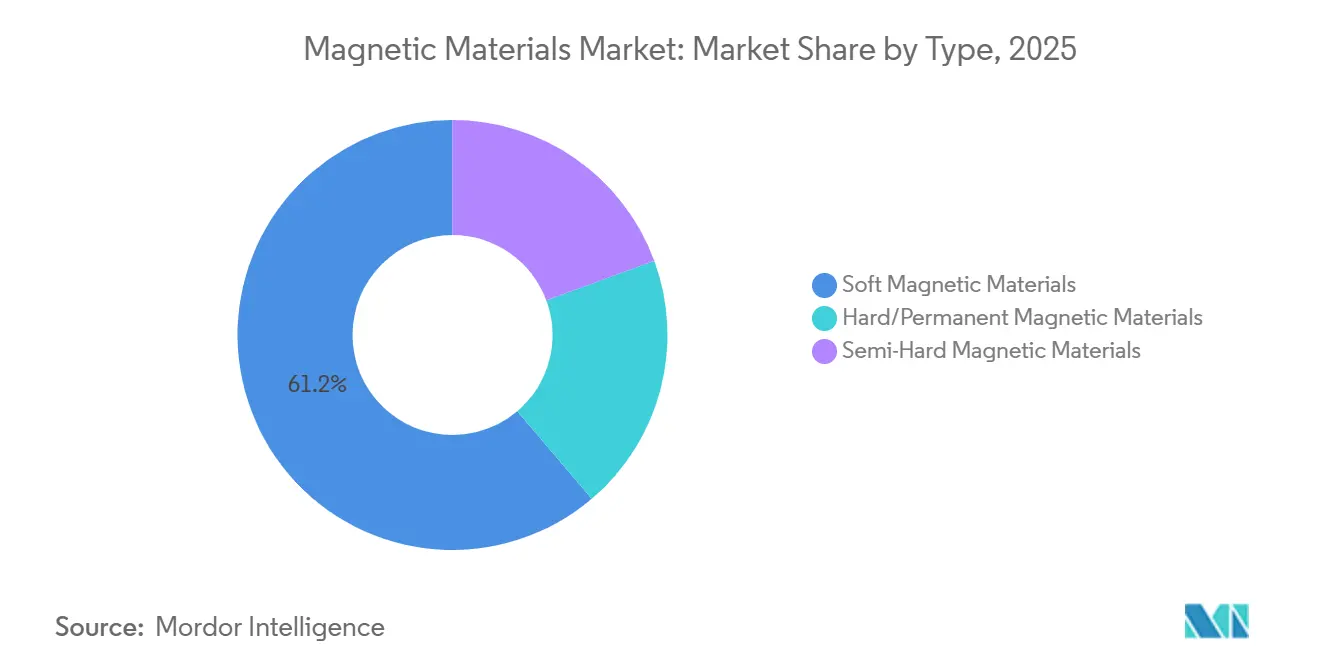
- By type, soft magnetic materials held 61.23% share of the magnetic materials market size in 2025, while hard/permanent magnets are advancing at a 6.98% CAGR through 2031.
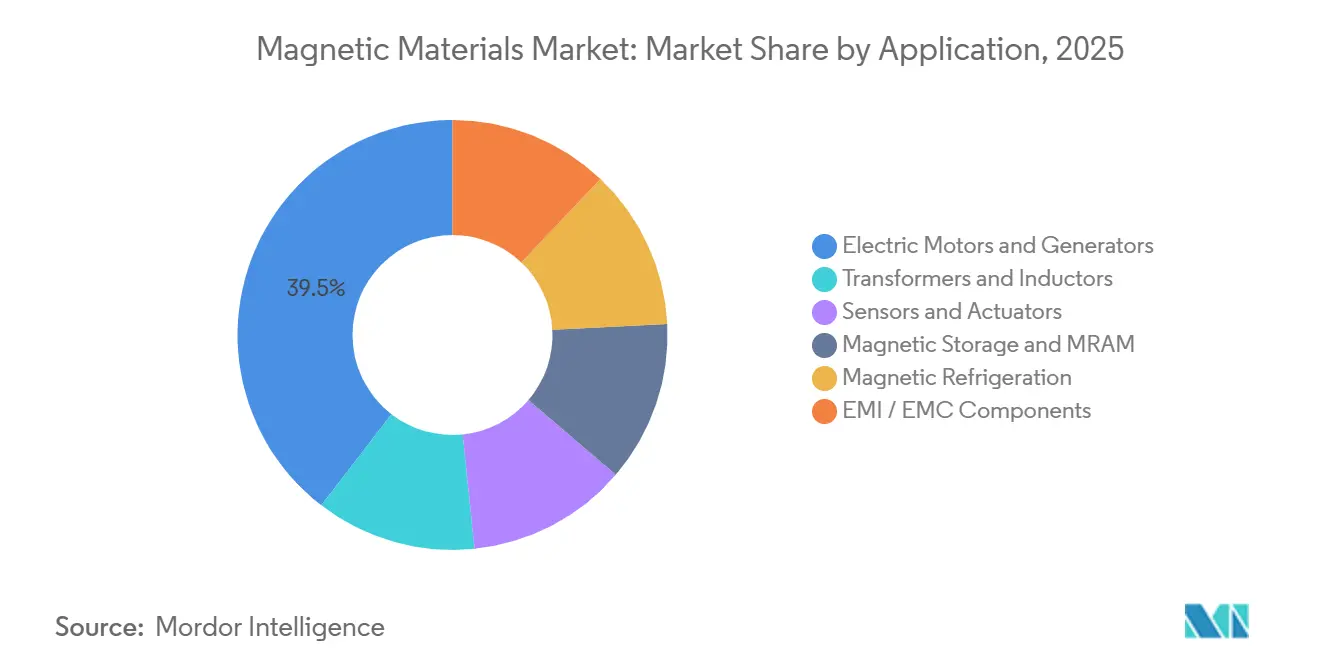
- By application, electric motors and generators commanded 39.55% share in 2025 and are forecast to grow at a 6.78% CAGR to 2031.
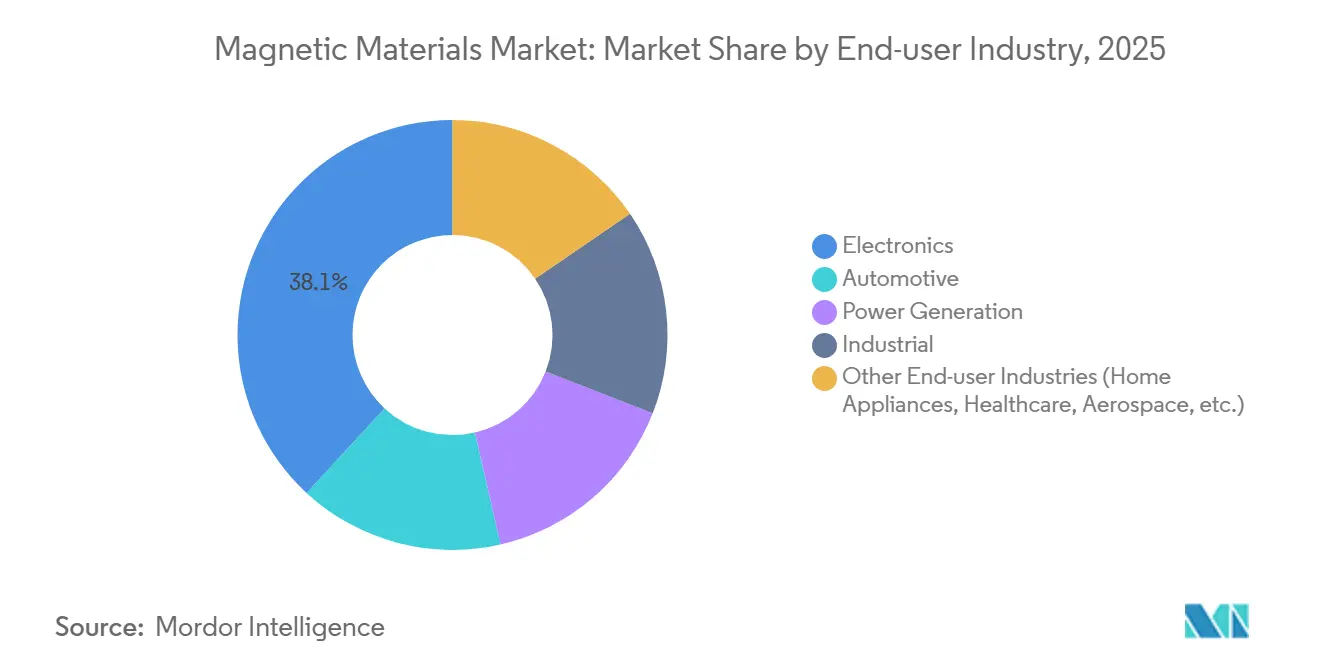
- By end-user industry, electronics accounted for 38.13% share in 2025, whereas automotive is expected to register a 7.95% CAGR through 2031.
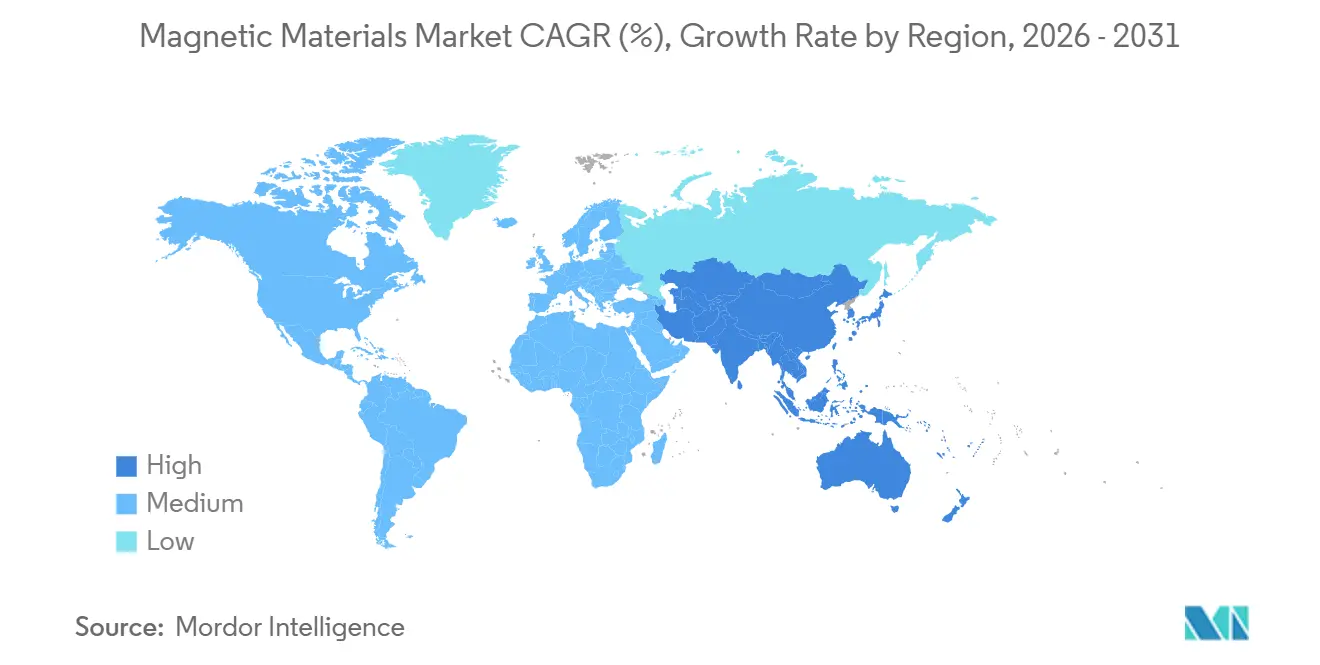
- By geography, Asia-Pacific captured 67.23% of magnetic materials market share in 2025 and is expanding at a 7.77% CAGR to 2031.
Note: Market size and forecast figures in this report are generated using Mordor Intelligence’s proprietary estimation framework, updated with the latest available data and insights as of January 2026.
Market Trends and Insights
Drivers Impact Analysis of Magnetic Materials Market*
| Driver | (~) % Impact on CAGR Forecast | Geographic Relevance | Impact Timeline |
|---|---|---|---|
| Rising Electric Vehicle Adoption Fuels Demand for Magnetic Materials | +1.8% | Global, with APAC and Europe leading adoption | Medium term (2-4 years) |
| Grid-Scale Wind-Turbine Gearless Generators Adoption | +1.2% | Global, concentrated in China, US, Europe offshore markets | Long term (≥ 4 years) |
| AI-Enabled Factory Automation Boosts Sensor Magnets | +0.9% | APAC core, spill-over to North America and Europe | Short term (≤ 2 years) |
| Growing Robotics and Automation Usage Accelerates Magnetic Materials Demand | +0.7% | Global, with early gains in Japan, South Korea, Germany | Medium term (2-4 years) |
| High-Frequency Power Electronics Need Nanocrystalline Cores | +0.6% | North America and Europe data-center hubs, APAC manufacturing | Short term (≤ 2 years) |
| Source: Mordor Intelligence | |||
Rising Electric Vehicle Adoption Fuels Demand for Magnetic Materials
Battery-electric vehicles consumed 2,800 tons of NdFeB magnets in 2024 and are projected to exceed 8,000 tons by 2030 as annual EV sales approach 30 million units[1]. Permanent-magnet synchronous motors achieve peak efficiencies above 96%, prompting OEMs to spend on rare-earth grades to extend driving range without larger batteries. Tesla’s 4680-cell design and BYD’s Blade pack both use multi-motor layouts that double magnet content per vehicle versus single-motor cars. China built 9.5 million EVs in 2025, absorbing most domestic sintered-magnet output and tightening export supply. European platforms moving to 800-volt architectures require high-coercivity magnets able to withstand thermal demagnetization, which lifts dysprosium demand in the magnetic materials market.
Grid-Scale Wind-Turbine Gearless Generators Adoption
Direct-drive turbines remove gearboxes and cut mechanical losses by 2-3 percentage points, extending service intervals from six to eighteen months. Goldwind’s 16 MW offshore unit contains about 12 tons of NdFeB, and 2026 offshore additions of 40 GW could draw roughly 30,000 tons of magnets. China supplies 60% of global turbines, so most magnet demand originates domestically even for projects installed abroad. Siemens Gamesa and Vestas trial recycled NdFeB, yet closed-loop material remains under 5% of consumption because reprocessing degrades flux up to 15%. North Sea operators now specify corrosion-resistant coatings that add USD 2-3 per kilogram but cut crane-vessel repair costs over 25-year lifecycles.
AI-Enabled Factory Automation Boosts Sensor Magnets
Collaborative robots shipped 50,000 units in 2025, each embedding 8-12 magnetic encoders for sub-degree joint control. Sensor magnets are usually samarium-cobalt or bonded NdFeB because they must stay calibrated from -40 °C to 150 °C, a range ferrite cannot handle. Rising labor costs in China’s coastal provinces are accelerating adoption of pick-and-place robots that need miniature magnets for linear actuators. Japan’s FANUC and Germany’s KUKA demand ISO 9001-certified magnet traceability, an edge for established suppliers like TDK and Proterial in the magnetic materials market. Short replacement cycles in electronics manufacturing keep annual sensor-magnet demand climbing even when handset volumes plateau.
High-Frequency Power Electronics Need Nanocrystalline Cores
AI inference clusters run power supplies switching at 500 kHz to 1 MHz, frequencies where silicon-steel cores suffer prohibitive eddy losses. Nanocrystalline ribbons with sub-20 nm grains slash core loss to below 10 W/kg at 100 kHz—one-fifth that of conventional steel—making them the default in 48 V bus converters. VACUUMSCHMELZE’s VITROPERM and Hitachi Metals’ FINEMET are sold out through mid-2026 as AI capex tops USD 200 billion annually. Hyperscalers prioritize footprint and thermal margins, so they pay the premium for nanocrystalline even when amorphous alloys are cheaper. Amorphous ribbon therefore sticks to lower-frequency distribution transformers, leaving high-frequency dominance to nanocrystalline grades in the magnetic materials market.
Restraints Impact Analysis of Magnetic Materials Market*
| Restraint | (~) % Impact on CAGR Forecast | Geographic Relevance | Impact Timeline |
|---|---|---|---|
| REE Mining ESG Backlash Intensifies in OECD Nations | -0.8% | North America, Europe, Australia | Medium term (2-4 years) |
| China Export-Control Risk on Nd and Dy Oxides | -1.1% | Global, acute in North America and Europe | Short term (≤ 2 years) |
| Slow Scale-Up of Closed-Loop NdFeB Recycling | -0.4% | Global, with pilot projects in Japan, EU, US | Long term (≥ 4 years) |
| Source: Mordor Intelligence | |||
REE Mining ESG Backlash Intensifies in OECD Nations
Permitting for new rare-earth mines in the United States and Australia now averages 7-10 years, double the 2015 timeline, because regulators require perpetual tailings-water treatment bonds. Lynas paused its Kalgoorlie refinery expansion for 18 months while negotiating residue-disposal terms, proving even brownfield projects face social-license delays. Environmental groups have sued MP Materials over radionuclide discharge at Mountain Pass, elevating compliance costs in the magnetic materials market. The EU’s Critical Raw Materials Act demands 10% local supply by 2030, yet no new European mine is online, forcing the bloc to rely on toll refining in Asia. These headwinds are nudging OEMs toward magnet-free motor designs that trade 3-5% efficiency for rare-earth independence when neodymium oxide tops USD 80/kg.
China Export-Control Risk on Nd and Dy Oxides
Beijing imposed licensing on gallium, germanium, and antimony in 2023 and has signaled rare-earth oxides could follow if geopolitical frictions intensify. Although Nd and Dy are not quota-bound yet, voluntary shipment cuts during past disputes spiked prices 40-60% in weeks. Japanese magnet giants Shin-Etsu and TDK hold six-month oxide stocks, tying up working capital worth 15-20% of annual revenue to buffer shocks. The U.S. CHIPS and Science Act earmarked USD 3 billion for domestic separation, but no plant can yet deliver battery-grade neodymium oxide, leaving defense primes dependent on federal stockpiles. South Korea’s POSCO and Australia’s Iluka plan a USD 1.2 billion refinery by 2027, yet feedstock hinges on stable monazite exports from Western Australia, itself vulnerable to policy shifts.
*Our forecasts treat driver/restraint impacts as directional, not additive. The impact forecasts reflect baseline growth, mix effects, and variable interactions.
Magnetic Materials Market Segment Analysis
By Material:
NdFeB Dominance Meets Ferrite’s Cost AdvantageNeodymium-Iron-Boron (NdFeB) commanded 44.21% of 2025 volume, reflecting its unmatched energy product that lets motor makers halve rotor size without losing torque. That dominance locks in premium pricing, yet rising dysprosium cost keeps OEMs searching for alternatives in the magnetic materials market. Ferrite is slated to grow at a 6.28% CAGR through 2031 as handset makers replace bonded NdFeB with injection-molded ferrite in haptic and charging modules, trading 20% performance for zero rare-earth risk. Samarium-cobalt serves niche aerospace and downhole-tool markets above 200 °C, where NdFeB loses flux; volumes stay under 3,000 tons, but prices above USD 100/kg keep profitability intact. AlNiCo is useful mainly in legacy sensors and musical pickups, while electrical steel drives high demand thanks to transformers and motor laminations, anchoring the magnetic materials market. Premium nanocrystalline ribbons win high-frequency slots in data-center PSUs, a pocket of outsized margin amid commodity tonnage.

By Type:
Soft Materials Lead Volume, Hard Magnets Lead GrowthSoft magnetic materials held 61.23% tonnage in 2025, buoyed by transformer cores, inductors, and stator laminations that cycle magnetization thousands of times per second. Grain-oriented electrical steel is enjoying fresh investment because utilities target lower no-load losses in distribution transformers. Hard/permanent magnets, however, are expanding at a 6.98% CAGR through 2031, because each electric vehicle, wind turbine, or industrial robot adds multiple permanent-magnet motors, accelerating growth in the magnetic materials market. Semi-hard grades, with intermediate coercivity, are being squeezed out as designers either jump to NdFeB for permanent bias or retreat to ferrite for switchable fields. Global efficiency rules (IE4/IE5) almost require permanent magnets to meet regulatory thresholds, reinforcing the tilt toward hard materials. Meanwhile, USB Power Delivery chargers drive more soft-ferrite demand for high-flux inductors in consumer electronics.
By Application:
Motors and Generators Anchor DemandElectric motors and generators absorbed 39.55% of the 2025 volume and are set to grow 6.78% to 2031 because motors consume 45% of global electricity, so each efficiency gain saves gigawatt-hours at the grid scale. Direct-drive wind turbines and multi-motor EV platforms magnify unit magnet usage, entrenching this application as the magnetic materials market’s demand bedrock. Transformers and inductors’ demand is fuelled by renewable-energy inverters and grid-modernization programs that swap out aging equipment. Sensors and actuators proliferate in vehicles and smart factories—modern cars host 80-100 magnetic sensors—yet their sub-gram mass means smaller tonnage despite exploding unit counts. Magnetic storage is shifting from HDDs to MRAM sputter targets—tiny in mass but strategic for chipmakers—while magnetic refrigeration stays pre-commercial, awaiting cost breakthroughs. EMI filters round out demand with billions of ferrite beads yearly, although volume impact remains modest.
By End-user Industry:
Automotive Electrification Outpaces ElectronicsElectronics retained 38.13% of 2025 volume, anchored by 1.2 billion smartphones that each carry several grams of ferrite and NdFeB. Growth, however, is flattening as handset shipments plateau, leaving automotive as the fastest riser in the magnetic materials market. Battery-electric vehicles are forecast to jump from 14 million units in 2025 to 35 million in 2030, lifting automotive demand at a 7.95% CAGR because every BEV embeds 3-5 kg of permanent magnets versus none in combustion powertrains. Power-generation uses—including wind turbines and hydro generators—will spike again as offshore projects ramp in 2026. Industrial machinery is converting to variable-frequency drives that pair permanent-magnet motors with silicon-carbide inverters to cut energy use 20-30%. Home appliances and medical devices round out end uses, with samarium-cobalt holding critical niches in defense and aerospace actuators where thermal and radiation resilience are mandatory.
Geography Analysis
APAC Magnetic Materials Market
Asia-Pacific captured 67.23% of 2025 tonnage and is on track for a 7.77% CAGR to 2031, reflecting China’s 180,000-ton NdFeB output, Japan’s high-coercivity specialties, and South Korea’s MRAM scale-up. China produced major magnetic materials in 2025 across ferrite, electrical steel, and sintered NdFeB, with vertically integrated majors controlling oxide through machining, which sustains low cost and rapid lead times. Japan’s Shin-Etsu and TDK dominate premium grades above 50 MGOe and 30 kOe coercivity, securing 30-40% price premiums over commodity blocks. India is emerging as a ferrite hub for domestic smartphones and two-wheelers, but still imports 95% of rare-earth oxides, exposing it to Chinese policy shifts[2].
The Americas and EMEA Magnetic Materials Market
North America held a moderate share, and MP Materials’ Stage II alloy line will shave import dependence to 70% by 2027, yet Canada’s pilot separation capacity remains under 1,000 tons, insufficient for even one automaker. In Europe, local magnet capacity covers barely 5% of need; VACUUMSCHMELZE and Proterial feed data-center cores yet rely on Chinese ribbon, showing the difficulty of onshoring full supply chains. South America and the Middle East and Africa's shares are driven by mining equipment and grid upgrades, with Brazil exploring rare-earth extraction from iron-ore tailings that may not commercialize before 2028.
Regulatory Landscape
Policy is increasingly shaping rare-earth and permanent-magnet supply chains through security-of-supply and circularity requirements. In the European Union, Regulation (EU) 2024/1252 (Critical Raw Materials Act) designates permanent magnets as priority products for circularity. Follow-on measures include an implementing act for permanent-magnet labeling formats due by 24 November 2026, and public disclosure obligations for recovered critical-material content in magnets above 0.2 kg starting 24 May 2027 (or two years after the relevant delegated act). The European Commission also adopted the RESourceEU action plan in December 2025 to accelerate CRMA implementation and regulatory support for critical raw material projects.
In the United States, trade and industrial policy tools are being used to reduce dependency on imported processed critical minerals and magnet inputs. A presidential action in January 2026 adjusted imports of processed critical minerals and derivative products on national security grounds, and the Department of Energy announced funding programs in May 2026. The initiatives include USD 45.7 million for 19 projects focused on domestic critical mineral processing and supply chain innovation, plus USD 134 million for two projects to recover and refine rare earth elements from unconventional feedstocks. Together, these actions raise compliance and traceability requirements for buyers while supporting onshore processing and recycling capacity for rare-earth-bearing magnetic materials.
Value Chain Analysis
The magnetic materials value chain runs from upstream ore extraction (rare earths, iron, cobalt, boron, nickel) through separation and refining (rare earth oxides), metallization and alloying (NdFeB, SmCo, AlNiCo, electrical steels, amorphous/nanocrystalline ribbons), powder making and strip or ribbon production, and then magnet forming (sintered, bonded, injection molded). It continues with machining and coating, and conversion into components such as motor rotors, generators, sensors or actuators, inductors, and transformer cores. China remains the central node, accounting for about 60% of mined rare-earth production and 91% of refined output in 2024, which reinforces its cost and lead-time advantages across oxide-to-magnet conversion.
Downstream magnet fabrication and metallization are key bottlenecks for diversification, while policy and pricing are reshaping flows. Export-control measures, including April 2025 licensing requirements for shipments of several medium and heavy rare earth elements, add friction to supply planning for high-coercivity grades that depend on dysprosium and terbium. On the demand side, buyer qualification cycles and audit requirements are rising, and pricing transparency is improving, including the introduction of regional rare-earth permanent-magnet price assessments in April 2026. Recycling is moving from pilots toward industrialization, supported by public funding and defense-linked initiatives, which creates an alternate feedstock stream for NdFeB and reduces exposure to oxide supply disruptions.
Competitive Landscape
The magnetic materials market shows moderate concentration: the top 5 producers control roughly 37% of production capacity. Chinese leaders Hengdian and DMEGC practice mine-to-magnet integration to secure oxide streams, Japanese peers Shin-Etsu and TDK lean on grain-boundary diffusion for high-margin grades, and Western newcomers MP Materials and Lynas back-integrate into separation lines to meet defense sourcing rules. Recycling remains white space; Urban Mining Company and Noveon Magnetics run pilot selective-leach plants that recover dysprosium at 90% purity, a capability that will gain value if export quotas tighten. Technology is the key lever: Proterial’s diffusion process drops dysprosium use 30% without losing coercivity and now licenses to NEO Performance Materials and Daido Steel, creating royalty streams that insulate earnings from raw-material shocks. Patent filings in nanocrystalline alloys surged above 200 in 2024-2025, with VACUUMSCHMELZE, Hitachi Metals, and Advanced Technology & Materials racing for core-loss leadership. Standards bodies such as IEC TC 68 are drafting recycled-magnet traceability rules, which could favor producers holding ISO 14001 certification and transparent supply chains in the magnetic materials industry.
Magnetic Materials Industry Leaders
-
Proterial, Ltd.
-
Shin-Etsu Chemical Co., Ltd.
-
TDK Corporation
-
Ningbo Yunsheng Co., Ltd.
-
VACUUMSCHMELZE GmbH & Co. KG
- *Disclaimer: Major Players sorted in no particular order
Magnetic Materials Market Companies Covered in this Report
- Adams Magnetic Products
- ArcelorMittal
- Arnold Magnetic Technologies
- Daido Steel Co., Ltd.
- Dexter Magnetic Technologies
- DMEGC Magnetics Co., Ltd.
- Electron Energy Corporation
- GKN Powder Metallurgy
- Hengdian Group Holdings Limited
- Lynas Rare Earths Ltd.
- MP Materials Corp.
- NEO
- Ningbo Yunsheng Co., Ltd.
- Niterra Materials Co., Ltd.
- Proterial, Ltd.
- Quadrant
- Shin-Etsu Chemical Co., Ltd.
- Steward Advanced Materials LLC
- TDK Corporation
- VACUUMSCHMELZE GmbH & Co. KG
Market Opportunities and Future Outlook
Regulation-driven transparency and local-content initiatives are creating room for new capacity in recycling, refining, and magnet manufacturing beyond the current dominant supply base. Under the EU Critical Raw Materials Act (Regulation (EU) 2024/1252), the related labeling and recycled-content disclosure deadlines, including labeling formats due by 24 November 2026 and recycled-content disclosure tied to magnets above 0.2 kg starting 24 May 2027, are pushing OEMs and tier suppliers to secure documented supply chains for NdFeB-containing products. This favors suppliers that can provide auditable bill-of-materials, recycled-content accounting, and traceable processing routes for neodymium, dysprosium, and boron across motor, generator, and industrial automation applications.
Government-backed industrial projects are also translating into investable demand for mine-to-magnet and recycling infrastructure. In June 2026, the US Department of Commerce finalized an agreement for up to USD 1.6 billion in incentives and loans under the CHIPS and Science Act to support USA Rare Earths domestic supply chain. In parallel, the UK government launched the GBP 20 million Magnet Hub competition under its Critical Minerals Programme to fund a UK-based facility to scale rare earth permanent magnet manufacturing. On the circularity side, HyProMag inaugurated an HPMS recycling plant in Pforzheim, Germany in April 2026, with 100 tonnes per year initial capacity and a target of 350 tonnes per year, which provides a pathway for closed-loop NdFeB feedstock into European magnet and motor supply chains where local magnet capacity remains limited.
Recent Industry Developments in Magnetic Materials Market
- June 2026: Shin-Etsu Chemical announced plans to build a new rare-earth separation and refining plant in Fukui, Japan, supported by a METI subsidy of about JPY 175 billion. The plans are aimed at increasing the availability of refined rare earth inputs for EV magnet supply chains and reducing exposure to external oxide supply disruptions.
- November 2025: Researchers at the University of New Hampshire used artificial intelligence to accelerate the discovery of functional magnetic materials and created a searchable database of 67,573 magnetic materials, including 25 previously unidentified compounds that retained magnetic properties at high temperatures. The work expands the screening toolkit for next-generation soft and hard magnetic materials used in high-temperature motors, generators, and power electronics.
- October 2024: Arnold Magnetic Technologies opened a manufacturing facility in Thailand to expand production capacity for high-reliability magnetic components. The added footprint strengthens supply options for electronics, automotive, and industrial customers that require qualified components and diversified manufacturing locations.
Magnetic Materials Market Report Scope and Research Methodology
Market Definition and Coverage
For this methodology, the magnetic materials market covers magnetic metals and ferrite based materials that are produced and sold as inputs to make magnets, cores, and other magnetic components used in electrical and electronic systems.
Scope exclusions: finished devices and assemblies where magnets are already installed, plus traded scrap that is not part of formal sales reporting, are not counted.
Segments Covered in This Report
- By Material
- Neodymium-Iron-Boron (NdFeB)
- Ferrite
- Samarium-Cobalt (SmCo)
- Aluminum-Nickel-Cobalt (AlNiCo)
- Other Materials (Electrical Steel (GO and NGO), Nanocrystalline and Amorphous Alloys)
- By Type
- Soft Magnetic Materials
- Hard/Permanent Magnetic Materials
- Semi-Hard Magnetic Materials
- By Application
- Electric Motors and Generators
- Transformers and Inductors
- Sensors and Actuators
- Magnetic Storage and MRAM
- Magnetic Refrigeration
- EMI / EMC Components
- By End-user Industry
- Electronics
- Automotive
- Power Generation
- Industrial
- Other End-user Industries (Home Appliances, Healthcare, Aerospace, etc.)
- By Geography
- Asia-Pacific
- China
- India
- Japan
- South Korea
- ASEAN Countries
- Rest of Asia-Pacific
- North America
- United States
- Canada
- Mexico
- Europe
- Germany
- United Kingdom
- Italy
- France
- NORDIC Countries
- Rest of Europe
- South America
- Brazil
- Argentina
- Rest of South America
- Middle-East and Africa
- Saudi Arabia
- South Africa
- Rest of Middle-East and Africa
- Asia-Pacific
Data Sources, Market Sizing, and Validation
Desk Research
Desk research was used to set the model structure and to anchor the key demand signals that magnetic materials usually track. We referenced public sources such as USGS mineral statistics, UN Comtrade trade flows for relevant HS codes, World Steel Association releases for electrical steel context, International Energy Agency updates on EV and grid additions, and peer reviewed papers that describe magnet chemistries and performance tradeoffs.
In parallel, we reviewed company annual reports, investor presentations, and association websites to understand capacity announcements, product mix shifts, and application trends. Where gaps needed filling, we used paid subscriptions for company financials and intelligence, patent databases, and shipment-level import and export checks so unit assumptions stayed realistic. These examples are illustrative, and we also drew on other public and proprietary sources for data collection, validation, and research clarification.
Primary Interviews and Surveys
Primary work was done through expert interviews and structured surveys with participants across the value chain, including raw material processors, magnetic alloy and powder makers, component manufacturers, and downstream buyers in automotive, electronics, and energy. To keep assumptions grounded, we validated inputs across APAC, EMEA, and the Americas, with particular attention to price movements, substitution between ferrite and rare earth magnets, and lead-time driven purchasing behavior.
Distribution of primary research fieldwork respondents
| Company type | Respondent position | Region |
|---|---|---|
| Top tier: 25% | CXOs: 17% | APAC: 45% |
| Mid tier: 55% | Functional/Unit leaders: 31% | EMEA: 32% |
| Smaller Players: 20% | Managers: 52% | Americas: 23% |
Market-Sizing & Forecasting
Sizing starts with a top-down build that reconstructs magnetic material demand from application indicators that are visible and repeatable, then converts them into material volumes and values using practical yield and intensity factors. In this market, inputs that typically matter include EV and hybrid production (motor magnet pull), wind and industrial motor additions, transformer and power electronics build-outs, and the mix shift between ferrite, electrical steel, and rare earth based materials.
Once the demand pool is formed, average selling prices are developed by material family using a blend of published price references and interview-based contract and spot adjustments, then converted using consistent currency timing. We check results with selective bottom-up approximations, such as sampled producer capacity and utilization discussions, channel checks with component makers, and simple volume times price cross-checks, which helps adjust totals when one signal appears overstated.
For forecasting, we use scenario analysis because rare earth pricing, export controls, and EV build rates can move the curve quickly. Assumptions are reviewed with industry participants, and where data gaps exist for smaller end uses, we apply proxies such as industrial production and electricity equipment output so the series stays continuous and explainable.
Data Validation & Update Cycle
Validation is done by triangulating model output against independent signals, like trade direction for key material groups, public capacity changes, and implied consumption per EV or per unit of electrical equipment. When a variance appears, we trace it back to the underlying variable and recheck it, and we trigger follow-up outreach if the gap cannot be explained by seasonality or timing.
Before sign-off, the model goes through multi-step analyst reviews that test arithmetic consistency, pricing logic, and year-over-year movement against known events. Reports are refreshed annually, and interim updates are made when material events occur, such as sharp raw material price changes or major policy actions. Right before delivery, a fresh pass is completed so clients receive the latest updated view.
Mordor Intelligence's Magnetic Materials Market Size Measured Against Other Published Estimates
Published market sizes for magnetic materials often do not line up because each publisher makes different choices on what gets counted, what unit is used, and how pricing is applied across materials that behave very differently.
The main gap comes from mixing volume-led definitions with revenue-led definitions, where Mordor Intelligence keeps the market tied to the sale of magnetic material inputs used for magnets and cores, rather than expanding the total by including finished assemblies or device value add. Differences also show up when one estimate applies a single blended price curve across ferrites, electrical steels, and rare earth magnets, or when currency timing and update cadence are not aligned to recent rare earth price swings.
Benchmark comparison
| Source | Market Size | Gaps in Research Methodology |
|---|---|---|
| Mordor Intelligence | USD 33.78 B (2024) | |
| Industry Research Group A | USD 35.51 B (2025) | Uses a revenue base year later than 2024 and can lift the total by applying a broad application scope and a faster price pass-through assumption during the forecast start period. |
| Industry Research Group B | USD 37.81 B (2026) | Starts the time series at 2026 and may include a wider set of semi-finished magnetic parts in the counted scope, which increases the market value versus material-only selling prices. |
Taken together, the spread is mainly explained by scope edges, the choice of base year, and how price progression is handled across very different material families. By keeping the inputs explicit and cross-checking them against independent demand signals, the resulting market value stays traceable to clear variables that can be reviewed and repeated.
Key Questions Answered in the Report
What is the volume of the magnetic materials market?
The market stands at 33.18 million tons in 2026 and is forecast to reach 44.68 million tons by 2031, expanding at a 6.13% CAGR.
Which region leads demand for magnetic materials?
Asia-Pacific holds 67.23% of global volume in 2026 and is growing at a 7.77% CAGR through 2031.
Why are neodymium-iron-boron magnets critical in electric vehicles?
NdFeB offers the highest energy product, enabling smaller, more efficient traction motors that extend EV range.
Which application segment is currently the largest consumer of magnetic materials?
Electric motors and generators account for 39.55% of total volume in 2026.