
Macular Degeneration Treatment Market Size and Share
Market Overview
| Study Period | 2020 - 2031 |
|---|---|
| Market Size (2026) | USD 16.73 Billion |
| Market Size (2031) | USD 25.19 Billion |
| Growth Rate (2026 - 2031) | 8.53 % |
| Fastest Growing Market | Asia-Pacific |
| Largest Market | North America |
| Market Concentration | Medium |
Major Players *Disclaimer: Major Players sorted in no particular order Image © Mordor Intelligence. Reuse requires attribution under CC BY 4.0. | |
Macular Degeneration Treatment Market Analysis by Mordor Intelligence
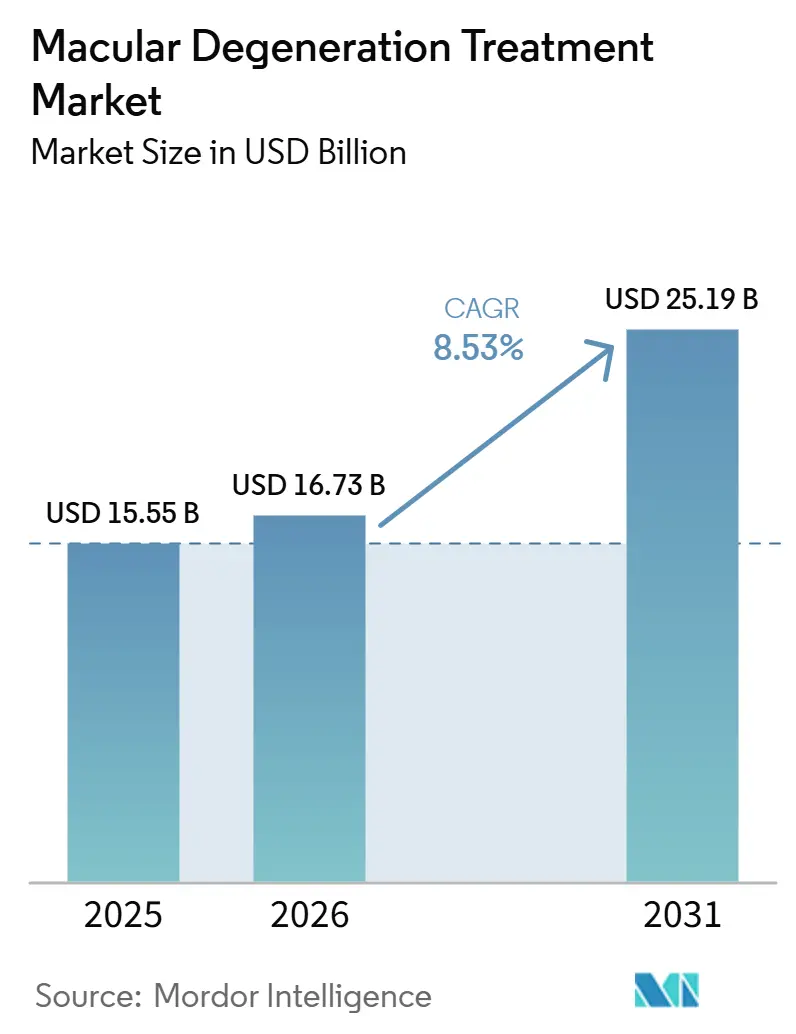
The Macular Degeneration Treatment Market size was valued at USD 15.55 billion in 2025 and is estimated to grow from USD 16.73 billion in 2026 to reach USD 25.19 billion by 2031, at a CAGR of 8.53% during the forecast period (2026-2031).
The macular degeneration treatment market is benefiting from durable anti-VEGF biologics that stretch dosing intervals to 16 weeks, complement inhibitors that open a new revenue stream in geographic atrophy, and AI-enabled optical coherence tomography (OCT) systems that detect high-risk drusen growth well before visual loss occurs. Gene-therapy pipelines, suprachoroidal delivery devices, and home-monitoring apps are broadening the therapeutic toolkit, while biosimilar discounts of 30-40% in Europe and emerging markets are stimulating treatment uptake without eroding overall value, as manufacturers counter price pressure with differentiated, longer-acting formats. North America remains the largest revenue generator due to Medicare Part B reimbursement, yet Asia-Pacific is the fastest-growing region as Japan, China, and South Korea accelerate public funding for aging-related vision care. Competitive intensity is high; originators are defending share through patent extensions, room-temperature-stable formulations, and digital-diagnostic bundles that reduce clinic workload and support value-based contracting.
Key Report Takeaways
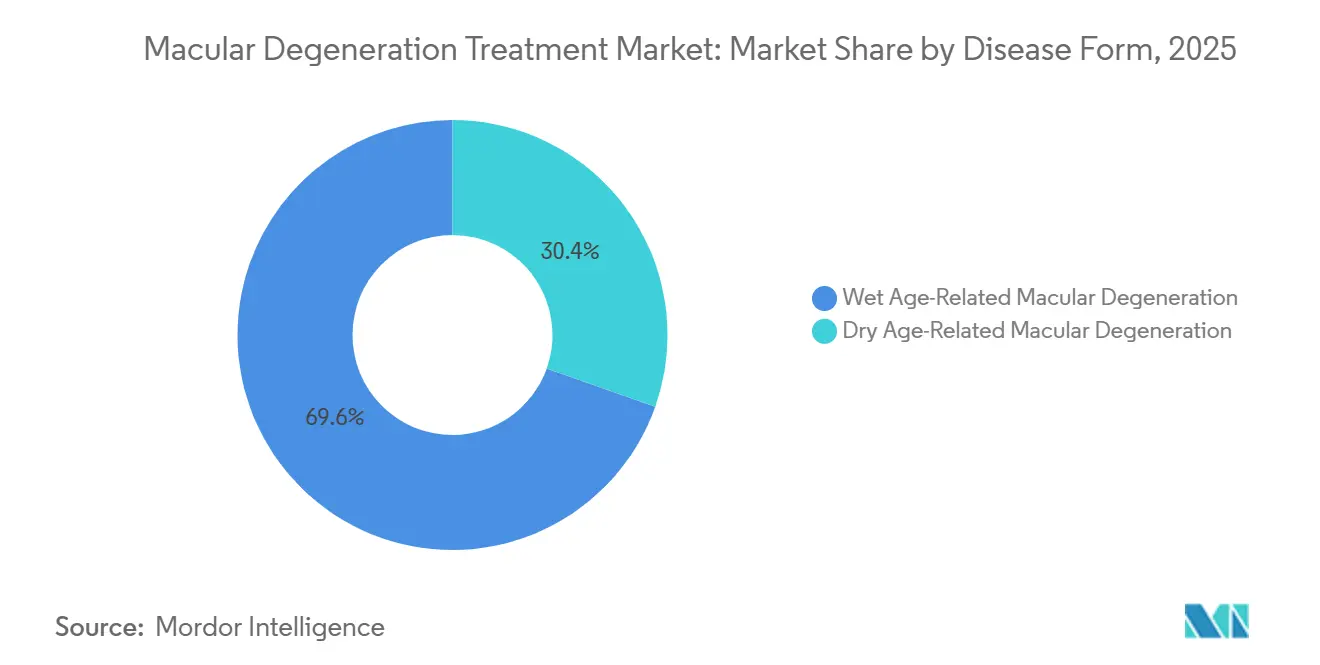
- By disease form, wet age-related macular degeneration led the macular degeneration treatment market with a 69.58% market share in 2025, while dry AMD is projected to expand at an 9.48% CAGR through 2031.
- By stage of disease, late-stage cases accounted for 57.53% of the macular degeneration treatment market size in 2025 and it is advancing at an 9.24% CAGR over 2026-2031.
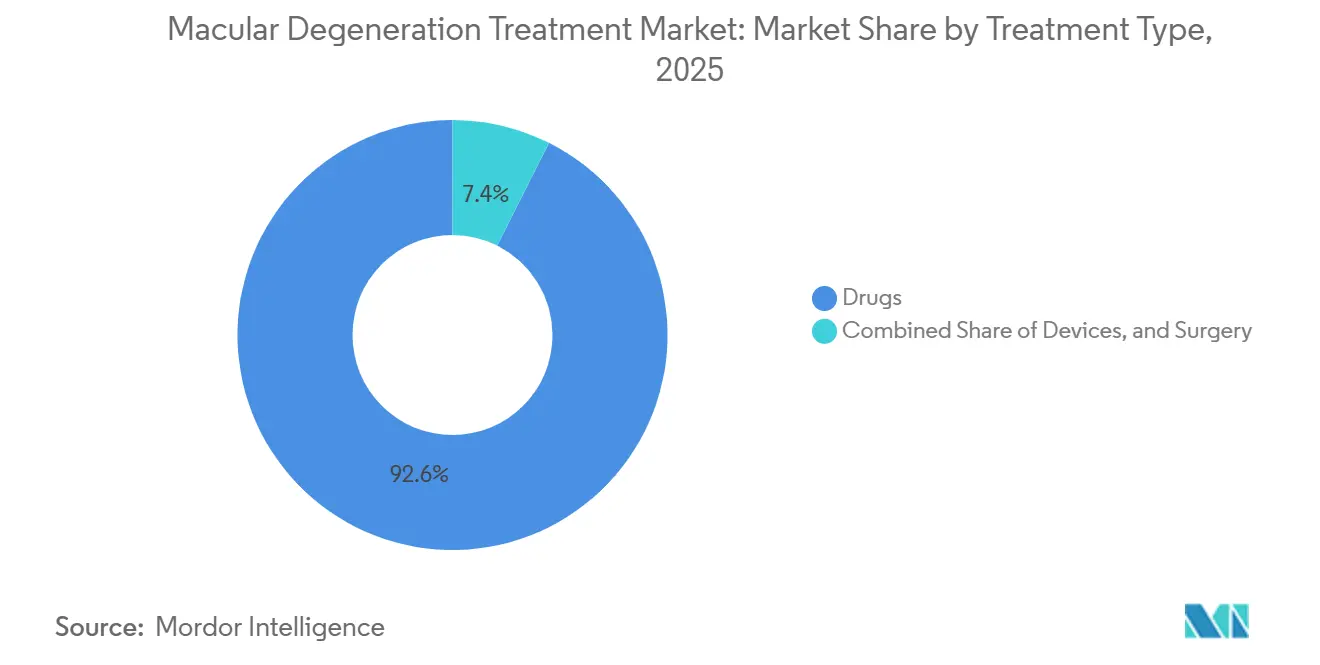
- By treatment type, drugs accounted for 92.60% of spending in 2025, and devices are rising at a 8.75% CAGR through 2031.
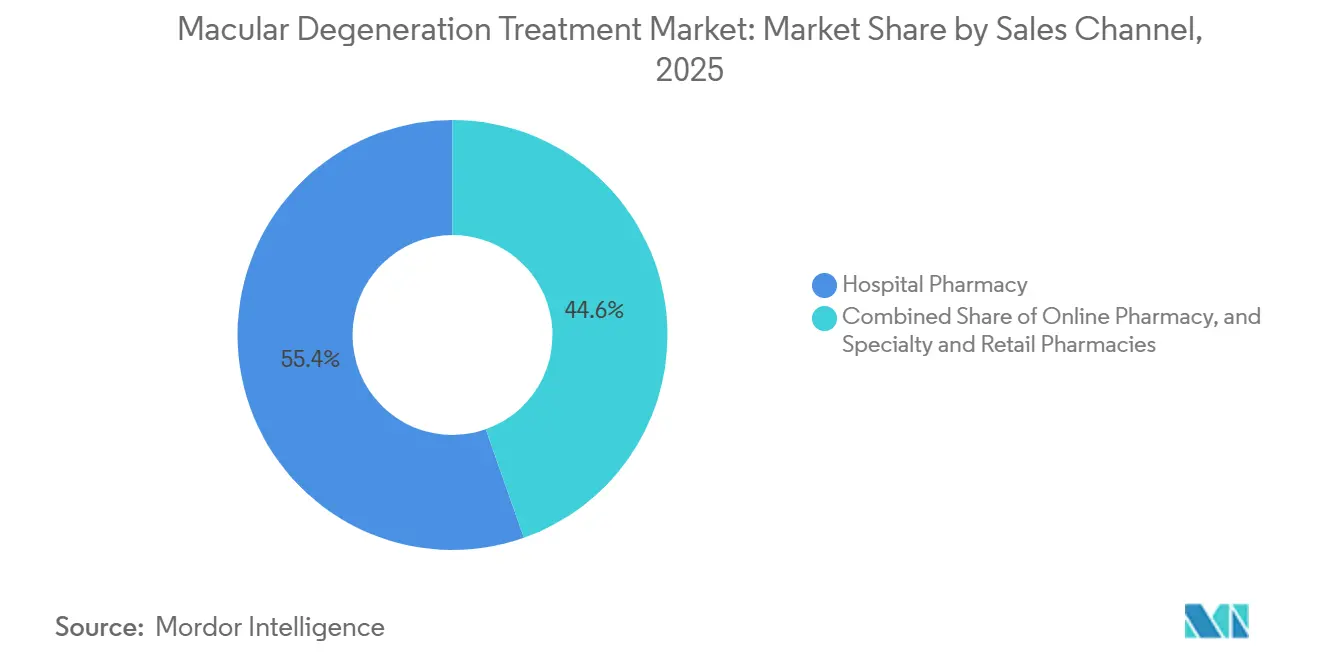
- By sales channel, hospitals held 44.29% share in 2025, whereas online pharmacies are set to climb at a 10.06% CAGR through 2031 as telemedicine integrates specialty fulfillment.
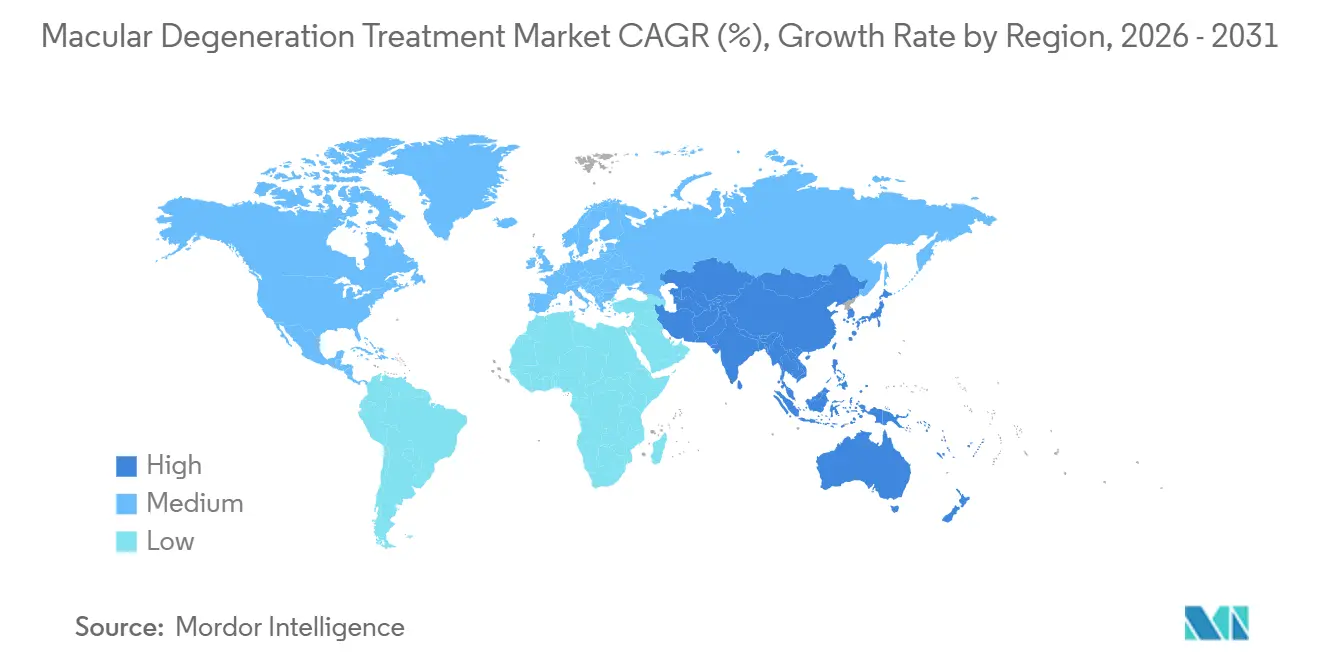
- By geography, Asia-Pacific is set to record the fastest 10.34% CAGR through 2031, although North America commanded 49.43% revenue in 2025.
Note: Market size and forecast figures in this report are generated using Mordor Intelligence’s proprietary estimation framework, updated with the latest available data and insights as of 2026.
Market Trends and Insights
Drivers Impact Analysis of Macular Degeneration Treatment Market*
| Driver | (~) % Impact on CAGR Forecast | Geographic Relevance | Impact Timeline |
|---|---|---|---|
| Rising Prevalence of AMD In Aging Populations | +2.1% | Global, with concentration in Japan, Germany, Italy, South Korea | Long term (≥ 4 years) |
| Rapid Expansion of Long-Acting Anti-VEGF Launches | +1.8% | North America, Europe, Australia | Medium term (2-4 years) |
| Improved Ophthalmic Imaging & AI-Enabled Early Detection | +1.3% | North America, APAC core (Japan, South Korea, Singapore) | Medium term (2-4 years) |
| Biosimilar-Led Price Erosion Widening Access in Ems | +1.0% | Europe, Latin America, Middle East, Southeast Asia | Short term (≤ 2 years) |
| Home-Monitoring Apps Boosting Diagnosed-to-Treated Ratio | +0.7% | North America, Western Europe | Short term (≤ 2 years) |
| Increasing Healthcare Expenditure on Vision Preservation | +0.9% | Global, led by OECD countries | Long term (≥ 4 years) |
| Source: Mordor Intelligence | |||
Rising Prevalence of AMD in Aging Populations
Japan recorded 36.2 million citizens aged 65 and above in 2024, equal to 29.1% of its total population, while South Korea crossed the “super-aged” threshold at 20% in 2025. China expects 400 million people over 60 by 2030, and AMD incidence more than doubles with every decade after 60[1]. Germany, Italy, and Spain each exceeded a 23% elderly share in 2025, driving double-digit growth in retina clinic visits. Because central-vision loss restricts daily living, governments fund AMD care even during economic downturns, shielding the macular degeneration treatment market from cyclical risk. These demographic realities create durable visibility into demand for at least the next two decades.
Rapid Expansion of Long-Acting Anti-VEGF Launches
Roche’s bispecific faricimab enabled 60% of trial participants to maintain 16-week intervals, halving the injection frequency compared with monthly aflibercept. Genentech’s Port Delivery System, a surgically implanted refillable ranibizumab reservoir, extends dosing to six-month intervals and received FDA clearance in 2024. Regeneron’s Eylea HD gained approval in 2024 with 8 mg strength that permits 12-16-week maintenance after loading. Extended durability reduces visit-related costs by USD 1,200-1,800 per patient annually in the United States. As durability improves, patient adherence climbs, and payers realize net savings, amplifying volume without proportional cost expansion in the macular degeneration treatment market.
Improved Ophthalmic Imaging & AI-Enabled Early Detection
Heidelberg Engineering integrated AI algorithms that automatically quantify drusen volume and pigmentary changes, reducing manual grading time by 80%. Topcon’s Harmony platform flags >10% annual drusen growth, directing high-risk patients toward complement-inhibition therapy. Japan mandated AI-OCT in annual municipal check-ups for seniors starting April 2025, boosting early-stage AMD diagnoses by 34% in pilot prefectures. Sensitivity and specificity above 89% enable prophylactic therapy before photoreceptor loss, expanding the funnel from diagnosed to treated in the macular degeneration treatment market. Earlier intervention lowers long-term disability costs and strengthens payer alignment with preventive care models
Biosimilar-Led Price Erosion Widening Access in Emerging Markets
Samsung Bioepis introduced SB11, a ranibizumab biosimilar, in the European Union at a 35% discount in January 2025, accelerating treatment volumes by 22% in Central and Eastern Europe. Formycon’s FYB203 entered 12 EU countries at 40% under originator pricing in September 2025, with Spain and Italy mandating substitution for naïve patients. In India, ranibizumab biosimilars cost INR 8,500 (USD 102) versus INR 28,000 for the branded product, increasing injection uptake by 47% in tier-2 cities. Brazil’s public health system added bevacizumab biosimilars to its formulary, expanding coverage to 2.3 million additional beneficiaries. These moves temper spending pressure and enlarge patient pools, buttressing revenue growth even as unit prices fall.
Restraints Impact Analysis of Macular Degeneration Treatment Market*
| Restraint | (~) % Impact on CAGR Forecast | Geographic Relevance | Impact Timeline |
|---|---|---|---|
| High Cost of Biologic and Gene Therapies | -1.4% | Global, acute in Latin America, Middle East, Africa, South Asia | Medium term (2-4 years) |
| Limited Reimbursement in Low-Income Regions | -0.9% | Sub-Saharan Africa, Southeast Asia (excluding Singapore), Central America | Long term (≥ 4 years) |
| Stringent Regulatory and Safety Requirements | -0.6% | Global, with extended timelines in EU, Japan | Medium term (2-4 years) |
| Chronic Treatment Burden and Patient Non-Compliance | -0.8% | Global, pronounced in rural and underserved areas | Short term (≤ 2 years) |
| Source: Mordor Intelligence | |||
High Cost of Biologic and Gene Therapies
Originator anti-VEGF biologics list at USD 1,850-2,400 per dose in the United States, translating to USD 11,000-14,000 annually for monthly regimens. Gene-therapy candidates such as RGX-314 may launch at USD 600,000-750,000 per eye, echoing pricing precedents like Luxturna. In Brazil, one aflibercept injection equals 8.5 months of minimum-wage income, forcing legal action to secure public-sector supply. High upfront costs impede early intervention, causing patients to present later when therapy is less effective yet more expensive, thereby damping the macular degeneration treatment market growth potential[2].
Limited Reimbursement in Low-Income Regions
Many public health systems earmark less than 2% of their budgets for ophthalmology. Kenya’s insurance covers cataract surgery but excludes intravitreal biologics. The Philippines reimburses only 43% of the actual price of ranibizumab, deterring two-thirds of diagnosed patients from initiating treatment. Guatemala employs 47 retina specialists for 18 million people, concentrating services in the capital. Registration delays of 18-24 months for biosimilars prolong monopolies, keeping prices high and limiting market penetration of macular degeneration treatments.
*Our forecasts treat driver/restraint impacts as directional, not additive. The impact forecasts reflect baseline growth, mix effects, and variable interactions.
Macular Degeneration Treatment Market Segment Analysis
By Disease Form:
Therapeutic Shift Toward Dry AMDWet AMD retained 69.58% of 2025 revenue, yet dry AMD is forecast to grow at an 9.48% CAGR as complement inhibitors secure commercial traction. The macular degeneration treatment market size for dry AMD is expected to widen rapidly once physicians gain confidence in lesion-growth reduction data. Monthly pegcetacoplan and avacincaptad pegol doses slowed geographic-atrophy expansion by up to 36%, a meaningful halt that supports premium reimbursement. Wet-form revenue is easing because biosimilar ranibizumab already accounts for 28% of European volume, and extended-interval aflibercept reduces vials per patient by 40% over three years[3].
Pipeline activity blurs categorical lines; up to 20% of dry AMD patients convert to neovascular disease, and combination trials are testing dual anti-VEGF plus complement blockade. Gene-therapy vectors encoding complement regulators, such as 4D-150, achieved early proof of concept with 68% vision stability at 12 months[4]. As durable agents migrate from clinic to market, dry-form uptake will offset biosimilar erosion on the wet side, preserving overall macular degeneration treatment market momentum.
By Stage of Disease:
Intermediate-Stage Prevention Is the Fastest-Rising NicheLate-stage disease accounted for 57.53% of revenue in 2025 because neovascular cases require frequent anti-VEGF dosing, and geographic atrophy now has disease-modifying options. The macular degeneration treatment market share for early-stage remains modest, but intermediate-stage volume is climbing at an 7.63% CAGR on the back of AI-OCT triage and risk-based reimbursement approvals in Germany and the Netherlands. Extended detection widens the eligible cohort: over 3.2 million Americans have intermediate dry AMD but show no symptoms; payers now reimburse prophylactic complement inhibition for the top-risk quintile.
Adherence bottlenecks curb late-stage growth, as 58% of patients discontinue monthly anti-VEGF therapy within five years. In contrast, intermediate-stage patients often maintain better visual acuity and are more motivated to comply with less-frequent dosing. National screening in Japan identified 340,000 high-risk citizens in its first year, demonstrating that policy mandates can accelerate the growth of the macular degeneration treatment market for preventive therapy.
By Treatment Type:
Devices Accelerate While Drugs MatureDrugs accounted for 92.60% of 2025 spending, led by anti-VEGF agents whose biosimilar versions depress unit pricing while sustaining high volume. Complement inhibitors added USD 1.1 billion last year and will scale further as payers embrace their lesion-slowing benefit, although monthly dosing moderates persistence. Devices are the fastest-growing slice at an 8.75% CAGR, buoyed by Medicare coverage for electronic magnifiers and retinal implants that restore limited functional vision.
The macular degeneration treatment market size for devices also benefits from the elderly's preference for non-invasive solutions once pharmacologic options plateau. Second Sight’s cortical implant entered limited European launch at USD 165,000 per unit, meeting pent-up demand among legally blind AMD patients. Telescopic contact lenses reached 18% penetration among eligible U.S. patients within 12 months, underscoring the willingness of patients to adopt wearable aids.

By Sales Channel:
Online Pharmacy Emerges as High-Growth OutletHospitals still accounted for 44.29% of 2025 revenue, as most biologics require cold-chain storage and on-site preparation under sterile conditions. Specialty and retail pharmacies manage oral nutraceuticals and some prefilled syringes, but online channels are booming at a 10.06% CAGR due to Amazon Pharmacy and CVS digital offerings that ship AREDS2 vitamins and low-vision aids within 48 hours. The macular degeneration treatment market share for online channels will continue rising as manufacturers develop room-temperature-stable anti-VEGF formulations that meet home-delivery regulations.
Alto Pharmacy’s AMD program bundled tele-optometry consults with automated refills, pushing adherence to 89% versus 62% for brick-and-mortar counterparts. Walgreens’ partnership with Notal Vision to rent home OCT units tightens the feedback loop between monitoring and drug shipment, illustrating how digital ecosystems can capture recurring revenue in the macular degeneration treatment market.
Geography Analysis
North America Macular Degeneration Treatment Market
North America generated 49.43% of 2025 revenue, underpinned by Medicare Part B reimbursement that pays USD 650-850 per injection, including drug and professional fees Eylea HD obtained a USD 2,105 Part B payment rate in 2024, encouraging volume discounts and supporting steady procedure growth despite biosimilar entry. Canada covers ranibizumab and aflibercept under provincial formularies, yet faricimab access lags, leading patients to appeal through Exceptional Access Programs that add six-week delays. Mexico expanded coverage for ranibizumab biosimilars in 2025 through Seguro Popular, yet rural areas continue to experience specialist shortages that limit penetration.
APAC Macular Degeneration Treatment Market
Asia-Pacific is the fastest-growing region, advancing at a 10.34% CAGR. Japan reimburses up to 90% of biologic costs for seniors, with out-of-pocket caps of JPY 80,000 (USD 550) per month, driving high adherence. China added ranibizumab biosimilars to 15 provincial lists, trimming patient costs by 70% and expanding the market for macular degeneration treatments among urban workers. South Korea’s risk-sharing pact for faricimab caps annual expenses at KRW 12 million (USD 9,200), fuelling rapid uptake. India remains constrained; fewer than 20% of diagnosed patients initiate anti-VEGF therapy due to out-of-pocket costs exceeding INR 25,000 (USD 300) per injection.
Europe Macular Degeneration Treatment Market
Europe enjoys broad access, yet budgets are tight. Germany and France mandate biosimilar substitution for treatment-naïve cases, propelling 24% volume share for SB11 within 18 months. The United Kingdom negotiated confidential discounts that lowered per-injection spending by roughly 40%, adding 22% capacity without extra budget. Spain and Italy imposed monthly injection quotas in 2025, delaying therapy for 12-18% of patients and spurring legal challenges now pending before the European Court of Justice.
MEA and LATAM Macular Degeneration Treatment Market
The Middle East and Africa remain nascent contributors. Saudi Arabia’s Vision 2030 plan earmarked SAR 800 million (USD 213 million) for 40 new retina clinics, improving geographic coverage. South Africa’s public sector does not reimburse anti-VEGF agents, limiting access to the privately insured 9 million residents. Latin America is mixed; Brazil’s public system adopted bevacizumab biosimilars, while Argentina’s economic turmoil and triple-digit inflation in 2024 disrupted imports of branded biologics.
Regulatory Landscape
Regulatory oversight for macular degeneration therapeutics is anchored by the US Food and Drug Administration (FDA) and the European Medicines Agency (EMA). Efficacy and ocular safety requirements for neovascular AMD are shaped by FDA guidance specific to drug development in this indication. In the United States, life-cycle changes that reduce injection burden are a key approval pathway, illustrated by the FDA approval in April 2026 extending EYLEA HD (aflibercept) dosing intervals up to 20 weeks for wet AMD and diabetic macular edema after a year of successful treatment. Formulation and presentation updates also move through streamlined label pathways, including the FDA approval in July 2024 for Genentech's Vabysmo prefilled syringe for retinal indications.
Biosimilar authorization in the United States and Europe continues to widen payer and provider options. The FDA approval of Sandoz's Enzeevu (aflibercept-abzv) came in August 2024, followed by EMA marketing authorisations for Baiama (January 2025) and Eyluxvi (September 2025) for aflibercept biosimilarity. In 2026, the EMA granted marketing authorisation for the ranibizumab biosimilar Ranluspec (February 2026), and the CHMP adopted a positive opinion for another ranibizumab biosimilar (Vislyfa) in May 2026. These steps reinforce the regulatory emphasis on comparability packages (analytical similarity and equivalent clinical performance) as a route to faster market entry. For differentiated biologics and repurposed ophthalmic formulations, timelines remain influenced by safety monitoring and complete-response cycles, reflected by the FDA acceptance in June 2026 of the resubmitted BLA for ONS-5010/LYTENAVA, with a PDUFA target action date of July 29, 2026.
Competitive Landscape
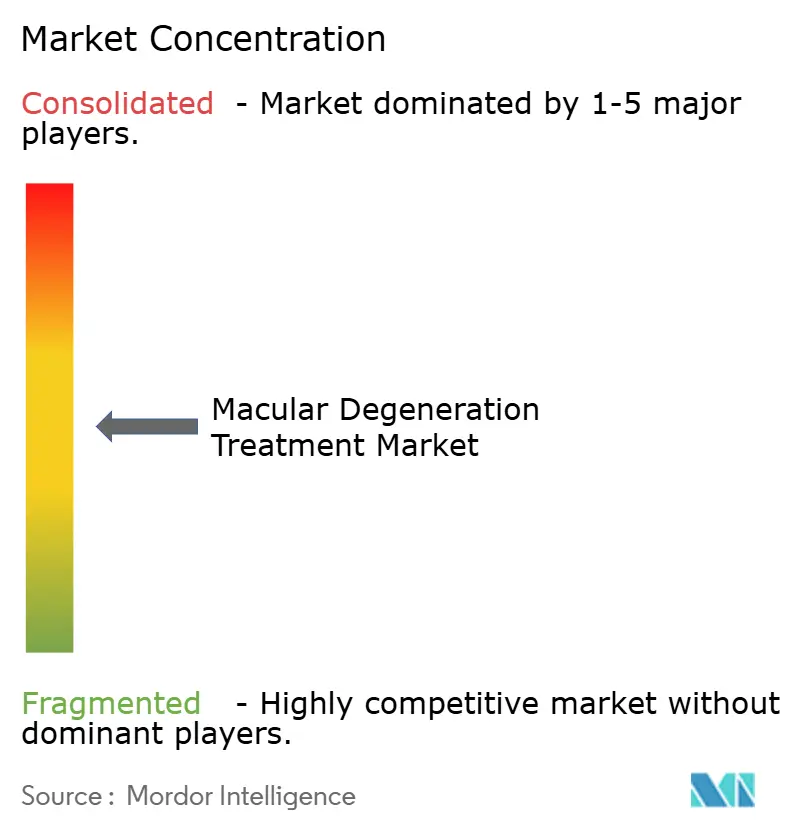
The macular degeneration treatment market remains moderately concentrated, with Regeneron, Roche, and Novartis generating the majority of 2025 revenue, yet competitive pressures are intensifying. Originators are extending the lifecycle through high-dose or room-temperature-stable formulations and by bundling AI-diagnostic platforms that improve dosing precision and patient outcomes. Roche’s 4.2 million-image OCT database trains algorithms that predict individual response and schedule injections only when needed, lowering per-patient drug burden by 18% and fortifying brand loyalty.
Biosimilar manufacturers such as Samsung Bioepis and Formycon captured 24% of European ranibizumab and aflibercept volume within 18 months, prompting 30% discounts on Lucentis in Germany and spurring Bayer to bundle Eylea with diagnostic hardware in tenders. Patent cliffs loom: Aflibercept’s U.S. exclusivity expires in 2027, likely compressing EBITDA margins by 8-12 percentage points for originators.
Innovation is diversifying. Apellis and Astellas commercialized the first complement inhibitors for dry AMD but hold only 18% patient penetration amid monthly-dose fatigue; they are testing sustained-release implants to widen appeal. Gene-therapy aspirants such as REGENXBIO and Adverum target one-time dosing that could recast revenue models from recurring prescriptions to annuity-like payments. Smaller device firms Second Sight, IrisVision, VisionCare are carving out high-value niches among late-stage patients who seek restored functional vision over lesion stabilization.
Macular Degeneration Treatment Industry Leaders
-
Novartis AG
-
F. Hoffmann-La Roche Ltd
-
Apellis Pharmaceuticals Inc. (Biogen)
-
Astellas Pharma Inc.
-
Regeneron Pharmaceuticals, Inc.
- *Disclaimer: Major Players sorted in no particular order
Macular Degeneration Treatment Market Companies Covered in this Report
- Commercial Companies
- Pipeline Companies
Recent Industry Developments in Macular Degeneration Treatment Market
- April 2026: Regeneron reported that the US FDA approved extending EYLEA HD (aflibercept) 8 mg dosing intervals up to 20 weeks (5 months) for wet AMD and diabetic macular edema after one year of successful treatment. The label update strengthens durability-based differentiation in anti-VEGF maintenance and supports clinic workflow relief by reducing injection visits for eligible patients.
- October 2025: REGENXBIO announced completion of enrollment in the pivotal ATMOSPHERE and ASCENT trials for surabgene lomparvovec (ABBV-RGX-314) in wet AMD. Fully enrolled Phase 3 programs increase visibility for one-time gene therapy as a competitive alternative to chronic intravitreal dosing and sharpen planning for retina-site capacity and trial-to-commercial transitions.
Macular Degeneration Treatment Market Report Scope and Research Methodology
Market Definition and Coverage
This market covers revenues from diagnosing and treating macular degeneration, mainly age-related macular degeneration (AMD), using medicines, procedures, and related ophthalmic interventions delivered through standard clinical pathways.
Scope exclusions: This sizing does not include general vision correction products or routine eye exams unless they are directly tied to macular degeneration treatment use.
Segments Covered in This Report
- By Disease Form
- Dry Age-Related Macular Degeneration
- Wet Age-Related Macular Degeneration
- By Stage of Disease
- Early-Stage AMD
- Intermediate-Stage AMD
- Late-Stage AMD
- By Treatment Type
- Drugs
- By Drug Type
- Anti-VEGF Agents
- Complement Pathway Inhibitors
- Gene & Cell Therapies
- Dietary Supplements & Antioxidants
- Other Drugs
- By Route of Administration
- Intravitreal
- Suprachoroidal
- Intravenous
- By Drug Type
- Devices
- Low-Vision Glasses
- Contact Lenses
- Retinal Implants & Vision Aids
- Surgery
- Laser Photocoagulation
- Photodynamic Therapy
- Other Surgical Procedures
- Drugs
- By Sales Channel
- Hospital
- Online Pharmacy
- Specialty & Retail Pharmacies
- Others
- Geography
- North America
- United States
- Canada
- Mexico
- Europe
- Germany
- United Kingdom
- France
- Italy
- Spain
- Rest of Europe
- Asia-Pacific
- China
- India
- Japan
- Australia
- South Korea
- Rest of Asia-Pacific
- Middle East and Africa
- GCC
- South Africa
- Rest of Middle East and Africa
- South America
- Brazil
- Argentina
- Rest of South America
- North America
Data Sources, Market Sizing, and Validation
Desk Research
Desk research starts with public epidemiology and health system statistics so the addressable patient pool is grounded in what is reported. We typically lean on sources such as CDC vision health resources, the US National Eye Institute, WHO aging and eye health publications, OECD health data, and peer-reviewed ophthalmology journals that publish prevalence and treatment patterns.
We then add regulatory and product signals, along with practical commercial context, using sources such as FDA and EMA labels and approvals, clinical trial registries, company annual reports and investor decks, and reputable medical association websites. In parallel, we use paid subscriptions for company financials and intelligence, news and financials, and patent databases to sanity check launch timing, loss of exclusivity timing, and pipeline maturity. The sources listed here are illustrative only, and many other public references were also used for data collection, validation, and clarification.
Primary Interviews and Surveys
Primary interviews are used to pressure test the model with people who follow real treatment flows, such as retina specialists, hospital and specialty pharmacy leaders, payers, and distribution-side executives. Respondent inputs also clarified how access pathways differ by region, so dosing practices, reimbursement touchpoints, and price bands reflect local realities, and then our assumptions were refined before final sizing.
Distribution of primary research fieldwork respondents
| Company type | Respondent position | Region |
|---|---|---|
| Top tier: 27% | CXOs: 20% | APAC: 50% |
| Mid tier: 51% | Functional/Unit leaders: 25% | EMEA: 31% |
| Smaller Players: 22% | Managers: 55% | Americas: 19% |
Market-Sizing & Forecasting
Sizing is built using a top-down demand pool approach where prevalence by age band is translated into treated patients, then converted into revenues using therapy mix and typical annual cost per treated case. Because treatment is often chronic and protocol-driven, we focus on wet versus dry shares, anti-VEGF dosing frequency and persistence, uptake of newer mechanisms (for example complement inhibition in geographic atrophy), and the split of dispensing through hospital versus specialty pharmacy routes.
To keep totals realistic, we corroborate using selective bottom-up approximations, such as sampling average selling price ranges from public disclosures and checking implied volumes against procedure and injection cadence from expert feedback. When data is thin for smaller countries, gaps are handled by using proxy markets with similar age structure, reimbursement depth, and ophthalmology capacity, and the assumptions are adjusted during validation.
Forecasting relies mainly on scenario analysis supported by multivariate regression, where growth is linked to aging demographics, diagnosis rates, product lifecycle events, and expected shifts in dosing intervals. The final trajectory is not driven by one variable alone, and consensus views from interviews are used to keep adoption curves and price erosion paths within practical bounds.
Data Validation & Update Cycle
Outputs are checked against independent signals, including reported prevalence trends, therapy class shares described in public literature, and major regulatory and patent timeline events. Outliers are flagged, reviewed across analysts, and either corrected through assumption updates or escalated for another round of expert feedback before sign-off.
The report is refreshed on an annual schedule, and interim updates are triggered when material events occur, such as a major approval, a safety label change, or an unexpected access shift. Before delivery, a final analyst pass is completed so the numbers reflect the latest available information and consistent model logic.
Mordor Intelligence's Macular Degeneration Treatment Market Size Compared With Other Published Estimates
Published market values for macular degeneration treatment often differ because underlying counting rules can change from one study to another. The main drivers are usually what is included as treatment revenue, which year is treated as the current reference point, and how quickly price and uptake are allowed to change across the forecast horizon.
Injection cadence patterns from retina clinics, along with public regulatory timing and therapy mix signals, are used to keep Mordor Intelligence aligned to a treated patient revenue pool. This reduces the risk of mixing in adjacent eye-care spending that is not treatment-specific.
Benchmark comparison
| Source | Market Size | Gaps in Research Methodology |
|---|---|---|
| Mordor Intelligence | USD 18.21 B (2026) | |
| Global Consultancy A | USD 14.19 B (2024) | Uses an earlier base year and may apply a different inclusion boundary for treatment revenues across drugs, procedures, and low vision aids, which can compress the reported total when mapped to later years. |
| Trade Publisher B | USD 11.05 B (2024) | Defines the market through a revenue lens that can exclude parts of the clinical treatment pathway and may apply conservative conversion assumptions for treated prevalence and annual therapy cost in 2024 values. |
The spread in the table mainly comes from base-year choice and what each source counts as treatment-linked revenue. By keeping the patient-to-therapy logic explicit and then cross-checking it with real-world dosing and access signals, our estimate stays traceable to practical variables that can be reviewed and updated in a repeatable way.
Key Questions Answered in the Report
How big is the macular degeneration treatment market in 2026?
The macular degeneration treatment market size stands at USD 16.73 billion in 2026 and is on course to reach USD 25.19 billion by 2031.
What is driving growth in Asia-Pacific?
Public reimbursement expansion in Japan, China, and South Korea plus rapid population aging is lifting Asia-Pacific revenue at a 10.34% CAGR.
Why are complement inhibitors important?
They provide the first disease-modifying option for dry AMD, slowing geographic-atrophy lesion growth by up to 36% and filling a major unmet need.
Will biosimilars hamper market value?
Biosimilars lower unit prices but expand patient access; originators offset the impact with long-acting formulations, so total market value continues to rise.
When could gene therapy reach the market?
Pivotal trials for RGX-314 and ADVM-022 read out in late 2026, positioning the first one-time AMD gene therapies for potential approval by 2028.