
Machinery Rental And Leasing Market Size and Share
Market Overview
| Study Period | 2020 - 2031 |
|---|---|
| Market Size (2026) | USD 142.73 Billion |
| Market Size (2031) | USD 181.04 Billion |
| Growth Rate (2026 - 2031) | 4.86 % |
| Fastest Growing Market | Asia Pacific |
| Largest Market | North America |
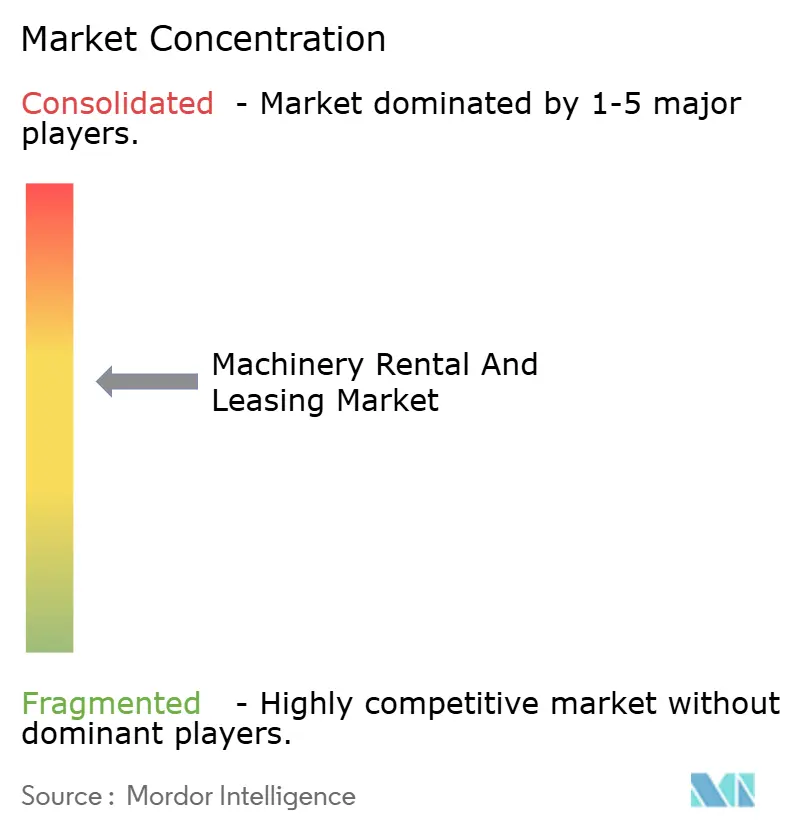
| Market Concentration | Medium |
Major Players *Disclaimer: Major Players sorted in no particular order Image © Mordor Intelligence. Reuse requires attribution under CC BY 4.0. | |
Machinery Rental And Leasing Market Analysis by Mordor Intelligence
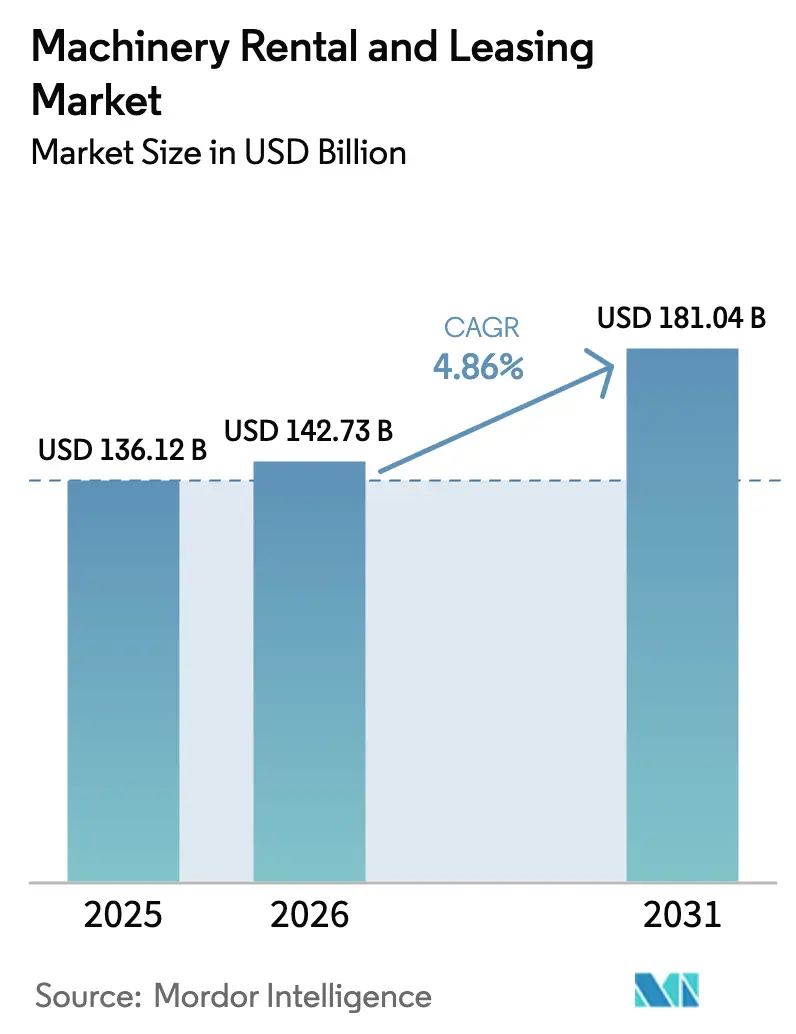
The machinery rental and leasing market size in 2026 is estimated at USD 142.73 billion, growing from 2025 value of USD 136.12 billion with 2031 projections showing USD 181.04 billion, growing at 4.86% CAGR over 2026-2031. Sustained infrastructure spending in the United States, the European Union, and Asia-Pacific underpins demand as enterprises favor flexible equipment access over ownership. High capital costs, accelerating technology cycles, and stringent sustainability mandates to steering corporate and public buyers toward rental or lease options. Digital marketplaces further widen the addressable customer base by shortening procurement lead-times, while telematics enhances fleet visibility, which improves utilization and return on assets. Growth pockets emerge in material-handling applications, government procurement, and hybrid Equipment-as-a-Service contracts that bundle analytics and maintenance.
Key Report Takeaways
- By service type, rental services accounted for 72.88% revenue share in 2025. Leasing will post the fastest expansion at a 5.06% CAGR through 2031.
- By equipment type, construction equipment held 40.76% of the machinery rental and leasing market share in 2025. Material-handling equipment is forecast to advance at a 5.08% CAGR to 2031.
- By customer type, SMEs contributed 54.11% of transactions in 2025. Government agencies are anticipated to grow at a 5.12% CAGR through 2031.
- By mode of rental, offline distribution retained 86.98% of revenue in 2025, while online channels are set to climb at a 5.01% CAGR to 2031.
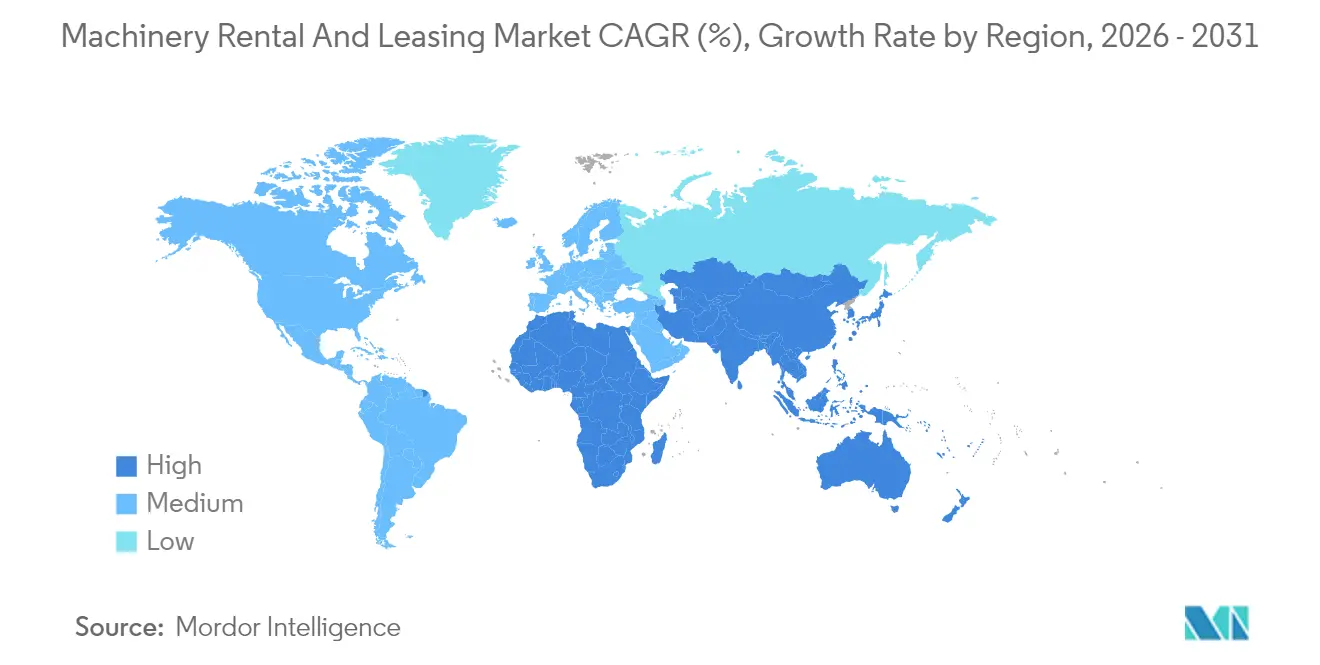
- By geography, North America captured 35.21% of global value in 2025. Asia–Pacific is projected to register a 5.03% CAGR between 2026 and 2031.
Note: Market size and forecast figures in this report are generated using Mordor Intelligence’s proprietary estimation framework, updated with the latest available data and insights as of 2026.
Market Trends and Insights
Drivers Impact Analysis of Machinery Rental And Leasing Market*
| Driver | (~) % Impact on CAGR Forecast | Geographic Relevance | Impact Timeline |
|---|---|---|---|
| Rise Of Infrastructure Megaprojects | +1.2% | Global, concentrated in North America, Europe, Asia Pacific | Long term (≥ 4 years) |
| High Equipment Ownership Cost | +0.8% | Global | Medium term (2-4 years) |
| Surging Demand For Short-Cycle Capex Flexibility | +0.7% | Global, particularly North America and Europe | Short term (≤ 2 years) |
| Digital Rental Platforms | +0.6% | Global, led by North America | Medium term (2-4 years) |
| Equipment-As-A-Service (EaaS) | +0.5% | North America and Europe, expanding to Asia Pacific | Long term (≥ 4 years) |
| ESG Pressure To Optimise Utilisation | +0.4% | Global, strongest in Europe and North America | Long term (≥ 4 years) |
| Source: Mordor Intelligence | |||
Rise of Infrastructure Megaprojects Drives Equipment Demand
A federal investment package in the United States and a climate transition program across the European Union extend equipment orders well into the next decade. China’s Belt and Road Initiative, attracting massive revenue in cumulative capital, deepens rental penetration across Southeast and Central Asia. Rental fleets absorb project-specific demand spikes more efficiently than owner-operators because specialized machinery can be redeployed at the project closeout stage. Contractors in California, Texas, and Florida tap rental agreements to execute in state-level road and bridge projects scheduled for completion by 2028 [1]. High utilization in megaproject corridors strengthens pricing power for fleet operators and reinforces the equipment-as-a-service narrative that pairs availability with guaranteed uptime.
High Equipment Ownership Cost Accelerates Rent-Versus-Buy Decisions
Since 2022, prices for new earth-moving and lifting machinery have significantly increased. This spike is largely attributed to rising costs in steel, electronics, and freight, which have inflated OEM material bills. Concurrently, parts shortages have driven maintenance expenses higher each year. This trend is eroding the profitability of low utilization rates, a norm in cyclical construction. Rental contracts have become a strategic move, allowing fleet operators to sidestep risks associated with technology obsolescence and capital lock-in. These operators frequently refresh their assets on a large scale. Instead of making substantial investments in single units, contractors are now opting for rentals. This shift grants them immediate access to cutting-edge electric and autonomous models, all integrated with IoT diagnostics. Consequently, there's been a notable increase in rental penetration, especially among midsize builders and specialty trades, who are navigating tight project-cycle milestones.
SME Demand for Short-Cycle Capex Flexibility Intensifies
Small and medium enterprises account for more than half the global customer base. These firms face uneven order books and credit constraints, prompting an operational preference for pay-per-use machinery. Port delays and semiconductor shortages that extend delivery lead-times from the customary three months to a year further push SMEs toward rental. Online marketplaces allow next-day equipment dispatch, compressing project mobilization timelines and letting SMEs preserve working capital for payroll, raw materials, and marketing. The flexibility edge widens because rental contracts embed compliance inspections and insurance, reducing administrative load on lean SME back-office teams [2].
Digital Platforms Transform Customer Acquisition and Fleet Optimization
Asset-light brokers such as EquipmentShare and BigRentz deploy artificial intelligence that allocates inventory across depots based on real-time demand signals. Telematics data informs predictive maintenance algorithms that cut idle hours, shrink downtime by one-third, and extend service life without compromising safety. Lower idle ratios allow platforms to offer dynamic discounts during low-demand periods while preserving margin through surge pricing in peak seasons. The software layer standardizes contract workflows and electronic payments, accelerating repeat bookings and widening the machinery rental and leasing market beyond traditional contractor segments.
Restraints Impact Analysis of Machinery Rental And Leasing Market*
| Restraint | (~) % Impact on CAGR Forecast | Geographic Relevance | Impact Timeline |
|---|---|---|---|
| Persistent Supply-Chain Volatility | -0.9% | Global, most acute in North America and Europe | Medium term (2-4 years) |
| Rising Interest Rates Lifting Financing Costs | -0.6% | Global, concentrated in developed markets | Short term (≤ 2 years) |
| Secondary Equipment Glut | -0.4% | North America and Europe primarily | Medium term (2-4 years) |
| Data-Security and Cyber-Risk | -0.3% | Global, highest impact in digitally advanced markets | Long term (≥ 4 years) |
| Source: Mordor Intelligence | |||
Persistent Supply-Chain Volatility Inflates Fleet Acquisition Costs
OEM lead times have significantly increased due to shortages in steel, microchips, and hydraulic components. As a result, invoice prices have risen considerably compared to previous levels. Rental companies are delaying fleet refresh cycles, causing machines to age beyond their optimal reliability. While operators are trying to mitigate rising maintenance costs through rate adjustments, the competitive market limits the extent of recovery. Some operators are adopting strategies such as placing bulk orders or diversifying their supplier base in regions like India and Mexico, but freight bottlenecks are reducing the effectiveness of these measures. Despite strong demand indicators, these challenges are putting pressure on profit margins and delaying expansion into new geographic areas.
Rising Interest Rates Increase Fleet Financing Expenses
Benchmark borrowing costs in the United States surged from near zero to more than one-fifth by 2025, forcing equipment financiers to reprice loans at a minimal rate for investment-grade lessees. Smaller regional rental firms pay double-digit rates, which raises hurdle rates for new fleet procurement. Costlier capital slows depot expansion plans and nudges some providers to lengthen replacement intervals, which may erode customer perception of equipment availability and quality. Interest rate inflation thus weighs on the machinery rental and leasing market by tempering supply expansion during a period of elevated demand [3].
*Our forecasts treat driver/restraint impacts as directional, not additive. The impact forecasts reflect baseline growth, mix effects, and variable interactions.
Machinery Rental And Leasing Market Segment Analysis
By Service Type:
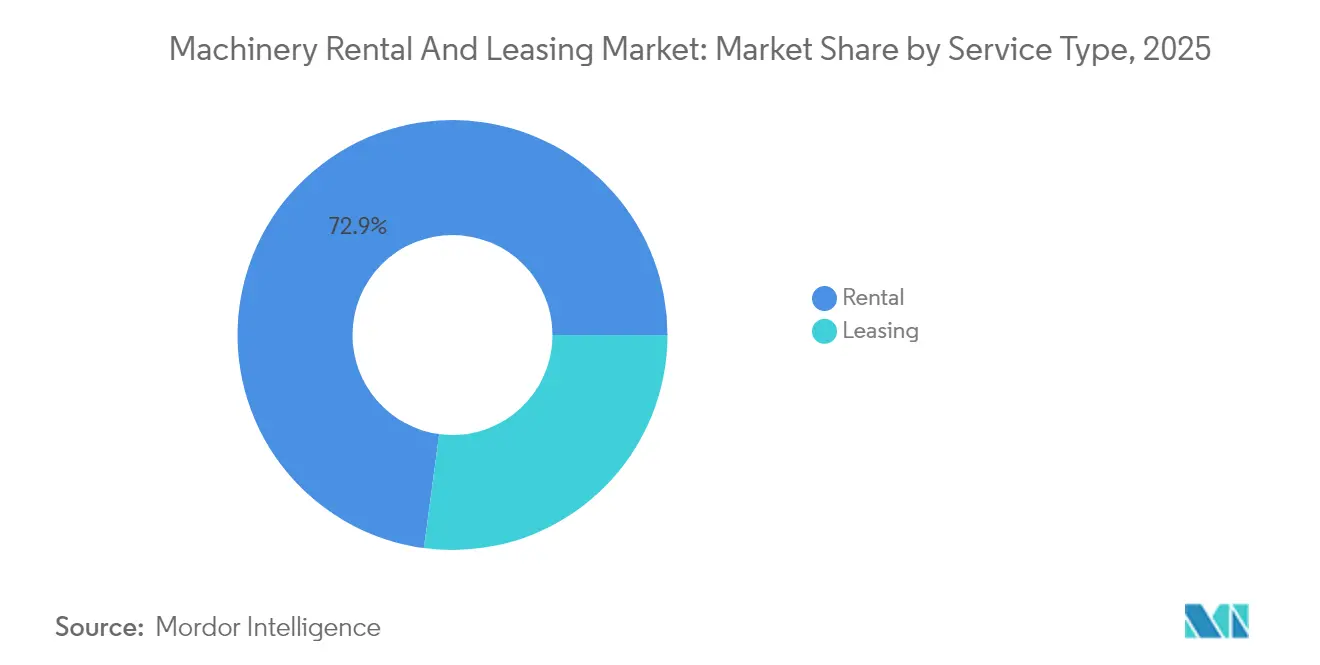
Rental Dominance Amid Leasing AccelerationThe machinery rental and leasing market size attributed to rental services was fairly high in 2024. Rental keeps leadership because contractors value the short-term alignment of payments with project cash flows, also accounting for 72.88% market share in 2025. High churn fleets enable providers to redeploy assets regionally, which sustains high utilization and supports consistent returns even when construction cycles soften.
Leasing gains traction, generating an exponential growth by 2031, with a CAGR of 5.06% through 2031, as manufacturers, energy companies, and logistics operators lock in multi-year equipment access under predictable cost structures. Accounting rule changes that place operating leases on balance sheets no longer sway the rent-versus-lease decision as strongly, shifting selection criteria toward uptime guarantees, technology refresh provisions, and embedded maintenance. Hybrid Equipment-as-a-Service contracts blur legacy boundaries by fusing rental flexibility with the multiyear continuity inherent in leasing.

By Equipment Type:
Construction Leadership With Material-Handling MomentumConstruction equipment accounted for 40.76% of global revenue in 2025. Fleet providers stock excavators, aerial work platforms, and tower cranes aligned to public-works timetables in the United States and Europe.
Nevertheless, material-handling equipment revenue is set to grow significantly by 2031 due to e-commerce fulfillment expansion. The segment’s 5.08% CAGR reflects warehouse automation rollouts where robotic pallet movers and telescopic handlers are essential yet episodically utilized, making rental the rational choice. Logistic center saturation across the Midwest United States and coastal China sustains steady month-to-month utilization, smoothing seasonal peaks often seen in construction.
By Customer Type:
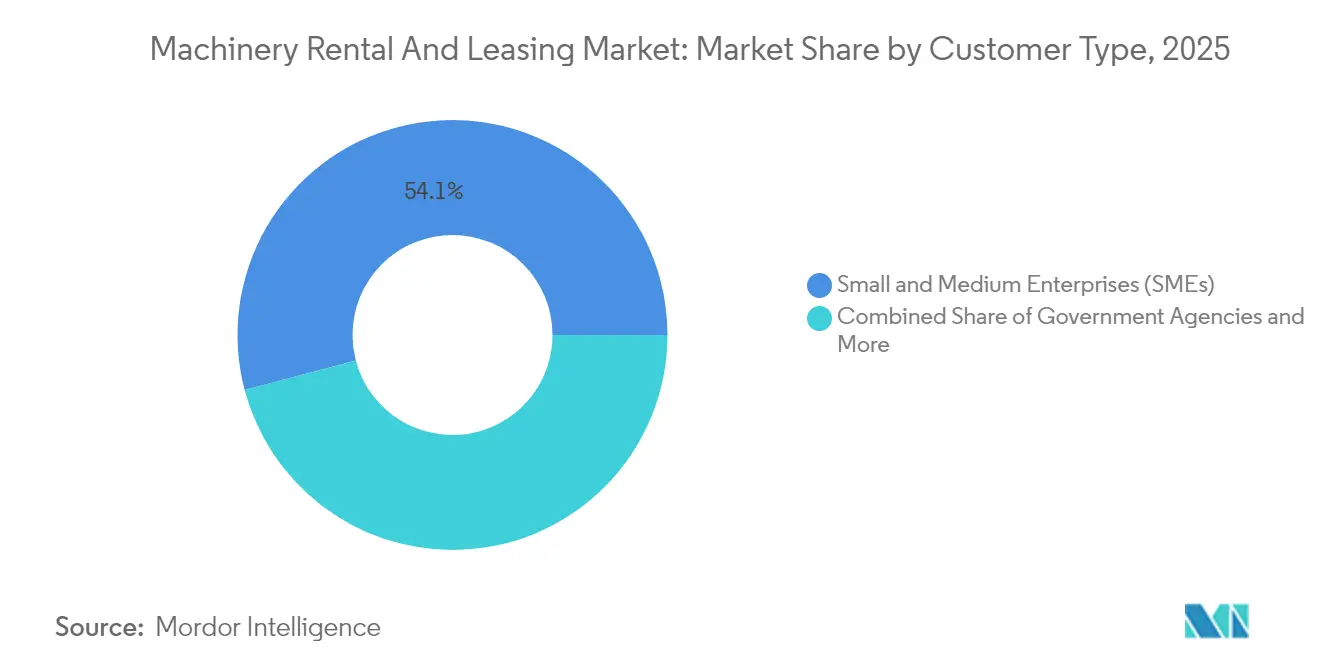
SME Dominance With Government AccelerationIn 2025, SMEs generated 54.11% of the machinery rental and leasing market. Their preference for variable cost structures and zero depreciation risk keeps rental intensity high.
Government agencies rank as the fastest-growing buyer group with a CAGR of 5.12% through 2031, driven by federally funded highway, bridge, and renewable energy initiatives. Public buyers also lean on fleet operators for Occupational Safety and Health Administration certifications and carbon reporting, duties that strain municipal procurement departments. Large corporations use rental to cover maintenance shutdowns and temporary capacity boosts during major capital upgrades, while individuals tap mobile apps for do-it-yourself landscaping and small renovation projects.
By Mode of Rental:
Digital Transformation Accelerates Online GrowthOffline depots produced 86.98% of 2025 turnover due to entrenched contractor relationships and the hands-on nature of heavy machinery inspections. Even so, online channels are projected to grow exponentially by 2031, reflecting a 5.01% CAGR.
Platforms integrate inventory search, contract e-signature, and logistics scheduling in a single interface that especially suits light equipment and short-duration rentals. Brick-and-mortar dealerships adopt hybrid models where digital storefronts secure reservations and depot staff handle delivery, training, and service calls. This convergence improves visibility into future fleet availability, supporting smarter asset rotations and capex planning.
Geography Analysis
North America Machinery Rental and Leasing Market
North America contributed significantly to global revenue in 2025, representing 35.21% of the machinery rental and leasing market. Sustained federal infrastructure disbursements and private housing refurbishments underpin robust utilization. United Rentals alone recorded vast rental revenue, anchoring capacity expansion and setting regional rate benchmarks. Canada’s resource extraction rebound adds steady demand for earth-moving equipment, particularly in Alberta oil sands and British Columbia mining operations.
APAC Machinery Rental and Leasing Market
Asia–Pacific will expand exponentially by 2031, with a 5.03% CAGR. China’s domestic rental turnover grew significantly in 2024, propelled by Belt and Road logistics construction and rapid urban redevelopment of tier-two cities. India’s National Infrastructure Pipeline targets roads, airports, and metro rail through 2030, elevating demand for cranes, concrete pumps, and compaction machinery. ASEAN member states also invest in port and renewable projects that lean on rental fleets for specialized lifting and piling equipment .
Europe Machinery Rental and Leasing Market
Europe generated a massive revenue in 2024 with stable, policy-driven growth. The EU Green Deal funnels funds into offshore wind foundations, grid modernization, and hydrogen pilot plants, each requiring bespoke lifting and on-site power solutions that favor rental over ownership. Stricter carbon disclosure rules encourage fleet operators to adopt electric mini excavators that can be rotated across multiple users, spreading the premium acquisition cost while meeting urban emission caps.
Regulatory Landscape
Regulation in the machinery rental and leasing market is shaped by safety, taxation, and contracting compliance, with material differences by jurisdiction. In the United States, state tax regimes affect rental pricing and invoicing practices, including Oregon's 2% heavy equipment rental tax (administered with quarterly filing deadlines of April 30, July 31, October 31, and January 31) and Michigan's 2% qualified heavy equipment rental personal property specific tax under Act 35 of 2022. Policy discussions around cost-recovery mechanisms have also moved forward in multiple states, with Nevada legislative review of industry-proposed recovery fees intended to better align tax collection with rental economic activity.
Operational requirements are reinforced through industry standards and associations that shape customer and insurer expectations. The American Rental Association (ARA) maintains the Standard Equipment Taxonomy (SET) to standardize equipment classification and data reporting across fleets, while the International Powered Access Federation (IPAF) publishes the IPAF Rental Standard (RP-3) as guidance for rental companies in powered access. Advocacy bodies such as the Associated Equipment Distributors (AED) and regional groups including the European Rental Association (ERA) engage on policy and harmonization efforts that affect rental documentation, safety practices, and compliance workflows.
Value Chain Analysis
The value chain begins with upstream OEMs and component suppliers providing construction, industrial, agricultural, and material-handling equipment, which rental and leasing companies procure and finance. They then position equipment across branch networks and depots. Fleet operators add value through specification, telematics fitment, maintenance, and refurbishment, then distribute equipment via offline branches and, increasingly, through online booking channels that integrate scheduling, delivery, and e-signature contracting. End users include SMEs, large corporates, government agencies, and individuals, with rental models covering peak demand, project-based needs, and short-cycle capacity requirements while shifting downtime and residual-value risk to fleet owners.
Standards, associations, and service ecosystems support scale and interoperability. ARA's Standard Equipment Taxonomy (SET) supports consistent fleet classification and benchmarking across operators and platforms, while the IPAF Rental Standard provides an operating framework for powered-access rental practices that influence training, handover, and safety processes. AED and other trade bodies provide advocacy and alignment across distributors, manufacturers, and rental operators, helping coordinate industry positions on taxes, fees, and operational requirements that shape fleet economics and customer contracting.
Competitive Landscape
In 2024, the top five companies commanded a significant share of the global revenue, indicating a moderate concentration and leaving space for regional contenders. United Rentals, with a vast network of depots, leverages data analytics to fine-tune its fleet mix and pricing based on zip codes. Ashtead Group, operating as Sunbelt Rentals in the United States, is on a fast track, with numerous new locations added through a mix of greenfield expansions and bolt-on acquisitions. Rounding out the top tier, Loxam, Aggreko, and Herc Rentals are each channeling investments into telematics and predictive maintenance to enhance asset turnover.
New-age players like EquipmentShare and BigRentz are carving a niche, focusing on platform scalability and an asset-light brokerage model. Harnessing artificial intelligence, they adeptly match latent demand with underused third-party assets. This strategy not only boosts revenue for regional owner-operators but also ensures a healthy margin spread. Notably, patent filings have seen a significant increase for telematics, fleet management software, and dynamic pricing algorithms, underscoring a heightened commitment to R&D, even from traditional hardware-centric players.
Industry players are adopting three primary strategies. Those leaning towards scale-driven consolidation benefit from purchasing discounts and a denser network. Digital innovators find value in data monetization and efficient matchmaking. Meanwhile, niche experts target lucrative segments, such as renting HVAC chillers for data centers or providing aerial access for wind turbine upkeep. The machinery rental and leasing sector is thus navigating a path between the advantages of consolidation and the depth of localized expertise, with emerging partnerships aiming to blend these strengths seamlessly.
Machinery Rental And Leasing Industry Leaders
-
United Rentals Inc.
-
Ashtead Group plc (Sunbelt Rentals)
-
Herc Holdings Inc. (Herc Rentals)
-
WillScot Mobile Mini Holdings Corp.
-
H&E Equipment Services Inc.
- *Disclaimer: Major Players sorted in no particular order
Machinery Rental And Leasing Market Companies Covered in this Report
- United Rentals Inc.
- Ashtead Group plc (Sunbelt Rentals)
- Herc Holdings Inc. (Herc Rentals)
- H&E Equipment Services Inc.
- WillScot Mobile Mini Holdings Corp.
- Ahern Rentals
- Aggreko plc
- Maxim Crane Works
- Caterpillar (The Cat Rental Store)
- Finning International
- Kiloutou SAS
- Loxam Group
- Aktio Corporation
- Kanamoto Co., Ltd.
- Byrne Equipment Rental
- Coates Hire
- EquipmentShare
- BigRentz Inc.
- Custom Truck One Source Inc.
- Alta Equipment Group Inc.
- McGrath Rentcorp
- Sunstate Equipment Co.
- Speedy Hire plc
- United Equipment Hire (NZ)
Market Opportunities and Future Outlook
Digital standardization and data-driven fleet operations represent a key whitespace across fragmented regional supply, especially as online booking grows from a smaller base than offline-dominated distribution. ARA's Standard Equipment Taxonomy (SET) and the IPAF Rental Standard offer building blocks for more consistent equipment classification, handover, and compliance documentation across operators and platforms. That alignment can support wider multi-branch utilization and improve cross-market inventory visibility. Operators and marketplaces that standardize cataloging, inspection records, and telematics-backed utilization reporting around these frameworks tend to gain leverage with SMEs and government agencies that need faster procurement cycles and clearer compliance artifacts.
Tax and fee mechanics also create near-term opportunity areas for rental firms that can operationalize compliant recovery-fee billing and multi-state tax administration at scale. Policy activity referenced by ARA and state-level actions, including Utah SB 164 taking effect on January 1, 2026 to enable a 1.5% recovery fee on heavy equipment rentals to reimburse paid property taxes, underscores how pricing structures and invoice line-item governance are becoming differentiators for profitability and transparency. With existing taxes such as Oregon's 2% heavy equipment rental tax and Michigan's 2% qualified heavy equipment rental personal property specific tax already in place, investment in billing systems, tax engines, and customer-facing disclosure workflows becomes a practical lever to reduce friction and protect margin as rules vary across jurisdictions.
Recent Industry Developments in Machinery Rental And Leasing Market
- May 2026: Sunbelt Rentals completes the $650 million acquisition of Reliant Asset Management, adding 17 locations. The acquisition expands Sunbelt Rentals' modular space capabilities, broadening its portable building and space-as-a-service footprint to support data center and industrial deployment projects. This strengthens capacity for project-based demand and enhances cross-sell opportunities in North American markets.
- May 2026: Sunbelt Rentals completed the $650 million acquisition of Reliant Asset Management, a modular space solutions provider, adding 17 locations. The deal gives Sunbelt Rentals a foothold in modular space solutions, enabling faster mobilization of on-site offices and storage for construction, data center, and energy projects. The expansion diversifies the rental portfolio and improves competitive positioning in high-demand sectors.
- January 2026: United Rentals, Inc. authorizes a new $5 billion share repurchase program. The program signals a disciplined capital allocation approach and confidence in ongoing cash-flow stability. It supports a stronger shareholder value framework and reinforces pricing power prospects.
Machinery Rental And Leasing Market Report Scope and Research Methodology
Market Definition and Coverage
This market is measured as the revenue generated from renting or leasing machinery and equipment to business customers, where access is provided for a defined period and billed through rental, lease, or related service charges.
Scope exclusions: We exclude outright equipment sales and pure financing products that do not involve an operator-controlled rental fleet or equipment handover for use.
Segments Covered in This Report
- By Service Type
- Rental
- Leasing
- By Equipment Type
- Construction Equipment
- Industrial Equipment
- Agricultural Equipment
- Material Handling Equipment
- By Customer Type
- Small and Medium Enterprises (SMEs)
- Large Corporations
- Government Agencies
- Individual Users
- By Mode of Rental
- Online
- Offline
- By Geography
- North America
- United States
- Canada
- Rest of North America
- South America
- Brazil
- Argentina
- Rest of South America
- Europe
- Germany
- United Kingdom
- France
- Italy
- Spain
- Russia
- Rest of Europe
- Asia Pacific
- China
- India
- Japan
- South Korea
- Rest of Asia Pacific
- Middle East and Africa
- United Arab Emirates
- Saudi Arabia
- South Africa
- Turkey
- Rest of Middle East and Africa
- North America
Data Sources, Market Sizing, and Validation
Desk Research
Desk research started by mapping the demand pool that typically drives rentals, then linking it to measurable public indicators. Sources such as the US Census Bureau and Bureau of Economic Analysis were used to understand rental activity and construction and industrial output signals, including how spending shifts across cycles.
We also reviewed non-paywalled references such as the Bureau of Labor Statistics for employment and wage movement in construction and industrial services, and World Bank and OECD datasets for broad investment and production direction by region. Where relevant, trade and shipment proxies were checked using UN Comtrade and customs statistics, and safety and emissions direction was verified from equipment and worksite regulation publications. Company filings, investor presentations, and reputable press coverage were used to confirm rental rate direction and utilization commentary, and paid subscription sources for company financials and shipment-level trade checks were used selectively for cross-checks. This source list is illustrative, and many other references were also used for data collection, validation, and clarification.
Primary Interviews and Surveys
Primary interviews and surveys were completed with rental operators, leasing specialists, fleet managers, and procurement stakeholders on the customer side so gaps from desk findings could be closed. Respondent input was collected across the main operating regions to validate utilization patterns, typical contract lengths, offline versus online booking mix, and how pricing moves with interest rates, construction cycles, and availability of used equipment.
Distribution of primary research fieldwork respondents
| Company type | Respondent position | Region |
|---|---|---|
| Top tier: 34% | CXOs: 15% | APAC: 41% |
| Mid tier: 49% | Functional/Unit leaders: 26% | EMEA: 35% |
| Smaller Players: 17% | Managers: 59% | Americas: 24% |
Market-Sizing & Forecasting
Market sizing was built using a top-down approach once, where the rental and leasing revenue pool is reconstructed by linking equipment-heavy end markets to observable spend and activity indicators, and then applying rental penetration and rate assumptions that were stress-tested in interviews. Results were then checked using selective bottom-up approximations, such as sampled rental rate cards multiplied by estimated fleet utilization days, and spot roll-ups from public financial reporting where coverage was clear.
Key model inputs included construction spending and project starts, industrial production trends, fleet utilization and idle time ranges, average rental rate progression by major equipment classes, and the share of online bookings versus branch-led transactions. In markets where leasing is more common, contract tenor and renewal behavior were also used to avoid overstating one-time placements. When data was patchy for smaller regions, proxy indicators (like construction output plus import intensity for equipment categories) were used first, then adjusted back to interview-validated ranges so we did not overfit a thin dataset.
For forecasting, scenario analysis was used so the model could reflect a base case and realistic upside or downside paths tied to capex cycles, interest-rate direction, and public infrastructure pipelines. The final forecast was aligned to the consensus ranges heard from operators and large customers, then reviewed for internal consistency with utilization and price assumptions.
Data Validation & Update Cycle
Validation was handled through triangulation across three layers, namely demand indicators, supply-side operating signals, and pricing and utilization checks. If a country or region output moved away from what those independent signals suggested, the assumptions were reopened and the variance was explained before totals were finalized.
Anomaly checks were run to catch issues like unrealistic utilization, abrupt price steps, or region totals that did not match known construction and industrial activity direction. Findings were reviewed in multiple analyst passes, and experts were re-contacted when a large mismatch remained after desk reconciliation. Reports are refreshed annually, with interim updates when material events occur that can change pricing, utilization, or the demand outlook. Before delivery, we run a final pass to reflect the latest public releases so clients receive an updated view.
Mordor Intelligence's Machinery Rental and Leasing Market Estimate Compared With Other Published Estimates
Published market numbers for machinery rental and leasing often vary because analysts do not always count the same revenue streams, years, or geography mix, and that changes the size even when the story sounds similar. Differences also show up when one model leans more on fleet value or broad equipment access services, and another focuses on rental and leasing revenue tied to active usage.
Some estimates combine this space with adjacent equipment access categories or apply a narrower country-only definition, which shifts totals up or down depending on what is bundled. In Mordor Intelligence, the sizing is kept to rental and leasing revenues tied to machinery access (not asset value), and the inputs are refreshed around utilization and rate movement checks that were validated with industry respondents.
Benchmark comparison
| Source | Market Size | Gaps in Research Methodology |
|---|---|---|
| Mordor Intelligence | USD 142.73 B (2026) | |
| Industry Publisher A | USD 113.10 B (2025) | Uses a different base year and a longer forecast window, and the scope description is broad enough that regional revenue mapping can be applied unevenly across equipment groups, which can pull down the near-term total. |
| Industry Data Provider B | USD 109.10 B (2025) | Represents a US industry revenue view rather than a global market build, so it excludes non-US demand and also follows an industry classification approach that can omit some rental revenue recorded under diversified service firms. |
The spread mainly comes from year selection and scope alignment, plus whether the number is global market revenue or a single-country industry revenue figure. By keeping assumptions tied to utilization, rental rate movement, and end-market activity, our estimate stays traceable to practical drivers that can be rechecked and updated.
Key Questions Answered in the Report
What revenue level does North America contribute to the machinery rental and leasing market in 2025
The region generated USD 47.93 billion, equivalent to 35.21% of global value.
Which equipment category is expanding the fastest
Material-handling equipment is forecast to grow at a 5.08% CAGR through 2031
How quickly are online rental platforms growing
Online channels are set to record a 5.01% CAGR and reach USD 23.74 billion by 2031
Why do SMEs favor rental over ownership?
Rental eliminates high upfront capex, mitigates technology obsolescence, and provides next-day equipment access.
What impact do rising interest rates have on fleet operators
Borrowing costs climb to 7%-9% for investment-grade firms, reducing appetite for rapid fleet expansion
Which company leads global revenue rankings
United Rentals tops the league with USD 11.2 billion in rental revenue and more than 1,400 locations.