
Low GWP Refrigerants Market Size and Share
Market Overview
| Study Period | 2021 - 2031 |
|---|---|
| Market Volume (2026) | 220.78 kilotons |
| Market Volume (2031) | 323.35 kilotons |
| Growth Rate (2026 - 2031) | 7.93 % |
| Fastest Growing Market | North America |
| Largest Market | North America |
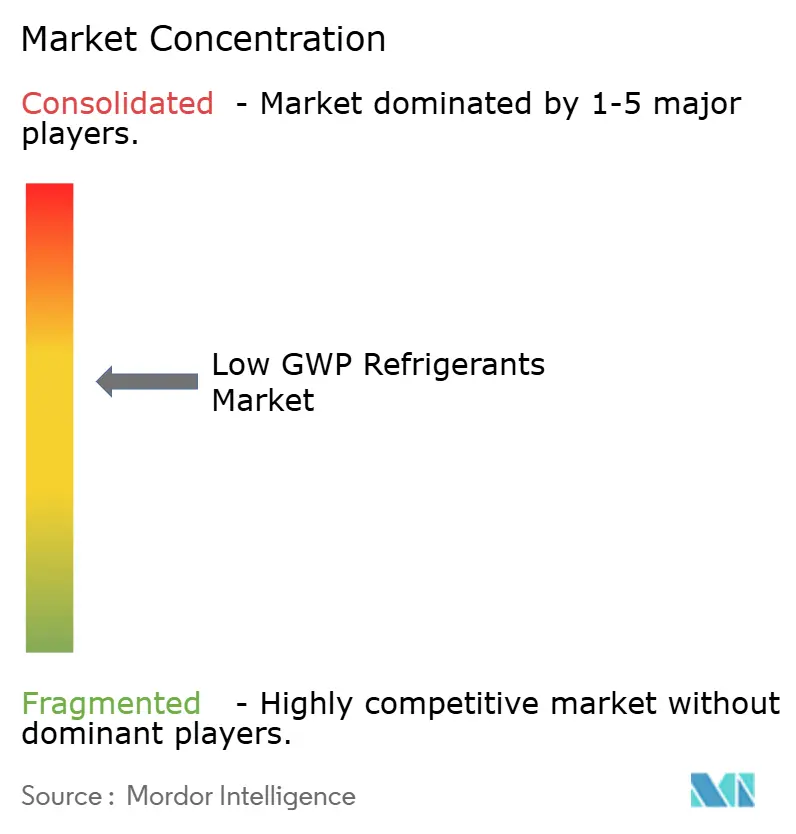
| Market Concentration | Medium |
Major Players *Disclaimer: Major Players sorted in no particular order Image © Mordor Intelligence. Reuse requires attribution under CC BY 4.0. | |
Low GWP Refrigerants Market Analysis by Mordor Intelligence
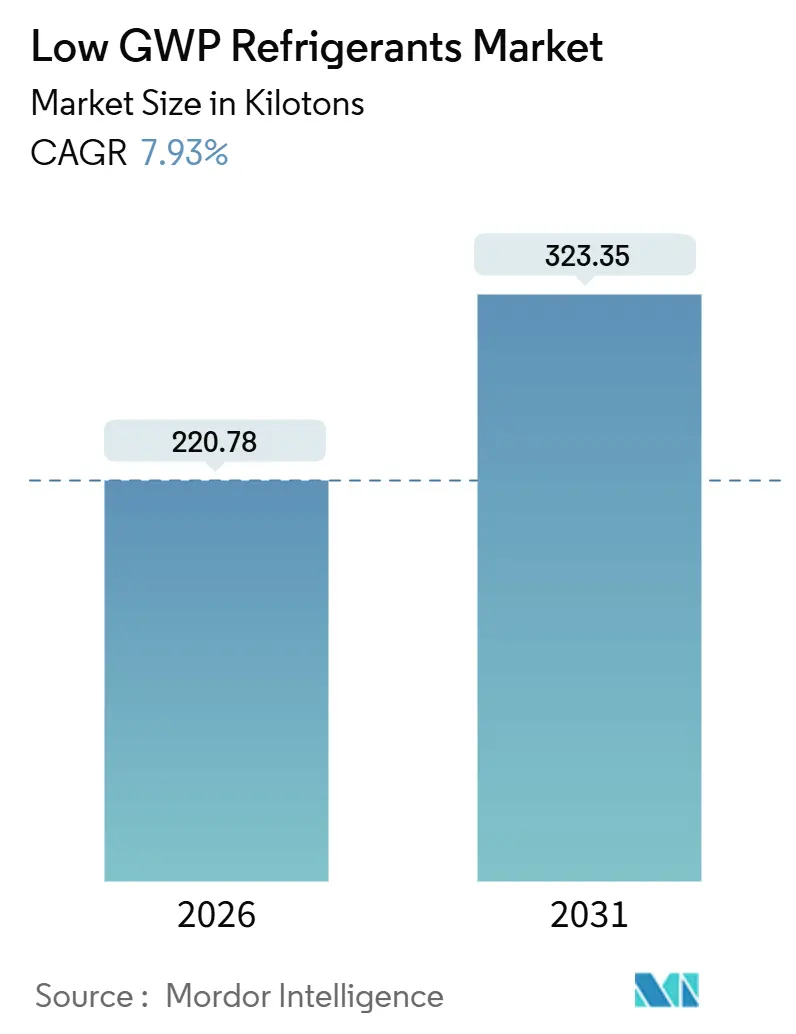
The Low GWP Refrigerants Market size is estimated at 220.78 kilotons in 2026, and is expected to reach 323.35 kilotons by 2031, at a CAGR of 7.93% during the forecast period (2026-2031). Strong regulatory pressure in North America and Europe, combined with tightening Kigali phase-down targets, continues to compress the retirement window for high-GWP HFCs. Supply security has become a key competitive factor as feedstock shortages lift contract prices, while supermarket and data-center operators race to lock in long-term volumes. Technology readiness is improving, helped by safer A2L refrigerants and rising hydrocarbon charge limits that lower retrofit complexity. Early movers are extracting margin by pairing proprietary blends with high-efficiency compressors, closing multi-year contracts with food retailers, and partnering with hyperscalers testing liquid cooling.
Key Report Takeaways
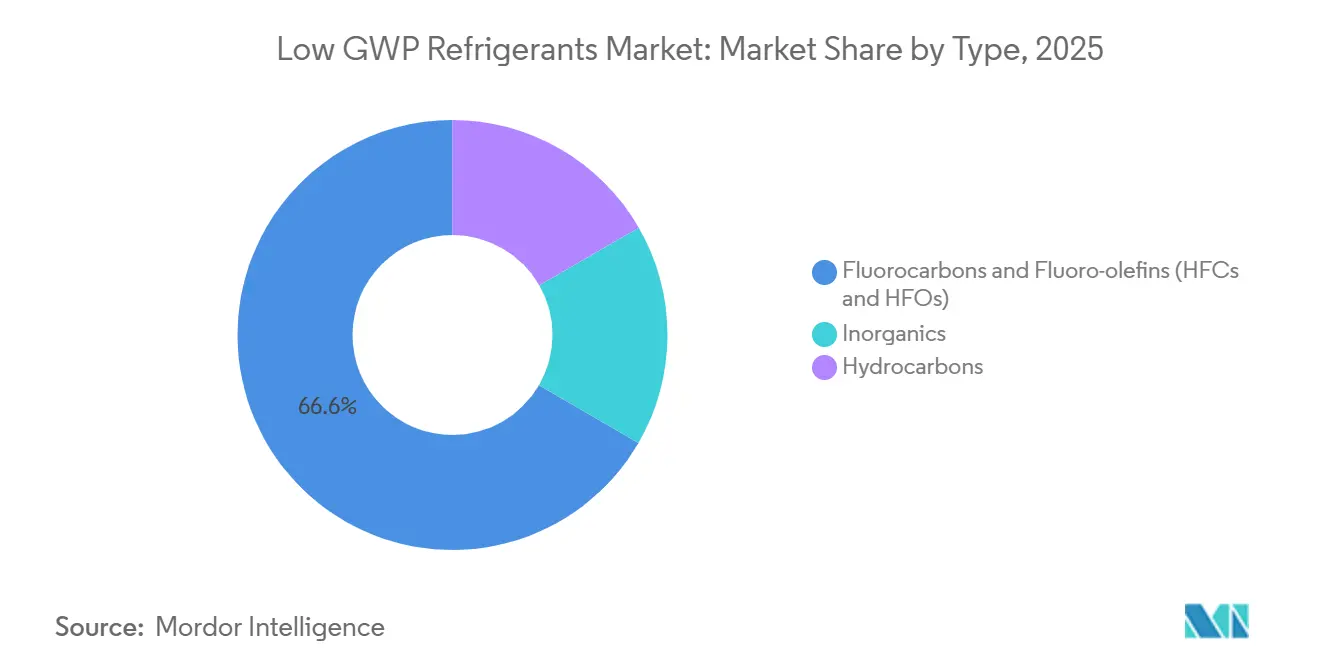
- By type, fluorocarbons and fluoro-olefins held 66.62% of the low-GWP refrigerants market share in 2025, and the segment is anticipated to grow with a 7.98% CAGR through 2031.
- By application, commercial refrigeration posted 45.56% of the low GWP refrigerants market size in 2025 and is expanding at an 8.14% CAGR through 2031.
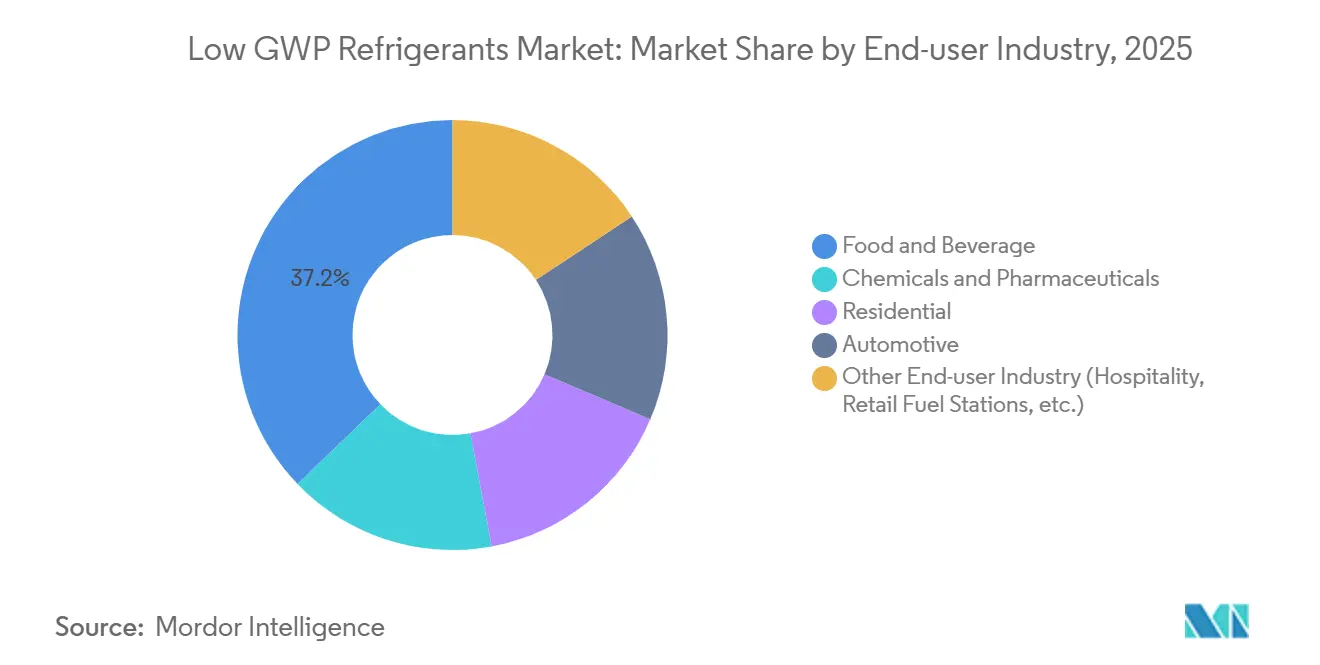
- By end-user industry, food and beverage commanded a 37.19% share of the low GWP refrigerants market size in 2025 while growing at a 7.97% CAGR to 2031.
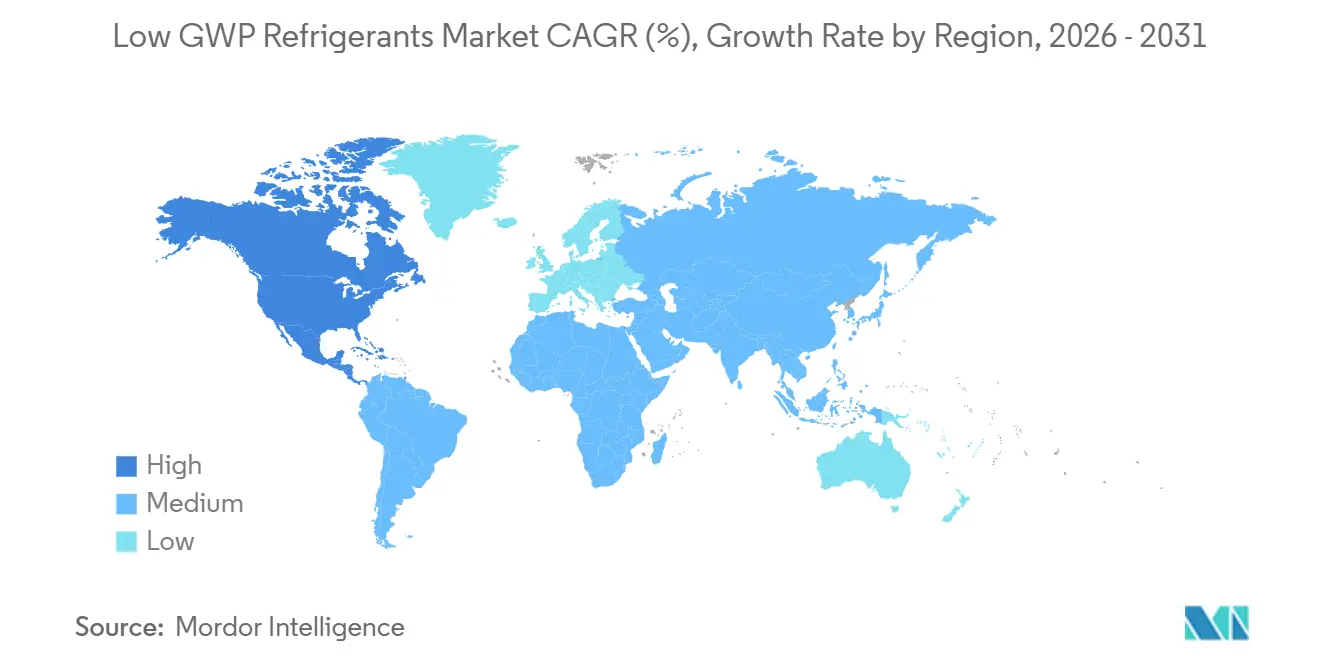
- By geography, North America led with 32.74% of the low GWP refrigerants market share in 2025 and is registering an 8.26% CAGR to 2031.
Note: Market size and forecast figures in this report are generated using Mordor Intelligence’s proprietary estimation framework, updated with the latest available data and insights as of January 2026.
Market Trends and Insights
Drivers Impact Analysis of Low GWP Refrigerants Market*
| Drivers | (~) % Impact on CAGR Forecast | Geographic Relevance | Impact Timeline |
|---|---|---|---|
| Stringent regulations and low environmental impacts | +2.1% | Global, with accelerated enforcement in EU and North America | Short term (≤ 2 years) |
| Growing demand for eco-friendly HVAC systems | +1.8% | North America, Europe, APAC urban centers | Medium term (2-4 years) |
| Increasing demand for energy-efficient cooling | +1.5% | Global, peak adoption in APAC and Middle East | Medium term (2-4 years) |
| Data-center liquid-cooling boom driving demand | +0.9% | North America, Europe, APAC emerging | Medium term (2-4 years) |
| Heat-pump incentive programs boosting hydrocarbon systems | +1.2% | North America and Europe | Short term (≤ 2 years) |
| Source: Mordor Intelligence | |||
Stringent Regulations And Low Environmental Impacts
The European Union trimmed allowable HFC quotas by 40% in 2024, forcing wholesalers to prioritize HFO blends and natural refrigerants in commercial equipment. The U.S. EPA’s AIM Act banned HFC-134a in new chillers starting January 2025, compelling supermarkets to retrofit 12,000 stores by 2028. Developed nations must cut HFC consumption 85% from 2011-2013 baselines by 2036 under the Kigali Amendment, creating supply scarcity that rewards early adopters holding long-term offtake contracts. ASHRAE reclassified R-32 and R-454B as A2L in 2024, enabling their use in residential heat pumps but requiring state-level code updates that only 18 U.S. states had enacted by December 2025.[1] Japan’s Fluorocarbon Emissions Control Law obliges annual leak checks on systems above 1,000 tons CO₂-e, accelerating the shift to low-charge HFO or natural systems in industrial cold storage.
Growing Demand For Eco-Friendly HVAC Systems
Net-zero goals are reshaping procurement; 68% of Fortune 500 companies target carbon neutrality by 2040, a milestone that requires low-GWP refrigerants in owned and leased buildings. Walmart earmarked USD 2.1 billion to upgrade 1,400 U.S. stores to CO₂ systems by 2030, citing a 20% energy cost cut and removal of 2.5 million tCO₂-e annually[2]. ISO 5149 raised hydrocarbon charge limits to 500 g per circuit in 2024, permitting wider use of propane display cases without expensive ventilation retrofits. The U.S. General Services Administration now limits federal HVAC procurements to GWP below 700, favoring HFO-1234ze(E) chillers (gsa.gov). District cooling providers in Abu Dhabi installed 18 MW of low-GWP capacity during 2025, aligning with the emirate’s 2030 carbon-neutral plan.
Increasing Demand For Energy-Efficient Cooling
Variable-speed compressors paired with low-GWP refrigerants cut electricity use by up to 25% versus legacy R-22 systems in Asia-Pacific, easing grid constraints. India’s Bureau of Energy Efficiency enforced a 3.5 ISEER minimum for split ACs from January 2025, a level achievable only with R-32 or HFO blends. China allocated CNY 50 billion to upgrade cold-chain zones with ammonia and CO₂ equipment under its 14th Five-Year Plan. Data-center operators using HFO-1336mzz(Z) rear-door heat exchangers achieved a PUE below 1.15 in 2025 AI clusters.
Data-Center Liquid-Cooling Boom Driving Demand
Microsoft committed USD 1.2 billion to retrofit fifteen data centers with HFO liquid cooling by 2027. Single-phase immersion cooling with HFO-1336mzz(Z) lowers facility energy use by 40% and supports rack densities above 100 kW. Google’s Belgium pilot cut water consumption 25% by pairing HFO liquid circuits with dry coolers. Standardized manifold designs published by the Open Compute Project in March 2025 hasten vendor interoperability. Edge sites in tropical regions now deploy CO₂ chillers that exploit ambient conditions, lowering operating costs by 18% compared with CRAC units.
Restraints Impact Analysis of Low GWP Refrigerants Market*
| Restraints | (~) % Impact on CAGR Forecast | Geographic Relevance | Impact Timeline |
|---|---|---|---|
| Global HFO feedstock shortage and price volatility | −1.4% | Global, acute in APAC | Short term (≤ 2 years) |
| End-user safety concerns over mild flammability | −0.8% | North America, Europe, APAC | Medium term (2-4 years) |
| Limited technician training for CO₂ systems | −0.6% | Emerging markets | Long term (≥ 4 years) |
| Source: Mordor Intelligence | |||
Global HFO Feedstock Shortage And Price Volatility
The combined 45 kiloton HFO-1234yf output of Honeywell, Chemours, and Arkema could not satisfy 2025 demand, driving a 22% price jump in H1 2025. Honeywell’s Geismar plant outage trimmed 40% of North American supply for six weeks, delaying automotive model launches. Chemours’ Corpus Christi expansion will reach full capacity only in mid-2026 due to permitting delays, prolonging tightness. China’s 15% tariff on fluorochemical imports enforced in January 2025 added USD 3.50 per kg to landed costs, hurting local blenders. Smaller producers pivot to HFO-1234ze(E) but need equipment redesign, lengthening commercialization by two years.
End-User Safety Concerns Over Mild Flammability
Only 18 U.S. states adopted building codes for A2L refrigerants by December 2025, fragmenting national distribution. The 2024 IMC caps indoor A2L charges at 1.8 kg, limiting single-unit capacities for large residences. European insurers raised premiums to 12% for hydrocarbon kitchen systems despite ISO-5149 compliance. Japan requires annual inspections for CO₂ systems above 4 MPa, adding USD 1,000 in operating cost per supermarket. A 2024 AHRI survey found 34% of U.S. homeowners remain wary of flammable refrigerants, slowing uptake.
*Our forecasts treat driver/restraint impacts as directional, not additive. The impact forecasts reflect baseline growth, mix effects, and variable interactions.
Low GWP Refrigerants Market Segment Analysis
By Type:
Fluorocarbons Dominate Amid Hydrocarbon GainsFluorocarbons and fluoro-olefins captured 66.62% of the low GWP refrigerants market share in 2025 and are on track for a 7.98% CAGR. Automotive mandates made R-1234yf standard across 52 million vehicles built in 2025. HFO-513A retrofits reduce chiller conversion costs by 30% compared with CO₂ upgrades. Hydrocarbons are rising; European manufacturers shipped 1.8 million propane heat-pump units in 2025 after ISO 5149’s charge-limit revision, broadening residential adoption. Inorganics remain niche; CO₂ racks account for 72% of new Swedish supermarkets, while ammonia prevails in industrial plants where safety protocols and centralized machine rooms mitigate toxicity concerns. Growth prospects hinge on easing HFO feedstock tightness and harmonizing hydrocarbon safety codes, both prerequisites for greater share displacement.
Fluorocarbon suppliers are tailoring blends such as R-455A for rooftop units in hot climates and R-515B for chiller applications that require A1 safety profiles. Hydrocarbon specialists focus on propylene and dimethyl ether prototypes that balance flammability and efficiency. Cross-category innovation is emerging; dual-loop systems pair CO₂ in medium-temperature cases with ammonia or propane in low-temperature circuits, cutting charge volumes and meeting GWP targets without proprietary HFOs.

By Application:
Commercial Refrigeration Leads Retrofit WaveCommercial refrigeration controlled 45.56% of the low GWP refrigerants market size in 2025 and is advancing at an 8.14% CAGR. Supermarket retrofits accelerated after the EPA scheduled a 2026 high-GWP ban for retail food systems, pushing chains to CO₂ racks or HFO-blend condensing units. European discounters favor propane plug-in cases that avoid centralized plant costs and leverage ISO-5149’s raised charge limits. Industrial users are adopting ammonia-CO₂ cascades that cut R-717 charge 80% while preserving sub-zero performance.
Domestic refrigeration is near full transition to isobutane in many regions due to energy-efficiency rules. Transport refrigeration trials CO₂ on cold-climate routes but relies on HFO-blends elsewhere, given ambient sensitivities. Precision cooling for data centers is a small but fast-growing niche; HFO-1336mzz(Z) rear-door exchangers could absorb 15 kilotons yearly by 2028 if hyperscalers standardize liquid designs.
By End-User Industry:
Food And Beverage Drives Compliance SpendFood and beverage accounted for 37.19% of the low GWP refrigerants market size in 2025, expanding at a 7.97% CAGR as cold-chain operators upgrade to meet food-safety and ESG requirements. The U.S. Food Safety Modernization Act pushes distributors toward connected low-GWP systems that enable continuous temperature monitoring. Nestlé is investing CHF 800 million to switch 240 plants to natural refrigerants by 2028, targeting a 40% Scope 1 reduction. Beverage lines now favor ammonia-water absorbers that recycle waste heat, trimming electricity use up to 30%.
Pharmaceutical plants rely on HFO blends in cleanrooms and ultra-cold freezers, with Pfizer standardizing on R-1234ze(E) for mRNA storage. Residential adoption is fueled by heat-pump incentives; propane units appeal in cold regions where performance at −15 °C is critical. Automotive AC remains a major offtake, transitioning almost entirely to R-1234yf. Hospitality and healthcare facilities are shifting to low-GWP chiller plants to meet corporate ESG targets, widening demand diversity.
Geography Analysis
North America Low GWP Refrigerants Market
North America commanded 32.74% of the 2025 volume and is growing at an 8.26% CAGR to 2031. EPA bans and IRA tax credits accelerate supermarket and residential conversions, while Canada’s carbon price and provincial rebates support commercial retrofits. Mexico lags due to weak enforcement, concentrating low-GWP adoption in export-oriented plants.
Europe Low GWP Refrigerants Market
Europe cut HFC quotas by 40% in 2024, lifting spot prices by 18% and fast-tracking HFO and natural adoption. Germany issued EUR 3.5 billion in 2025 heat-pump grants, spurring 1.2 million residential sales with 28% propane share. Nordic nations favor CO₂ racks; Southern Europe leans on HFO-513A in warm climates. The U.K. mirrors EU controls but used transition flexibility to stockpile HFCs, temporarily easing supply constraints.
APAC, South America and MEA Low GWP Refrigerants Market
Asia-Pacific accelerates under HCFC phase-out schedules. China allocated CNY 50 billion to cold-chain upgrades, favoring ammonia and CO₂. India’s 3.5 ISEER rule pushes split AC makers toward R-32 and HFO blends. Japan’s JPY 120 billion heat-pump subsidy targets hospitality and food-service sectors with CO₂ or hydrocarbons. South America and the Middle East-Africa remain early-stage; uptake centers on multinationals able to finance capital-intensive low-GWP systems.
Regulatory Landscape
Regulation remains the main demand driver for low-GWP refrigerants (in-scope as fluids with GWP below 750), with compliance shaped by Kigali Amendment phasedown schedules and faster regional rules. In the European Union, Regulation (EU) 2024/573 (entered into force in 2024) tightened sector-specific placing-on-the-market restrictions and reinforced the trajectory toward a 100% reduction of HFCs by 2050, which continues to push substitution toward HFO blends and natural refrigerants in new refrigeration equipment.
In the United States, the EPA is implementing the AIM Act through subsector GWP limits and deadlines under the Technology Transitions program. In May 2026, the EPA finalized the Technology Transitions Reconsideration Rule, updating certain GWP limits and shifting compliance timelines for select refrigeration subsectors, with an effective date of July 27, 2026. Alongside the application-level rules, AIM Act allowance allocation continues to tighten, with allowed HFC production and consumption reduced to 60% of the historic baseline in 2024 and stepping down to 30% scheduled for 2029, reinforcing quota-driven scarcity and compliance-led portfolio shifts.
Value Chain Analysis
The value chain runs from upstream fluorochemical inputs (including HF/AHF and intermediates used to produce HFOs and HFC/HFO blends) through specialized synthesis and purification at refrigerant producers, then blending and packaging. Distribution follows through gas wholesalers, HVACR OEM channels, and contractor networks. HFO-based blends (for example, R-454B-class products used as replacements in air conditioning and refrigeration) need tighter purity and stability controls than legacy refrigerants, concentrating value in dedicated plants, quality systems, and proprietary formulations. For natural refrigerants, the chain is more equipment-led, since CO2 and ammonia adoption depends on specialized system designs, higher-pressure components, and materials such as stainless steel, backed by safety infrastructure.
Downstream, OEM qualification, component availability, and service readiness influence how quickly conversions move from legacy refrigerants to low-GWP systems. Bottlenecks tend to cluster around high-value components for efficient low-GWP designs, including variable-speed compressors, advanced heat exchangers, and semiconductor-based controls, while installer training and code compliance affect deployment for A2L refrigerants and CO2 booster systems. Pricing and availability also track policy and quota dynamics, reflected in EU price monitoring in Q4 2025, which showed stable pricing for replacement blends (R-448A, R-449A, R-513A, and others) and a decline for R-32 as substitution shifts across applications.
Competitive Landscape
The Low GWP refrigerants market is moderately consolidated, with top producers like Chemours, Honeywell, and Daikin driving innovation in HFO blends to meet GWP regulations. Daikin emphasizes the adoption of R-32 for its operational simplicity, while Honeywell and Arkema strengthen feedstock partnerships to address price volatility. HVAC OEMs, including Lennox and Johnson Controls, are prioritizing refrigerant-specific system optimization, launching low-GWP platforms designed for split systems and data centers. Emerging competitors in CO₂ racks and propane chillers are disrupting the market with modular, natural-refrigerant systems. Epta's acquisition of SET Refrigeración enhances its presence in the supermarket segment, while AI-powered leak detection and energy management platforms are creating new opportunities in the aftermarket sector.
Low GWP Refrigerants Industry Leaders
-
Daikin Industries, Ltd.
-
Honeywell International Inc.
-
The Chemours Company
-
Arkema S.A.
-
Carrier Global Corporation
- *Disclaimer: Major Players sorted in no particular order
Low GWP Refrigerants Market Companies Covered in this Report
- A-Gas
- Arkema S.A.
- Bitzer SE
- Carrier Global Corporation
- Daikin Industries, Ltd.
- Danfoss A/S
- Dongyue Group Ltd.
- Engas Australasia
- GTS S.p.A.
- Harp International Ltd.
- Honeywell International Inc.
- Johnson Controls International plc
- Linde plc
- Mayekawa Mfg. Co., Ltd.
- Messer SE & Co. KGaA
- Orbia (Koura)
- Panasonic Corporation
- Sinochem Holdings
- Tazzetti S.p.A.
- The Chemours Company
- Zhejiang Sanmei Chemical
Market Opportunities and Future Outlook
Near-term opportunity is concentrated in segments where regulations and procurement rules are already steering purchasing toward low-GWP refrigerants, while leaving room for differentiation through safety, efficiency, and lifecycle support. In the United States, federal procurement constraints such as the General Services Administration GWP threshold (below 700) create a defined channel for low-GWP chiller refrigerants, including HFO-1234ze(E), and for compliant equipment platforms. Data-center liquid cooling is also raising demand for specialty low-GWP fluids used in rear-door heat exchangers and immersion systems, supported by hyperscaler activity and ecosystem standardization, including the Open Compute Project publishing standardized manifold designs in March 2025.
A second opportunity area is supply security and regionalization of low-GWP molecules and blends, particularly given reported HFO supply tightness and price volatility. Announced capacity investments and portfolio expansions, such as SRF Ltds planned HFO and AHF capacity project in Odisha, along with producer-distributor arrangements that broaden access to HFO blends, point to a pathway for additional supply to serve constrained markets and reduce reliance on a limited set of global plants. At the same time, May 2026 EPA reconsideration actions that adjusted certain GWP limits and timelines in commercial refrigeration, alongside removing the January 1, 2026 installation deadline for certain pre-2025 residential and light commercial HVAC/heat pump equipment using refrigerants above GWP 700, shift where and when conversions occur. That increases the need to manage installed-base transitions through retrofit-compatible blends, contractor training, and refrigerant lifecycle services (recovery and reclamation), rather than relying only on new-build equipment turnover.
Recent Industry Developments in Low GWP Refrigerants Market
- July 2026: Daikin Comfort Technologies North America launched the NEXIO Max inverter-driven rooftop heat pump for light commercial applications using R-32. The product expands OEM availability of lower-GWP packaged solutions and supports contractors seeking compliant replacements as codes and state adoption of A2L provisions advance.
- May 2026: The US EPA finalized revisions under the AIM Act Technology Transitions program that adjust certain GWP limits and compliance dates across refrigeration subsectors, with the reconsideration rule taking effect July 27, 2026. The update changes the timing and mix of refrigerant demand by extending timelines for selected applications while keeping the overall HFC phasedown framework in place.
- May 2025: Arkema announced a commercial arrangement with Honeywell to expand its Forane-branded lower-GWP refrigerant portfolio, including access to blends such as R-454B and replacement refrigerants used in commercial refrigeration. The move strengthens distribution reach and portfolio breadth for installers and wholesalers navigating accelerated substitution away from high-GWP legacy gases.
Low GWP Refrigerants Market Report Scope and Research Methodology
Market Definition and Coverage
For this study, the low GWP refrigerant market is defined as sales of newly produced refrigerant fluids with a 100-year GWP below 750 that are used in refrigeration, air conditioning, and heat pump applications, tracked at a global level.
Scope exclusions: We exclude reclaimed or recycled refrigerants and any revenues linked to complete HVAC or refrigeration equipment.
Segments Covered in This Report
- By Type
- Inorganics
- Hydrocarbons
- Fluorocarbons and Fluoro-olefins (HFCs and HFOs)
- By Application
- Commercial Refrigeration
- Industrial Refrigeration
- Domestic Refrigeration
- Other Applications
- By End-user Industry
- Food and Beverage
- Chemicals and Pharmaceuticals
- Residential
- Automotive
- Other End-user Industry (Hospitality, Retail Fuel Stations, etc.)
- By Geography
- Asia-Pacific
- China
- India
- Japan
- South Korea
- ASEAN Countries
- Rest of Asia-Pacific
- North America
- United States
- Canada
- Mexico
- Europe
- Germany
- United Kingdom
- France
- Italy
- Spain
- Nordic Countries
- Rest of Europe
- South America
- Brazil
- Argentina
- Rest of South America
- Middle East and Africa
- Saudi Arabia
- South Africa
- Rest of Middle East and Africa
- Asia-Pacific
Data Sources, Market Sizing, and Validation
Desk Research
Desk research was used to set the market boundaries and anchor the model to a few public data series. We relied on regulatory and policy publications that shape refrigerant transition timing, alongside public statistics that reflect cooling demand and equipment stock changes.
Sources we referred to include public materials such as the UNFCCC and the Kigali Amendment documentation for HFC phase-down context, the US EPA SNAP and related program pages for allowed refrigerant use, European Environment Agency releases on fluorinated gases, and the International Energy Agency for cooling demand and equipment trends. We also used customs and trade statistics where available, plus peer-reviewed papers that discuss refrigerant GWPs and application suitability. Company annual reports, investor presentations, and credible trade press were read for capacity additions, product introductions, and pricing commentary, while a paid subscription database for company financials, news, and patent lookups supported faster cross-checks. These desk research sources are illustrative, and many other public documents were reviewed to collect data points, validate assumptions, and clarify open questions.
Primary Interviews and Surveys
Primary work focused on confirming what is truly counted as low GWP in different regions and how fast substitution happens in key end uses. We spoke with refrigerant producers, distributors, equipment ecosystem participants, and large end users across APAC, EMEA, and the Americas, to validate adoption rates, application mix, and a realistic price direction for the forecast window.
Distribution of primary research fieldwork respondents
| Company type | Respondent position | Region |
|---|---|---|
| Top tier: 30% | CXOs: 16% | APAC: 43% |
| Mid tier: 53% | Functional/Unit leaders: 36% | EMEA: 32% |
| Smaller Players: 17% | Managers: 48% | Americas: 25% |
Market-Sizing & Forecasting
The market was modeled using a top-down build that reconstructs demand from cooling equipment activity and policy-driven transition schedules, then converts that activity into refrigerant consumption volumes by application. To keep the totals realistic, we corroborated outputs with selective bottom-up checks, including supplier capacity signals, channel discussions on mix shifts, and sampled volume based on typical charge sizes and service patterns.
Key inputs that shaped the model include the pace of HFC phase-down compliance by region, conversion timing from incumbent refrigerants to lower GWP options, the split between new installations and servicing demand, application-level differences in refrigerant charge size, and the direction of safety and flammability code adoption that affects hydrocarbons and A2L blends. Where detailed bottom-up numbers were not consistently available for smaller countries, we used proxy indicators such as equipment stock growth and regional adoption benchmarks, then reviewed them with experts to reduce the risk of overstatement.
For forecasting, scenario analysis was used, because regulation timing, building code acceptance, and supply availability can shift the adoption curve in non-linear ways. Assumptions were stress tested with primary inputs so the base case stays aligned with what buyers and sellers indicate they can execute in the next few years.
Data Validation & Update Cycle
Outputs were checked through triangulation across independent signals, and variances were investigated before results were finalized. Analysts compared modeled volumes against policy milestones, reported capacity moves, and observed application shifts, then rechecked large regional jumps that did not match the supporting indicators.
Before sign-off, the model goes through multiple review steps, and follow-up calls are triggered when a key assumption changes, such as a major regulatory update or a step change in supply availability. The report is refreshed annually, with interim updates made when material events occur, followed by a final pre-delivery review so clients receive the latest view.
Mordor Intelligence's Low Gwp Refrigerant Market Sizing Compared With Other Published Estimates
Published estimates for low GWP refrigerants often differ because of counting rules and measurement choices, so the same topic can look larger or smaller across studies. The biggest differences usually come from whether the study tracks volume or value, what is considered low GWP, and whether adjacent revenue streams are included.
Some published figures fold in reclaimed gases and sometimes even add equipment-related revenues, which inflates the total addressable number. With Mordor Intelligence, the market is counted as newly produced low GWP refrigerant fluids only, with the cutoff set at below 750 GWP, and the tracking is done in volume terms to avoid price-led swings that can mask adoption progress.
Benchmark comparison
| Source | Market Size | Gaps in Research Methodology |
|---|---|---|
| Mordor Intelligence | USD 220.78 M (2026) | |
| Global Consultancy A | USD 8.70 B (2024) | Uses a value metric and combines low GWP refrigerants with legacy HFC revenues in the same total, and the included product list and price assumptions are not clearly disclosed. |
| Industry Portal B | USD 32.57 B (2024) | Blends refrigerant sales with reclaimed gas activity and related HVAC hardware value, and applies aggressive price uplift without clear checks against application level consumption. |
The spread in the table is largely explained by scope mixing and by value-based totals that move with price rather than adoption. By keeping the scope tied to newly produced low GWP fluids and by validating the adoption curve with application-level consumption logic, the estimate stays traceable to clear inputs that can be reviewed and repeated.
Key Questions Answered in the Report
What volume is the low GWP refrigerants market projected to reach by 2031?
The market is expected to attain 323.35 kilotons by 2031, growing at a 7.93% CAGR.
Which segment currently leads in market share?
Commercial refrigeration leads, holding 45.56% of 2025 volume.
Why are fluorocarbons still dominant despite regulatory pressure?
Automotive mandates for R-1234yf and drop-in HFO blends for chillers maintain high demand while supply shortages slow hydrocarbon substitution.
How do U.S. incentives influence residential heat-pump adoption?
The Inflation Reduction Act’s 25C tax credit drove 2.8 million heat-pump sales in 2025, with propane units gaining share in cold climates.
What is the main obstacle to CO₂ system adoption in emerging markets?
A shortage of trained technicians raises installation risk and delays supermarket conversions.
Which regions show the fastest market growth to 2031?
North America posts the highest regional CAGR at 8.26% due to aggressive EPA bans and tax credits.