
Low-Cost Carrier Market Size and Share
Market Overview
| Study Period | 2019 - 2031 |
|---|---|
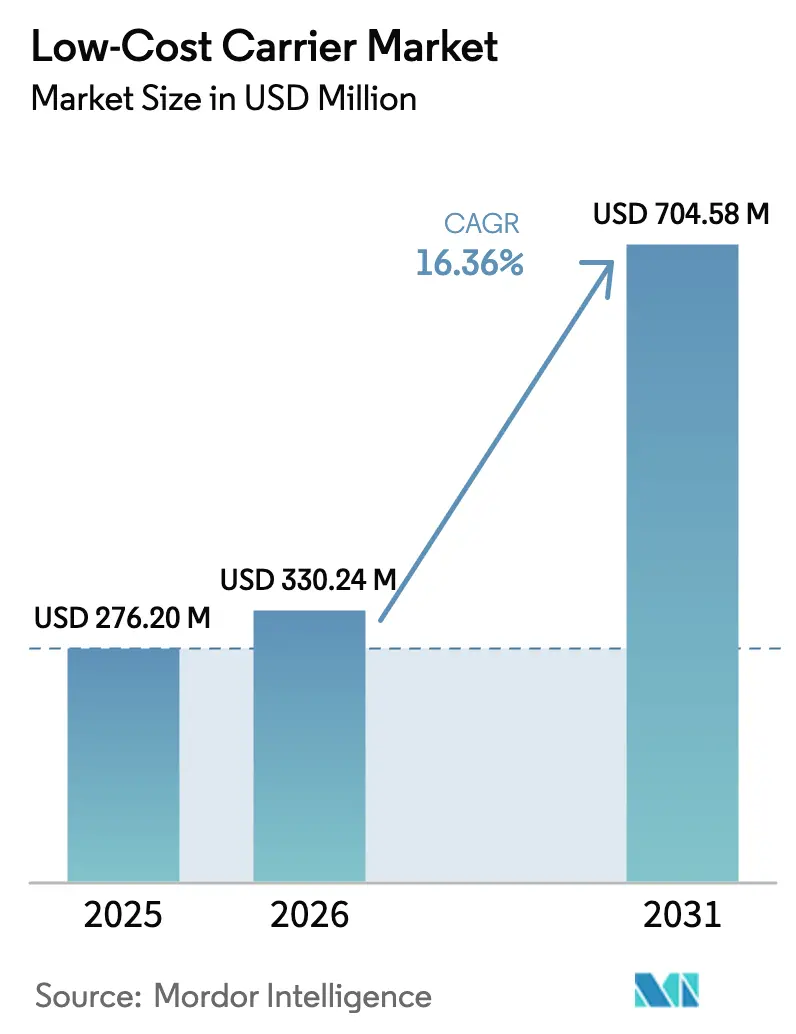
| Market Size (2026) | USD 330.24 Million |
| Market Size (2031) | USD 704.58 Million |
| Growth Rate (2026 - 2031) | 16.36 % |
| Fastest Growing Market | Middle East and Africa |
| Largest Market | Asia Pacific |
| Market Concentration | Low |
Major Players *Disclaimer: Major Players sorted in no particular order Image © Mordor Intelligence. Reuse requires attribution under CC BY 4.0. | |
Low-Cost Carrier Market Analysis by Mordor Intelligence
The low-cost carrier market size is expected to grow from USD 276.20 million in 2025 to USD 330.24 million in 2026 and is forecasted to reach USD 704.58 million by 2031 at a 16.36% CAGR over 2026-2031. Sustained leisure and visiting-friends-and-relatives traffic, the shift to single-type narrowbody fleets, and the maturity of ancillary-revenue ecosystems together explain why growth stems from structural change rather than from simple capacity additions. High aircraft utilization keeps unit costs low, secondary airport access cuts landing fees by 30-50%, and liberalized air service agreements unlock new city pairs that bypass congested hubs. Rapid mobile adoption enables carriers to push real-time offers, which now account for 55-62% of total income, transforming the base fare from a volume driver to the primary profit engine. Finally, market leaders are committing to next-generation aircraft even as supply chain constraints tighten, ensuring that cost advantages endure when environmental compliance fees rise.
Key Report Takeaways
- By aircraft type, narrowbody jets led with 82.01% of the low-cost carrier market share in 2025, while widebody operations are advancing at a 16.87% CAGR through 2031.
- By destination, domestic routes accounted for 57.24% of the low-cost carrier market size in 2025, and international services are set to expand at an 18.01% CAGR through 2031.
- By haul length, short-haul flying held a 73.49% share of the low-cost carrier market size in 2025; long-haul models are projected to grow at a 17.76% CAGR between 2026 and 2031.
- By distribution channel, direct online bookings captured a 93.22% share in 2025 and are projected to rise at a 17.24% CAGR through 2031.
- By region, Asia-Pacific led with a 34.89% revenue share in 2025, while the Middle East and Africa region is forecasted to post the fastest growth at a 17.43% CAGR from 2026 to 2031.
Note: Market size and forecast figures in this report are generated using Mordor Intelligence’s proprietary estimation framework, updated with the latest available data and insights as of January 2026.
Market Trends and Insights
Drivers Impact Analysis of Low-Cost Carrier Market*
| Driver | (~) % Impact on CAGR Forecast | Geographic Relevance | Impact Timeline |
|---|---|---|---|
| Sustained growth in price sensitive leisure and VFR travel demand | +3.2% | Global, South Asia-Middle East, South America-US, Eastern-to-Western Europe | Long term (≥ 4 years) |
| Single-type fleet strategies enabling cost-efficient narrowbody operations | +2.8% | Global, notably Europe and Asia-Pacific | Medium term (2–4 years) |
| Liberalization of air service agreements expanding point-to-point connectivity | +2.5% | Asia-Pacific, Middle East and Africa, South America | Medium term (2–4 years) |
| High aircraft utilization and quick turnaround operating models | +2.1% | Global | Short term (≤ 2 years) |
| Scalable ancillary revenue ecosystems improving per-seat profitability | +3.0% | Global, led by North and South America | Medium term (2–4 years) |
| Access to low-cost secondary airports supporting ultra-low operating expenses | +1.8% | Europe, Asia-Pacific | Short term (≤ 2 years) |
| Source: Mordor Intelligence | |||
Sustained Growth in Price-Sensitive Leisure and VFR Travel Demand
Visiting friends and relatives account for 20-30% of international passengers and exhibit higher price elasticity than business travel, steering volumes toward fares that undercut legacy carriers by 30-50%.[1] India’s middle-class expansion has driven demand for one-way flights under USD 50, pushing IndiGo past 2,000 daily flights by the third quarter of FY2025. High-frequency immigrant corridors, such as the South Asia-Gulf, South America-US, and Eastern-Western Europe, buffer load factors during downturns because the trips are quasi-essential.[2] Dynamic pricing now splits long weekends across multiple fare buckets, boosting yield without undermining occupancy. The rise of independent travel shifts bookings to direct channels where carriers capture every ancillary dollar. Mobile penetration exceeds 70% at leading low-cost carriers, enabling push offers that monetize seats, bags, meals, and insurance just moments before departure.
Single-Type Fleet Strategies Enabling Cost-Efficient Narrowbody Operations
Operating a single aircraft family simplifies training, parts inventory, and crew-rostering complexity, yielding durable cost advantages. Ryanair’s all-B737 model and Southwest’s B737 focus allow shared pilot pools and minimal standby staff. The A320neo family burns 15-20% less fuel than earlier variants, reducing direct operating expenses by 30-40%. IndiGo secured 500 A320neo-family deliveries in 2023, insulating itself from lease-rate increases as OEM backlogs extend beyond seven years. Uniform cabins reduce ground time; easyJet’s standardized galleys and single-class seats enable sub-30-minute turns, supporting 11-13 hours of daily utilization.
Liberalization of Air-Service Agreements Expanding Point-to-Point Connectivity
Open Skies accords now cover more than 100 US partnerships, removing capacity caps that once shielded flag carriers. The EU–ASEAN Comprehensive Air Transport Agreement, signed in 2022, is eliminating bilateral quotas, allowing low-cost carriers to introduce new non-stop services between Europe and Southeast Asia. Saudi Arabia’s Vision 2030 aims to attract 330 million passengers by 2030 through the licensing of new carriers and the upgrading of secondary airports. China’s Civil Aviation Administration (CAAC) revised traffic-rights rules in 2025 to prioritize secondary international links, opening routes previously reserved for incumbents. Such policies reduce start-up capital and lead times, thereby accelerating network growth for airlines that have spare aircraft and crews.
High Aircraft Utilization and Quick-Turnaround Operating Models
Low-cost operators routinely schedule more than 11 hours of block time daily by minimizing ground dwell and adding overnight red-eye sectors that legacy carriers decline due to crew rest constraints. Ryanair’s 25-minute standard relies on single-class seating, prepaid ground handling, and smaller airports with less congestion. Southwest’s point-to-point network avoids complex bag transfers that delay hub-and-spoke rivals. New tech narrowbodies achieve dispatch reliability of better than 99%, enabling operators to publish tighter rotations without requiring backup aircraft. More cycles per day dilute fixed ownership costs, preserve fare advantages, and protect margins when fuel prices spike.
Restraints Impact Analysis of Low-Cost Carrier Market*
| Restraint | (~) % Impact on CAGR Forecast | Geographic Relevance | Impact Timeline |
|---|---|---|---|
| Structural aircraft and engine supply chain constraints limiting fleet growth | -2.4% | Global | Short term (≤ 2 years) |
| Rising environmental compliance costs on short-haul aviation | -1.9% | Europe, North America | Medium term (2–4 years) |
| Jet fuel price volatility impacting operating margins | -1.5% | Global | Short term (≤ 2 years) |
| Global pilot and maintenance workforce shortages increasing unit costs | -1.3% | North America, Europe, Asia-Pacific | Medium term (2–4 years) |
| Source: Mordor Intelligence | |||
Structural Aircraft and Engine Supply Chain Constraints Limiting Fleet Growth
Airbus planned to deliver up to 800 jets in 2025, yet faced CFM LEAP engine shortages and fuselage quality snags that slowed handovers. Boeing’s B737 MAX line also lagged targets after manufacturing audits, forcing many low-cost carriers to extend leases on older aircraft. Lease rates for A321neo and B737 MAX variants rose more than 15% in 2024–2025, compressing returns when fuel savings fail to offset higher capital costs. With order backlogs stretching back more than 7 years, carriers cannot scale their fleets fast enough to capture demand spikes, thereby throttling market growth.
Rising Environmental Compliance Costs on Short-Haul Aviation
The EU Emissions Trading System will eliminate free allowances for aviation by 2026, requiring airlines to purchase permits priced above EUR 80 (USD 94.22) per ton of CO2. CORSIA similarly mandates offsets for emissions growth above 2019 baselines across 129 states. Sustainable aviation fuel (SAF) costs remain three to five times those of kerosene, and blending mandates in Europe and California force carriers to either absorb the cost or raise fares, threatening price-sensitive traffic. Low-cost carriers often lack the balance-sheet strength to invest directly in SAF production, exposing them to higher compliance costs compared to their diversified legacy peers.
*Our forecasts treat driver/restraint impacts as directional, not additive. The impact forecasts reflect baseline growth, mix effects, and variable interactions.
Low-Cost Carrier Market Segment Analysis
By Aircraft Type:
Narrowbody Dominance With Selective Widebody UpsideNarrowbody jets generated 82.01% of capacity in 2025, underscoring their status as the economic backbone of the low-cost carrier market.[3] They remain crucial because runways, gate sizes, and passenger volumes across secondary airports are tailored to single-aisle operations. The low-cost carrier market size attributable to narrowbodies is projected to keep rising at double-digit rates, fueled by A320neo and B737 MAX deliveries that cut per-trip fuel burn. Order backlogs protect fleet expansion plans through 2031 even under supply chain stress.
Widebody operations, though still niche, are expanding at a robust 16.87% CAGR as the 4,700-nautical-mile A321XLR unlocks long-thin routes such as Rome to Boston and Kuala Lumpur to Tokyo. Airlines like Norse Atlantic and AirAsia X demonstrate that dense, no-frills cabins can deliver sub-USD 200 transoceanic fares when load factors exceed 85%. Success hinges on high aircraft days of use and seat density; Norse’s 338-seat B787 layout spreads ownership costs across more travelers. As utilization improves, the widebody slice of the low-cost carrier market could double by 2031, although slot scarcity at major long-haul airports remains a limiting factor.

By Destination:
Domestic Breadth Plus Liberalized International UpsideDomestic services retained a 57.24% share of the low-cost carrier market in 2025 because of regulatory simplicity, quick turnaround times, and the absence of immigration procedures, which make trips under three hours profitable. In the US, Southwest, Frontier, and Allegiant collectively schedule thousands of daily legs, while IndiGo operates more than 2,000 domestic flights across 80 Indian cities. Domestic dominance will persist, but its CAGR lags as saturation sets in mature corridors.
International point-to-point flights are growing at an 18.01% CAGR because bilateral reforms have slashed entry barriers. The low-cost carrier market size for international routes is rising fastest along corridors such as South Asia–Middle East and Europe–Southeast Asia, following the EU–ASEAN pact.[4] Air Arabia, flydubai, and Wizz Air are adding secondary city pairs that network carriers have long overlooked. Liberal policies, combined with the A321XLR's range, will expand this slice of the low-cost carrier market, although visas and currency volatility remain planning challenges.
By Haul Length:
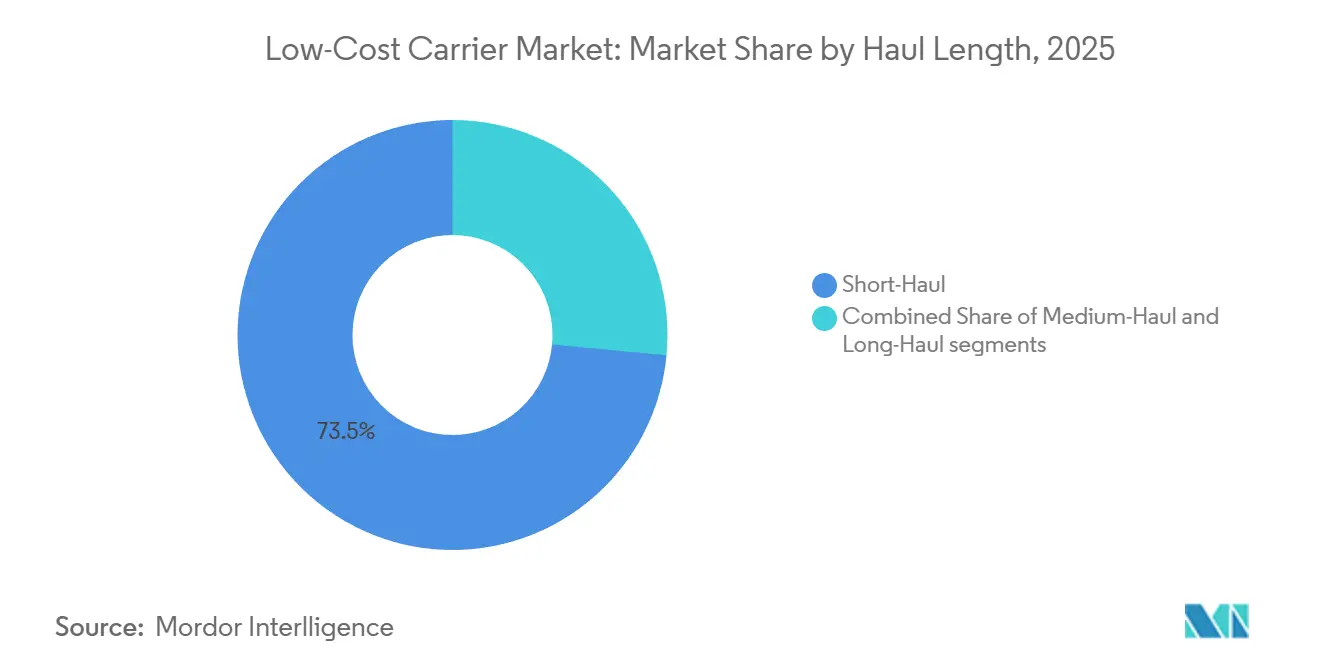
Short-Haul Core with Ramping Long-Haul PotentialFlights under three hours accounted for 73.49% of the low-cost carrier market size in 2025, as short sectors enable 25-minute turns and 11 hours of daily utilization. These economics underpin Ryanair’s 183 million passengers in 2023 and keep average base fares below USD 35 on many intra-European routes. Margins remain intact when ancillaries account for more than half of revenue, demonstrating the resilience of the short-haul model.
Long-haul segments exceeding six hours are advancing at a 17.76% CAGR as the A321XLR and low-density long-range narrowbodies close cost gaps. Norse Atlantic’s B787 network demonstrates that dense cabins and secondary US airports, such as Stewart, can yield sustainable unit costs, even if daily cycles decline. The low-cost carrier market share in long-haul is still small, yet it could double this decade as leisure travelers accept tight seating in exchange for fares 35% below those of legacy airlines. Medium-haul (three- to six-hour) services bridge the models, offering flexible aircraft scheduling without overnight crew layovers.

By Distribution Channel:
Digital Direct Control Over YieldOnline direct platforms captured a 93.22% share in 2025 due to their mobile-first design, AI-powered fare engines, and real-time ancillary offers, which lower acquisition costs while increasing conversion rates. The low-cost carrier market thrives on this control because every non-ticket product, from seat selection to travel insurance, stays entirely inside the airline’s ecosystem. Travel agency volumes shrink as GDS fees raise total trip costs and dilute revenue shares.
Mobile apps now handle more than 70% of direct bookings at Ryanair and Southwest, letting airlines push upgrades, bags, and lounge passes with personalized messaging. NDC promises cheaper API links for agencies, yet most low-cost carriers resist partial control. Online direct sales will likely exceed 95% by 2031, giving carriers complete visibility into search and purchase data, a critical asset for dynamic pricing and loyalty targeting within the low-cost carrier industry.
Geography Analysis
APAC Low-Cost Carrier Market
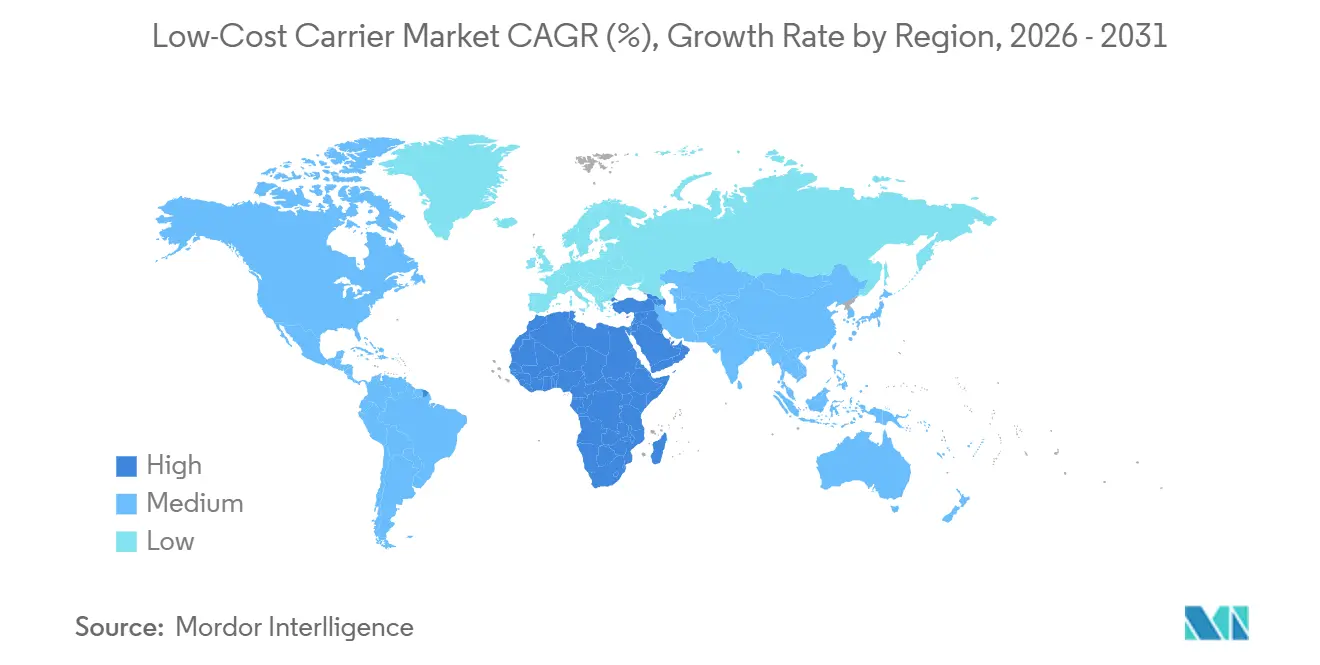
Asia-Pacific held 34.89% of the low-cost carrier market in 2025, anchored by India’s double-digit domestic growth and Southeast Asia’s open-skies reforms. However, engine shortages limit aircraft additions, creating pent-up demand that supports fare strength. China’s Spring Airlines, Cebu Pacific, and VietJet continue to expand their regional routes, which bypass hubs such as Bangkok and Kuala Lumpur.
EMEA Low-Cost Carrier Market
The Middle East and Africa region is the fastest growing, with a 17.43% CAGR to 2031, as Vision 2030 deregulation spurs new entrants and secondary airport upgrades in Saudi Arabia. flydubai’s 150-plane B737 MAX order underscores ambition to link underserved city pairs across Africa and South Asia. In Europe, mature penetration slows growth, but not competition; Ryanair, easyJet, and Wizz Air, together, control more than 40% of intra-European ASKs, yet still chase niche, secondary city pairs.
The Americas Low-Cost Carrier Market
North America witnessed Spirit Airlines’ November 2024 Chapter 11 filing, following its blocked merger with JetBlue, which opened up valuable slots for rivals and signaled a regulatory determination to preserve fare competition. South America remains fragmented as carriers navigate currency fluctuations and fuel cost spikes, although Volaris and Viva Aerobus continue to expand cross-border into the US. Overall, geographic divergence influences the risk-reward profiles within the global low-cost carrier market.
Regulatory Landscape
Policy and consumer-protection rules are tightening around the core LCC practice of unbundling, particularly in Europe. On June 15, 2026, the European Council and European Parliament agreed on updated passenger-rights measures that preserve EU261 delay-compensation triggers while also requiring clearer price disclosure and a free under-seat cabin item (40 cm x 30 cm x 15 cm), directly affecting fee-based baggage revenue design and front-end fare presentation.
Environmental and fuel-mandate regulation is also becoming more operationally prescriptive. ReFuelEU Aviation started with a 2% SAF requirement in 2025 and scales over time, with enforcement activity beginning in 2025 for certain non-compliance provisions. The EU Flight Emissions Label regulation adopted in 2024 introduces airline environmental performance labeling, with full implementation targeted for January 1, 2028. In parallel, EASA and ICAO CAEP workstreams are tightening aircraft CO2 and noise standards, with a 2028 deadline referenced for production aircraft to meet more stringent CO2 certification requirements, reinforcing fleet-renewal pressure amid supply constraints.
Value Chain Analysis
The low-cost carrier value chain is anchored in aircraft and engine OEMs and lessors (Airbus, Boeing, and CFM), followed by airline operations that maximize utilization through standardized narrowbody fleets, high dispatch reliability, and fast turnarounds at lower-cost secondary airports. Airports and ground handling providers, navigation service providers, and slot or airspace management shape unit costs and schedule integrity, and disruptions at any node translate quickly into higher per-seat costs because LCC economics rely on dense schedules and limited slack.
Commercial distribution and ancillary monetization form a second profit pool, with direct digital channels central to merchandising, payments, and dynamic bundling. Compliance workflows are also adding upstream and midstream data-reporting and fuel-sourcing steps, since airlines must document fuel burn and SAF procurement to Competent Authorities through mechanisms such as the EASA Sustainability Portal. ReFuelEU-style mandates and book-and-claim constructs further require fuel-supply coordination and verification, while consumer-protection rules on fee transparency and included cabin items are pushing carriers to redesign fare families and on-site offer sequencing. This shifts value capture toward higher-margin add-ons that remain permissible (priority services, seats, and partner products) and away from fees most exposed to regulation.
Competitive Landscape
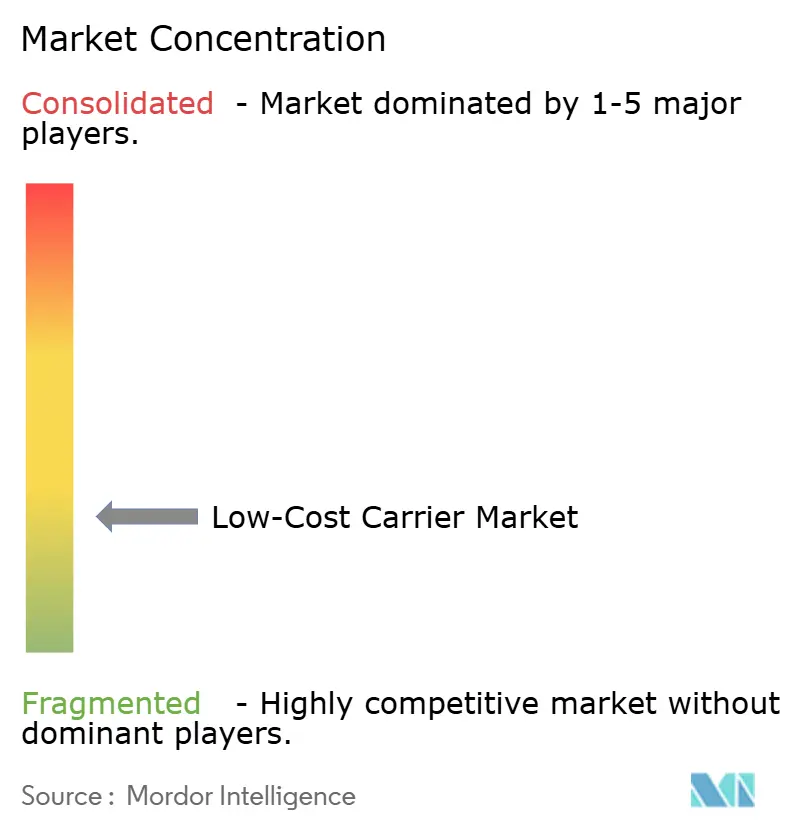
The low-cost carrier market remains fragmented due to regulatory barriers that confine most carriers to their home regions. Ryanair leads Europe with 183 million passengers in 2023, while Southwest tops the US with more than 140 million. IndiGo controls 60% of India's domestic seats; however, none of these airlines hold 10% of the worldwide capacity. The competitive moat stems from cost leadership, ancillary depth, and secondary-airport access. Frontier and Spirit monetize more than half of their revenue through ancillaries, whereas Southwest differentiates itself with free checked bags, despite remaining firmly within the low-cost carrier model.
Technology investment widens performance gaps. Ryanair's mobile penetration exceeds 80%, enabling AI-driven personalization that promotes in-app seat upgrades and car rentals. Wizz Air deploys machine-learning tools to adjust fares up to 200 times per day based on search patterns, competitor prices, and historical curves. Biometric boarding and RFID bag tracking trim turnaround times, preserving aircraft utilization above 11 hours even at slot-restricted airports.
Strategic fleet planning also diverges. IndiGo's September 2024 purchase of 30 A350-900 jets signals a long-haul challenge to state carriers on India–Europe and India–North America routes. flydubai's B737 MAX order aims to enhance connectivity in Central Asia and East Africa, complementing Emirates' widebody network. Norse Atlantic, Zipair, and AirAsia X are pursuing widebody low-cost carrier models on leisure-heavy corridors that legacy alliances deprioritized, exemplifying white-space exploitation in the low-cost carrier industry.
Low-Cost Carrier Industry Leaders
-
Southwest Airlines Co.
-
Ryanair
-
easyJet PLC
-
Indigo (InterGlobe Aviation Limited)
-
Wizz Air Group
- *Disclaimer: Major Players sorted in no particular order
Low-Cost Carrier Market Companies Covered in this Report
- Southwest Airlines Co.
- Ryanair
- AirAsia Group Berhad
- Indigo (InterGlobe Aviation Limited)
- easyJet PLC
- JetBlue Airways Corporation
- Spirit Airlines
- Norse Atlantic ASA
- Wizz Air Group
- Jetstar Airways Pty Ltd
- GOL Linhas Aéreas
- Concesionaria Vuela Compañía de Aviación, S.A.P.I. de C.V. (Volaris)
- Frontier Group Holdings Inc.
- Pegasus Hava Taşımacılığı A.Ş. (Pegasus)
- VietJet Aviation
- Cebu Pacific
- Dubai Aviation Corporation
- flynas Company LCC
- Jazeera Airways K.S.C
- WestJet Airlines Ltd. (Sunwing Vacations Inc.)
Market Opportunities and Future Outlook
Opportunities are concentrating where liberalized access, long-range single-aisle capability, and digital ancillary ecosystems intersect. The EU-ASEAN Comprehensive Air Transport Agreement and similar bilateral reforms provide structural whitespace for point-to-point international services that bypass congested hubs, while aircraft such as the A321XLR broaden the set of thin long routes that can be flown with LCC cost structures. One observable signal is IndiGo signing a May 2025 agreement with Norse Atlantic Airways for damp leasing of two B787 Dreamliner aircraft, expanding widebody operating experience alongside its narrowbody core.
Decarbonization compliance and fuel-market plumbing are also creating investable gaps around SAF sourcing, accounting, and distribution. IATA has cited SAF production reaching about 2.4 million tonnes in 2026 (roughly 0.8% of total fuel needs), which sits below the demand created by mandates such as ReFuelEU Aviation, started at 2% in 2025. That gap raises the importance of book-and-claim mechanisms, procurement platforms, and airline-fuel supplier contracting models. At the same time, tighter consumer-protection rules in Europe on fee disclosure and included cabin items are pushing fare and merchandising redesign, opening space for airlines and travel-technology partners to optimize compliant retailing while protecting ancillary yield through alternative bundles and higher-converting direct channels.
Recent Industry Developments in Low-Cost Carrier Market
- July 2026: IndiGo (InterGlobe Aviation Limited) MoU with CFM International to purchase over 1,000 LEAP-1A engines for 510 Airbus A320neo family aircraft. The engine supply and fleet standardization enhance commonality across the narrowbody fleet, enabling lower maintenance costs and higher availability. The largest LEAP order strengthens IndiGo's long-term cost and maintenance architecture, potentially supporting unit cost reductions as fleet commonality grows.
- June 2026: easyJet plc Launch of London Gatwick - Reus route (three times weekly). The new European leisure route expands easyJet's Southern Europe network and supports utilization and ancillaries revenue growth. The route broadens market reach for leisure travelers and strengthens capital efficiency across the network.
- April 2026: easyJet plc Launch of London Southend - Ibiza route (twice weekly). The addition strengthens the leisure-focused route portfolio and increases seasonal demand capture. It broadens London Southend's network, enabling higher ancillary sales from holiday travelers.
Low-Cost Carrier Market Report Scope and Research Methodology
Market Definition and Coverage
For this report, the low-cost carrier market is measured as the value generated by airlines that operate with a low-fare model and earn revenue through base fares and separately priced add-ons, across domestic and international passenger travel.
Scope exclusions: We exclude pure cargo operators and charter-only airlines that do not sell scheduled passenger seats as part of their core business.
Segments Covered in This Report
- By Aircraft Type
- Narrowbody
- Widebody
- By Destination
- Domestic
- International
- By Haul Length
- Short-Haul
- Medium-Haul
- Long-Haul
- By Distribution Channel
- Online Direct
- Travel Agency
- By Geography
- North America
- United States
- Canada
- Mexico
- Europe
- United Kingdom
- France
- Germany
- Italy
- Spain
- Rest of Europe
- Asia-Pacific
- China
- India
- Japan
- South Korea
- Rest of Asia-Pacific
- South America
- Brazil
- Rest of South America
- Middle East and Africa
- Middle East
- Saudi Arabia
- United Arab Emirates
- Rest of Middle East
- Africa
- South Africa
- Rest of Africa
- Middle East
- North America
Data Sources, Market Sizing, and Validation
Desk Research
Desk work starts with building the demand and capacity picture of commercial aviation, then narrowing it to low-cost carrier operations by geography. We lean on public series that are consistent over time, such as ICAO air transport statistics, IATA traffic and yield indicators, U.S. DOT BTS datasets, Eurostat air transport tables, and Airport Council International traffic releases, which we use to sanity check passenger growth, load factors, and route recovery.
We also review airline annual reports, investor presentations, and regulatory filings to understand fare structures, ancillary revenue disclosures, and fleet plans, and we compare these with schedule and airport fee disclosures where available. For cross-checking company-level financials and longer-run developments (such as fleet groundings, airport constraints, and policy changes), our team uses paid subscriptions for company financials and intelligence and for news and financials, while keeping the market model anchored to explainable public inputs. The desk sources listed here are illustrative only, and many other public documents and datasets were also reviewed for data collection, validation, and clarification.
Primary Interviews and Surveys
Primary work focused on validating what drives LCC revenue per passenger and how it varies by route length and sales channel, since pricing is not uniform across regions. We spoke with airline commercial teams, airport and route development stakeholders, distribution intermediaries, and aviation consultants across major regions so gaps from desk inputs could be closed and key assumptions triangulated before finalizing the model.
Distribution of primary research fieldwork respondents
| Company type | Respondent position | Region |
|---|---|---|
| Top tier: 31% | CXOs: 18% | APAC: 44% |
| Mid tier: 50% | Functional/Unit leaders: 26% | EMEA: 32% |
| Smaller Players: 19% | Managers: 56% | Americas: 24% |
Market-Sizing & Forecasting
Sizing starts with a top-down demand pool assessment where passenger traffic, capacity (ASKs or seats), and route mix are used to reconstruct the revenue opportunity for the low-cost model by region and year. Once this structure is in place, we corroborate totals using selective bottom-up checks, such as sampling representative LCCs for passenger volumes and then applying observed average revenue per passenger (base fare plus ancillary) to test whether implied totals stay within a realistic band.
Key inputs used in the model include passenger traffic growth, aircraft utilization trends, load factors, short versus medium versus long-haul exposure, online-direct share versus travel agency share, and the progression of ancillary revenue attachment rates. Each of these helps convert traffic and capacity signals into value without requiring unrealistic data granularity, and it also helps handle gaps when a country-level series is missing by anchoring to regional traffic and fleet indicators.
For forecasting, scenario analysis is applied around macro demand recovery, fuel and airport cost pass-through, and capacity delivery timing, and then refined using expert consensus from interviews on fare discipline and ancillary monetization. The output is checked for consistency against aviation traffic indicators and disclosed airline revenue direction so the final curve remains plausible year by year.
Data Validation & Update Cycle
Validation is done in layers, starting with internal checks that compare implied revenue per passenger against observed ranges for similar routes and regions, followed by variance checks versus traffic growth and capacity additions. When anomalies show up, assumptions are re-tested, and we re-contact sources when the gap is linked to a specific driver such as a route mix change, a major airport shift, or a regulatory fee change.
Before sign-off, another analyst reviews the model logic, the link between inputs and outputs, and the consistency of currency conversion across years. The report is refreshed annually, and interim updates are triggered when material events occur, such as large fleet disruptions, sudden demand shocks, or major policy changes affecting air travel. Right before delivery, a final pass is completed so clients receive the latest updated view based on newly available public data and confirmed interview feedback.
Mordor Intelligence's Low Cost Carrier Market Size Measured Against Other Published Estimates
It is normal to see different published market sizes for low-cost carriers, even when the topic sounds the same on the surface. Differences usually come from what revenue lines are counted, which year is treated as the base, how currency conversion is timed, and how aggressively pricing and passenger recovery are projected.
A refresh-led difference is common in this market because quarterly traffic moves quickly and fare and ancillary pricing can shift within a season, which changes the annual average. By locking the currency timing to the stated year, re-checking implied revenue per passenger against traffic and capacity signals, and then rolling forward assumptions during annual refreshes, Mordor Intelligence keeps the estimate tied to what airlines can realistically earn from passengers and add-ons in that year.
Benchmark comparison
| Source | Market Size | Gaps in Research Methodology |
|---|---|---|
| Mordor Intelligence | USD 276.20 M (2025) | |
| Global Consultancy A | USD 221.30 B (2024) | Uses a broader revenue boundary that can blend ultra low-cost, low-fare subsidiaries, and basic-economy style offerings, which can inflate totals versus a stricter low-cost model cut. The base year is different and may rely on blended yields without a clear revenue-per-passenger check tied to traffic and capacity. |
| Industry Publisher B | USD 196.10 B (2022) | Anchors on an earlier base year and can carry forward recovery assumptions across cycles without aligning year-by-year currency timing and price normalization. The scope description is less explicit on whether all ancillary categories and route types are treated consistently across regions. |
The spread in the table is mostly explained by boundary choices and timing choices, rather than a single math error. Our approach stays repeatable because each step links back to observable signals like passenger traffic, capacity, and implied revenue per passenger, and then the assumptions are reviewed again when the annual refresh is done.
Key Questions Answered in the Report
How large is the low-cost carrier market in 2026?
The low-cost carrier market size stood at USD 330.24 million in 2026 and is projected to more than double to USD 704.58 million by 2031.
Which aircraft type dominates capacity?
Narrowbody jets, led by A320neo and B737 MAX families, accounted for 82.01% of deployed capacity in 2025.
What is driving long-haul LCC growth?
The A321XLR’s extended range and widebody density models such as the B787 enable profitable transoceanic routes at fares 30–40% below legacy carriers.
Why are ancillary revenues important?
Leading LCCs derive 55–62% of revenue from ancillaries, allowing base fares to stay ultra-low while preserving margins.
What are the biggest restraints facing the sector?
Supply chain delays on new aircraft and tightening environmental levies on short-haul flights currently subtract an estimated 4.3 percentage points from otherwise higher growth momentum.
Which region will grow fastest to 2031?
The Middle East and Africa is forecasted to register a 17.43% CAGR as liberalization and secondary-airport upgrades unlock new demand.