
Low-code Development Platform Market Size and Share
Market Overview
| Study Period | 2020 - 2031 |
|---|---|
| Market Size (2026) | USD 31.59 Billion |
| Market Size (2031) | USD 78.94 Billion |
| Growth Rate (2026 - 2031) | 20.12 % |
| Fastest Growing Market | Asia-Pacific |
| Largest Market | North America |
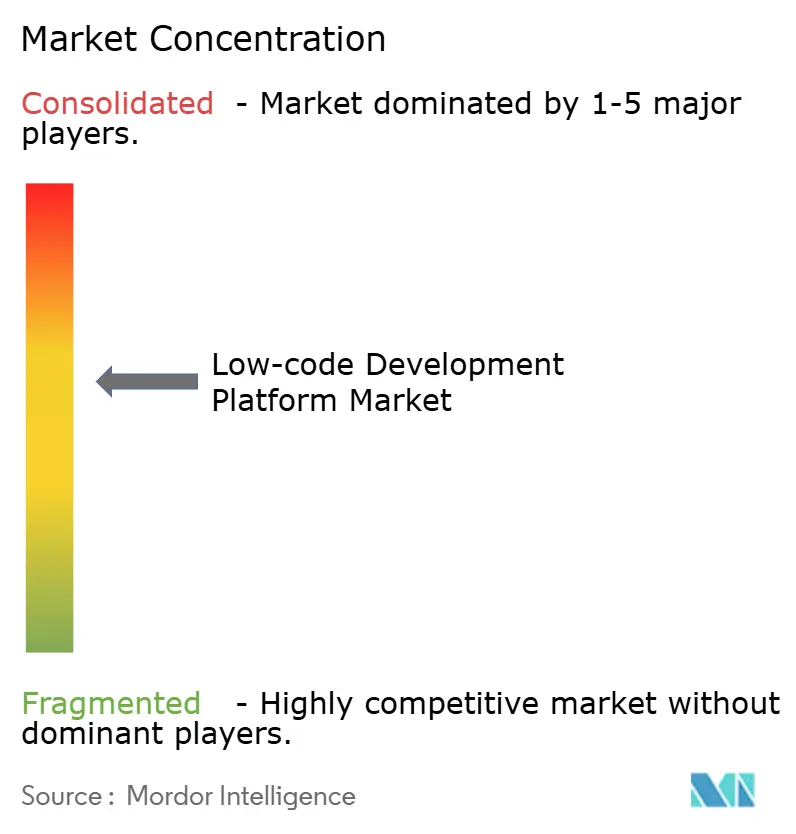
| Market Concentration | Medium |
Major Players *Disclaimer: Major Players sorted in no particular order Image © Mordor Intelligence. Reuse requires attribution under CC BY 4.0. | |
Low-code Development Platform Market Analysis by Mordor Intelligence
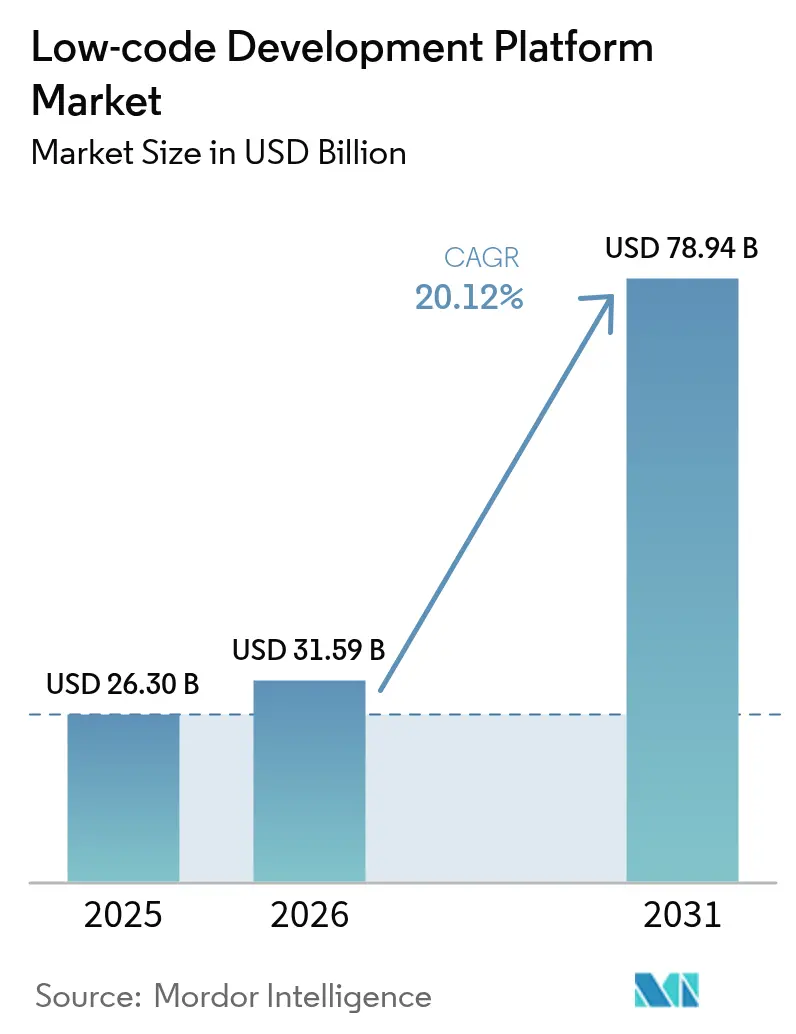
Low-code Development Platform Market size in 2026 is estimated at USD 31.59 billion, growing from 2025 value of USD 26.30 billion with 2031 projections showing USD 78.94 billion, growing at 20.12% CAGR over 2026-2031.
This growth rests on urgent legacy-system modernization, acute developer shortages, and strict regulatory deadlines that reward rapid application delivery. Federal agencies are issuing multi-year blanket purchase agreements for low-code solutions, while EU banks race to meet 2027 composable-banking and data-access rules. Cloud-first architectures, AI-driven development copilots, and expanding sovereign-cloud frameworks are further lifting adoption across industries and regions. Competitive pressure is intensifying as platform vendors layer generative AI and data-fabric capabilities to shorten build cycles, consolidate data, and defend market position.
Key Report Takeaways
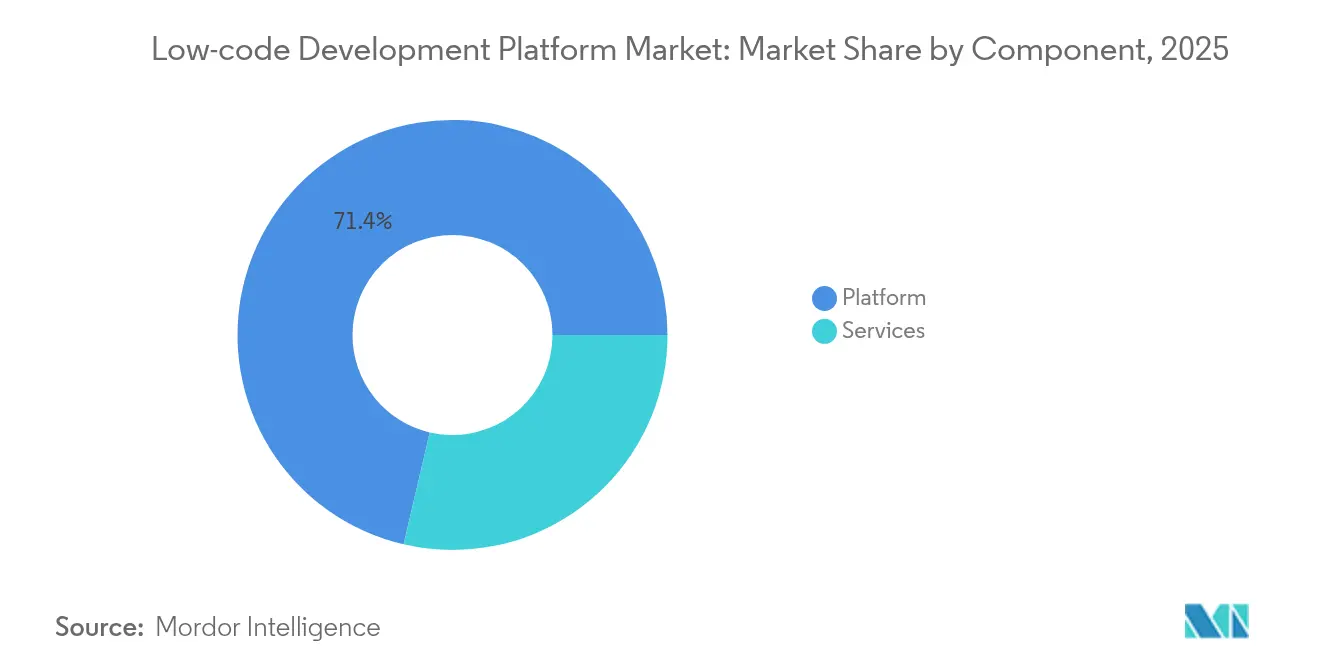
- By component, platform offerings led with 71.35% of the market share in 2025, whereas services are advancing at a 23.45% CAGR through 2031.
- By application type, web-based development commanded 54.40% revenue share in 2025; mobile development is projected to expand at a 22.63% CAGR to 2031.
- By deployment mode, cloud models accounted for 60.25% share of the low-code development platform market size in 2025 and are growing at 22.76% through 2031.
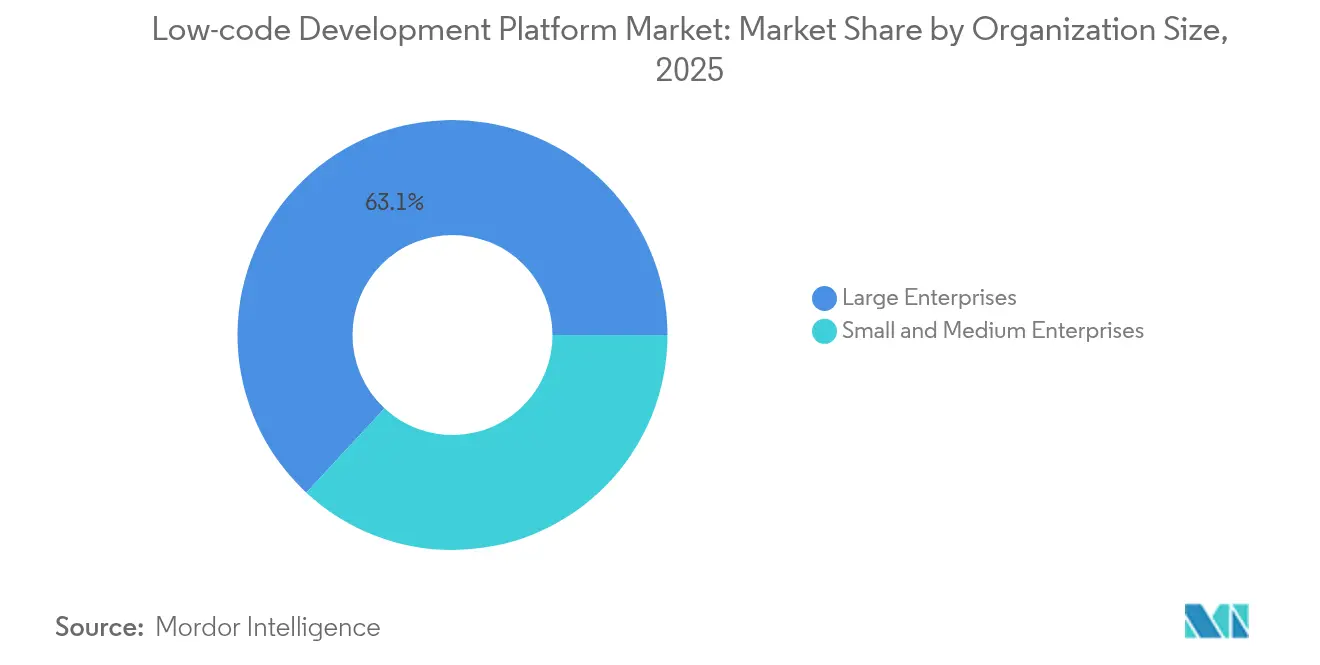
- By organization size, large enterprises held 63.10% share in 2025, but SMEs are set to grow at a 21.85% CAGR.
- By industry vertical, BFSI captured 26.40% of the market size in 2025, while education is rising fastest at 23.71% CAGR.
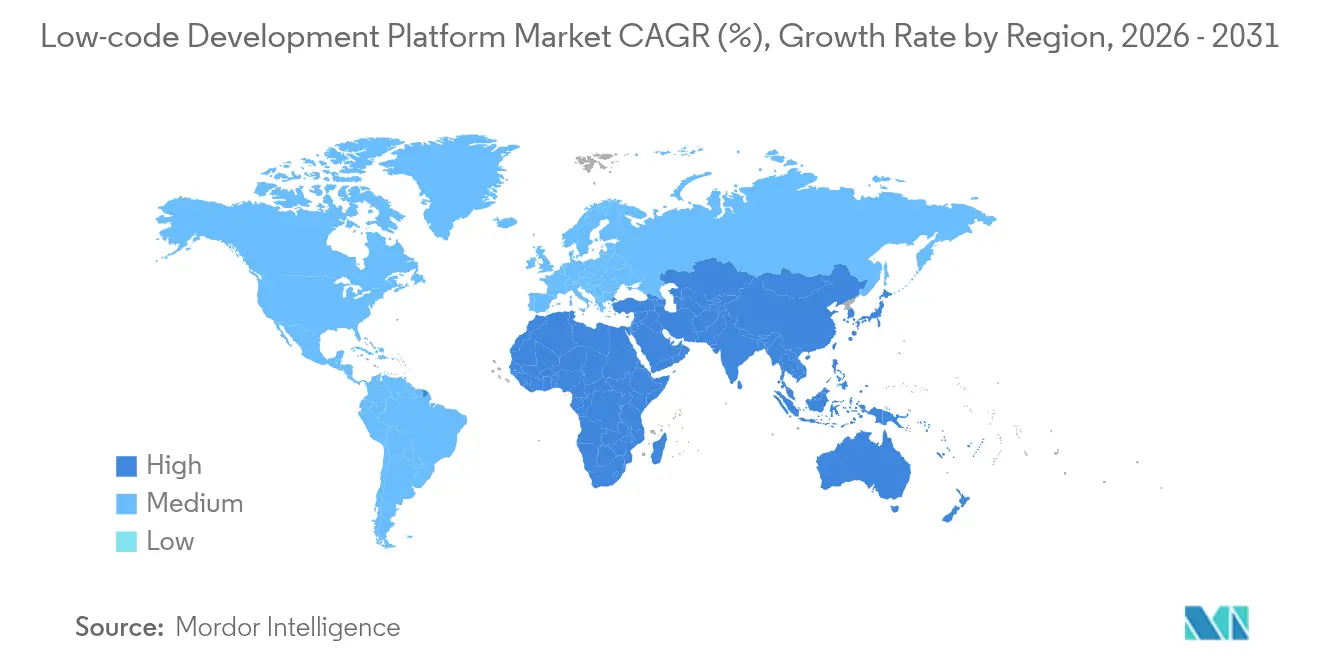
- By geography, North America led with 30.60% share in 2025; Asia-Pacific is the fastest-growing region at 21.13% CAGR
Note: Market size and forecast figures in this report are generated using Mordor Intelligence’s proprietary estimation framework, updated with the latest available data and insights as of 2026.
Market Trends and Insights
Drivers Impact Analysis of Low-code Development Platform Market*
| Driver | (~) % Impact on CAGR Forecast | Geographic Relevance | Impact Timeline |
|---|---|---|---|
| Mandated modernization of legacy COBOL systems in U.S. federal agencies via low-code procurement | + 3.20% | North America, spillover to allied government sectors | Medium term (2-4 years) |
| Real-time composable banking initiatives in the EU accelerating low-code adoption | + 2.80% | Europe, influence extending to APAC finance hubs | Short term (≤2 years) |
| APAC insurers’ regulatory approval of low-code audit trails | + 1.90% | Core Asia-Pacific, adoption spreading to emerging markets | Medium term (2-4 years) |
| GenAI copilots within platforms reducing build-cycle time by 40% | + 4.10% | Global, early uptake in North America and EU | Short term (≤2 years) |
| EU ESG reporting deadlines driving rapid app-deployment demand | + 2.30% | Europe, multinational roll-outs worldwide | Short term (≤2 years) |
| AI-driven data-fabric integration improving cross-platform analytics | +1.50% | Global, strongest in data-intensive sectors | Long term (≥4 years) |
| Source: Mordor Intelligence | |||
Mandated modernization of legacy COBOL systems in U.S. federal agencies via low-code procurement
Federal departments are retiring decades-old COBOL platforms and replacing them with low-code systems through multi-award blanket purchase agreements that lower contract overhead by 23% . The Defense Contract Management Agency highlighted low-code in its 2025 modernization RFI as the preferred path for integrated contract management. States now replicate these federal templates, expanding addressable spend and cementing low-code platforms as the public-sector default for rapid modernization. Vendors able to verify FedRAMP and DoD IL5 compliance gain privileged access to this growing procurement wave, supporting further growth for the low-code development platform market.
Real-time composable banking initiatives in the EU accelerating low-code adoption
The Financial Data Access regulation obliges European banks to expose customer data via APIs by 2027. Complementary Digital Operational Resilience Act rules tighten ICT risk oversight and push institutions toward agile architectures that can adapt to weekly rule updates. Low-code platforms answer both needs by generating compliant APIs and automating control evidence. Supervisors at the European Central Bank have formalized cloud-outsourcing expectations that reward modular service deployment. Traditional banks therefore rely on low-code tooling to match the release velocity of fintech challengers across the low-code development platform market.
APAC insurers’ regulatory approval of low-code audit trails
Asia-Pacific insurance regulators now accept low-code applications that maintain tamper-proof audit trails for IFRS 17 and climate-risk reporting. Regional carriers pursuing cyber-policy expansion and electric-vehicle coverage have adopted visual-builder tools that enable actuarial experts to refine rating logic without code. Gallagher Re recorded a surge in embedded low-code implementations linked to regulatory disclosure timetables. As regulators in Japan and Singapore formalize audit-trail standards, insurers across emerging markets follow suit, propelling the low-code development platform market deeper into risk-intensive domains.
GenAI copilots within platforms reducing build-cycle time by 40%
Generative AI now auto-generates data models, interfaces, and test cases, slashing ERP transformation effort by up to 40% . Appian beta testers reported 75 × more documents processed per hour, while Microsoft is collapsing Dynamics 365 apps into AI agents that write and refactor code continuously. Platform providers that embed GenAI quickly win both professional developers and citizen developers, expanding addressable workloads and reinforcing the high-growth trajectory of the low-code development platform market.
Restraints Impact Analysis of Low-code Development Platform Market*
| Restraint | (~) % Impact on CAGR Forecast | Geographic Relevance | Impact Timeline |
|---|---|---|---|
| Proprietary runtime vendor lock-in elevating migration costs | -2.10% | Global, heavier impact on large enterprises | Long term (≥4 years) |
| Performance limitations for compute-intensive industrial IoT apps | -1.80% | Germany, China, Japan, U.S. industrial belts | Medium term (2-4 years) |
| Data-residency barriers hampering cloud-first deployments in Middle East | -1.30% | Middle East & North Africa, regulated verticals worldwide | Short term (≤2 years) |
| Security concerns over AI-generated code vulnerabilities | -1.00% | Global, acute in critical-infrastructure sectors | Medium term (2-4 years) |
| Source: Mordor Intelligence | |||
Proprietary runtime vendor lock-in elevating migration costs
A 2024 peer-reviewed study introduced a cloud vendor lock-in prediction framework that quantifies switching risk and reveals high cost exposures for applications bound to proprietary runtimes. Many low-code systems compile workflows into closed execution engines that limit portability. CIOs now require source-code export and containerized deployment options, slowing purchase cycles and suppressing a portion of the low-code development platform market.
Performance limitations for compute-intensive industrial IoT apps
Manufacturing firms running sub-millisecond control loops or sophisticated predictive models find that some visual builders cannot sustain throughput without bespoke extensions. Automotive and aerospace plants must therefore keep high-frequency workloads on traditional frameworks, curbing low-code penetration into edge-heavy use cases. Vendors are racing to integrate WebAssembly and GPU offload, but material headwinds remain for the low-code development platform market in real-time industrial scenarios.
*Our forecasts treat driver/restraint impacts as directional, not additive. The impact forecasts reflect baseline growth, mix effects, and variable interactions.
Low-code Development Platform Market Segment Analysis
By Component:
Platform Dominance Drives Service InnovationThe platform segment represented 71.35% revenue in 2025 and anchors the low-code development platform market. Enterprises favor unified environments that combine visual modelling, process orchestration, and integrated databases, thereby reducing tool sprawl. Consolidation plays such as Salesforce’s USD 8 billion acquisition of Informatica fold data management and AI into a single runtime to deepen enterprise lock-in. Service-line expansion follows platform rollout: federal agencies that standardize on one vendor generate continuous demand for integration consulting, governance frameworks, and AI-prompt design.
Services, while smaller, are growing at 23.45% CAGR as organizations look for partners to migrate COBOL workloads, embed ESG analytics, and train GenAI copilots. This advisory wave lifts attach rates for premium support and managed services, adding recurring revenue layers to the industry. Over the forecast, vendors that package training, data-fabric tuning, and AI-model governance alongside licences can double lifetime value and widen the market.

By Application Type:
Mobile Surge Challenges Web DominanceWeb apps still controlled 54.40% spending in 2025, yet mobile workloads are rising at 22.63% CAGR as field technicians and remote employees demand offline-first capabilities. Native plug-ins for camera, biometrics, and augmented reality make mobile experiences richer and more contextual. The low-code development platform market size for mobile use cases is projected to grow rapidly, especially in insurance inspections and utility maintenance.
API-centric designs extend both web and mobile apps, aligning with composable-banking and open-data directives. Microsoft’s planned shift from monolithic Dynamics 365 screens to task-oriented AI agents underlines how interfaces will dissolve into contextual micro-interactions. Vendors that ship responsive design, one-click PWA generation, and secure offline sync will capture incremental market share among organizations pursuing multi-channel parity.
By Deployment Mode:
Cloud Sovereignty Shapes Hybrid StrategiesCloud delivery captured 60.25% of the market size in 2025, buoyed by elastic scaling and reduced infrastructure burden. Yet ECB cloud-outsourcing guidance and emerging data-embassy constructs compel many banks and ministries to adopt hybrid or dedicated-region models. Providers respond by offering single-tenant regions, Bring-Your-Own-Key encryption, and air-gapped installations.
On-premise options thus remain critical for defense, healthcare, and high-security finance. The fastest-growing micro-segment is sovereign SaaS, where vendors deploy managed stacks within a customer’s data center under national jurisdiction. This flexible continuum lets buyers meet local rules without forfeiting DevOps agility, sustaining broad growth for the low-code development platform market.
By Organization Size:
SME Democratization Accelerates AdoptionLarge enterprises held 63.10% spending in 2025 because they run multi-domain modernization programs. The U.S. Coast Guard’s consolidation of four low-code contracts into one BPA illustrates the scale efficiencies large buyers seek. Nevertheless, SMEs record the highest 21.85% CAGR as freemium tiers, template libraries, and AI-driven wizards level the playing field.
Citizen developers inside 200-employee retailers now prototype loyalty apps in days, circumventing vendor backlogs. The low-code development platform industry consequently lowers the threshold for custom software, letting SMEs compete on customer experience without ballooning IT headcount. Over time, rising SME volumes will diversify revenue away from marquee deals, stabilizing the market.
By Industry Vertical:
Education Disrupts BFSI LeadershipBFSI remained the largest buyer with 26.40% of 2025 spend thanks to stringent compliance and real-time data-sharing edicts. European banks channel budgets into API governance layers that low-code platforms generate out-of-the-box, protecting their market position.
Education, however, shows the steepest 23.71% CAGR as universities digitize admissions, remote proctoring, and alumni engagement. Pandemic-era remote learning mandates exposed legacy portals; low-code builders now let faculty curate curricula apps without IT bottlenecks. Government and defense programs add further breadth, particularly where procurement policies specify visual development to accelerate mission delivery. These dynamics diversify demand across the low-code development platform market.
Geography Analysis
North America Low-code Development Platform Market
North America held 30.60% revenue in 2025, driven by federal modernization and a mature venture ecosystem. The U.S. government’s push to sunset COBOL and enforce FedRAMP compliance sets a template for state agencies, seeding repeatable rollouts across justice, transport, and health. Canada leverages low-code to expedite fintech licensing and digital-identity projects, broadening regional momentum. Venture capital continues to back AI-infused low-code startups, fuelling product innovation that sustains the low-code development platform market.
APAC Low-code Development Platform Market
Asia-Pacific posts the fastest 21.13% CAGR. Japan’s insurers adopted audit-ready builders for IFRS 17, while Singapore’s Monetary Authority encourages rapid fintech sandboxing. China finances hyperscale data centers in Gulf states, offering sovereign clouds that host Western-compatible runtimes. India’s IT-services leaders embed low-code accelerators within global transformation deals, amplifying export revenue while catalyzing local public-sector uptake. These initiatives collectively underpin the region’s outsized contribution to future low-code development platform market growth.
Europe Low-code Development Platform Market
Europe wields regulatory influence that shapes global product roadmaps. ECB cloud standards, open-banking API deadlines, and ESG disclosure mandates force enterprises to automate compliance fast. Nordic governments deliver citizen services via low-code Portals, Germany’s auto OEMs prototype shop-floor apps despite performance caveats, and French utilities integrate ESG reporting pipelines. With policy momentum compounding, Europe remains a cornerstone of the expanding low-code development platform market.
Regulatory Landscape
In the United States, low-code platform adoption in regulated environments is increasingly shaped by tighter federal security and AI controls. FedRAMP Notice 0009 (March 2026) established a phased schedule for machine-readable compliance using OSCAL for Rev. 5 authorizations, pushing platform vendors and their cloud partners toward automated evidence collection and continuous assessment rather than manual documentation. The General Services Administration then introduced GSAR clause 552.239-7001 (June 2026), adding security and data integrity requirements for Large Language Model systems used in government, including flow-down obligations that impact low-code platforms embedding GenAI assistants and agent capabilities.
In Europe, Regulation (EU) 2024/1689 (the EU AI Act) entered into force in August 2024, shaping how vendors package AI-enabled low-code features for EU customers through documentation and risk-management obligations, including Annex IV technical documentation expectations. Across markets, widely referenced U.S. frameworks such as NIST SP 800-218 (Secure Software Development Framework) and NIST SP 800-70 Rev. 5 (finalized May 2026) provide common anchors for secure development practices and configuration guidance that enterprises and public agencies use when selecting platforms and assessing software supply-chain assurance.
Competitive Landscape
The market shows moderate consolidation. Salesforce’s USD 8 billion Informatica purchase marries AI-driven data integration with its Lightning platform, reinforcing ecosystem lock-in and expanding cross-sell leverage.[3] Microsoft collapses Dynamics 365 modules into AI agents that auto-compose workflows, repositioning Power Apps as a natural orchestration layer. Appian’s 25.1 release injects a data-fabric spine that multiplies query speed and document throughput. [1]
Private-equity appetite persists: Triton acquired Neptune Software to scale a SAP-centric builder serving 5 million users. [2] Niche vendors that specialize in regulated verticals—defense, life sciences, energy—attract suitors eager to fold compliance IP into broader suites. Competitive intensity centers on three fronts: GenAI breadth, sovereign-cloud options, and vertical accelerators. Players that score high on all fronts widen share, yet the addressable base grows fast enough that challengers still find white-space within the dynamic low-code development platform market.
Low-code Development Platform Industry Leaders
-
Salesforce.com Inc.
-
Microsoft Corporation
-
Appian Corporation
-
Oracle Corporation
-
OutSystems Inc.
- *Disclaimer: Major Players sorted in no particular order
Low-code Development Platform Market Companies Covered in this Report
- Microsoft Corporation
- Salesforce Inc.
- Appian Corporation
- Oracle Corporation
- Mendix (Business of Siemens)
- OutSystems Inc.
- ServiceNow Inc.
- Magic Software Enterprises Ltd.
- Quickbase Inc.
- Zoho Corporation
- Clear Software LLC
- Temenos (formerly Kony Inc.)
- AgilePoint Inc.
- Betty Blocks B.V.
- Creatio Global
- Kissflow Inc.
- Nintex Global Ltd.
- GeneXus International SA
- LANSA Inc.
- Newgen Software Technologies
- WaveMaker Inc.
Market Opportunities and Future Outlook
AI-native building surfaces and governed agent orchestration are creating whitespace for vendors that can bring together no-code, low-code, and pro-code workflows while preserving enterprise controls. Oracle introduced an AI-native builder experience for Fusion Applications (July 2026), and ServiceNow made Build Agent generally available (May 2026) with governance while working inside major AI coding tools, which points to buyer demand for low-code that interlocks with developer copilots rather than competing with them. Appian also expanded AI-assisted, spec-driven development with Model Context Protocol (MCP) integration and a technology partnership with Snowflake (April 2026), reinforcing an opportunity for platforms that connect application assembly with data and AI estates, alongside auditable process automation.
A second opportunity area is verticalized low-code for telecom and other API-led industries moving toward composable architectures. Cerillion announced a BSS/OSS transformation with Omantel (April 2026) using a low-code/no-code platform integrated with agentic AI and TM Forum Open APIs, and Comviva launched NGAGE for Enterprises (March 2026) with a low-code workflow builder aligned with TM Forum Open APIs and CAMARA standards. Together, these announcements point to active spending on platforms that can rapidly assemble customer and operations workflows on top of standardized APIs, leaving room for vendors and service partners that deliver accelerators, governance templates, and integration assets across cloud and hybrid deployments.
Recent Industry Developments in Low-code Development Platform Market
- July 2026: Oracle introduced an AI-native builder experience for Fusion Applications, enabling teams to create agentic applications using no-code, low-code, and pro-code approaches in one framework. The announcement positions Oracle to capture enterprise demand for governed AI agent development that connects directly to packaged business applications and data.
- June 2026: OutSystems expanded its collaboration with AWS, adding new AI capabilities to deliver agentic systems for the enterprise, including integrations that use Amazon Bedrock for orchestration. The deeper hyperscaler alignment strengthens scalability and security positioning for customers standardizing on AWS while building governed, AI-enabled applications on a low-code backbone.
- December 2024: Salesforce launched AgentForce Testing Center to manage the lifecycle testing of AI agents in production environments. By formalizing testing and control workflows for agents, the release supports enterprise governance requirements that are increasingly central to low-code platforms embedding GenAI features.
Low-code Development Platform Market Report Scope and Research Methodology
Market Definition and Coverage
This market covers revenue earned from low-code development platforms that let users build, test, and deploy applications through visual tooling, reusable components, and limited hand coding, including license and subscription spend tied to the platform.
Scope exclusions: We exclude general IT outsourcing, custom coding labor billed as services, and unrelated enterprise software that does not provide a low-code app-building environment.
Segments Covered in This Report
- By Component
- Platform
- Services
- By Application Type
- Web-Based
- Mobile-Based
- Desktop / Server-Based
- API-Centric & Micro-Services
- By Deployment Mode
- Cloud
- On-Premise
- By Organization Size
- Small and Medium Enterprises
- Large Enterprises
- By Industry Vertical
- Banking
- Financial Services and Insurance (BFSI)
- Retail and E-commerce
- Government and Defense
- Information Technology and Telecom
- Healthcare and Life Sciences
- Manufacturing
- Energy and Utilities
- Education
- Media and Entertainment
- Others (Transportation, Real Estate)
- By Geography
- North America
- United States
- Canada
- Mexico
- South America
- Brazil
- Argentina
- Rest of South America
- Europe
- United Kingdom
- Germany
- France
- Italy
- Spain
- Nordics
- Rest of Europe
- Asia-Pacific
- China
- India
- Japan
- South Korea
- Australia
- Rest of Asia-Pacific
- Middle East and Africa
- South Africa
- Saudi Arabia
- United Arab Emirates
- Nigeria
- Rest of Middle East and Africa
- North America
Data Sources, Market Sizing, and Validation
Desk Research
We start with desk research to set the market boundaries and to anchor the model to public indicators that can be traced back to primary reporting. Typical inputs include software spending context, business formation indicators, and labor signals from sources such as the US Bureau of Labor Statistics, the US Census Bureau, Eurostat, and the World Bank.
To understand adoption drivers and risk controls, we also review non-paywalled standards and guidance (including NIST cybersecurity resources), public procurement portals, and peer-reviewed journals on software engineering productivity and governance. We use company filings, product documentation, investor presentations, and trusted press coverage to confirm typical pricing approaches (subscription, user-based, or consumption-based) and how offerings are packaged. For pricing and company-level validation, we may refer to paid subscriptions for company financials and news intelligence, while treating patent activity checks similarly as supporting signals that still need interview-based confirmation. The desk sources listed here are illustrative, and many other public references were also used to collect, validate, and clarify data points.
Primary Interviews and Surveys
Primary work is used to convert broad adoption narratives into usable inputs such as paid-user counts, typical license tiers, discounting, and how customers separate platform spend from implementation help. We speak with platform users, system integrators, and functional owners across major regions so assumptions on cloud migration, citizen development policies, and security review cycles can be stress-tested before finalizing the model.
Distribution of primary research fieldwork respondents
| Company type | Respondent position | Region |
|---|---|---|
| Top tier: 31% | CXOs: 15% | APAC: 39% |
| Mid tier: 48% | Functional/Unit leaders: 38% | EMEA: 37% |
| Smaller Players: 21% | Managers: 47% | Americas: 24% |
Market-Sizing & Forecasting
Sizing is built using a top-down approach where enterprise software application-development spend is reconstructed into a low-code addressable pool through adoption rates, deployment mix, and monetization patterns by region. Once that total is formed, we corroborate it with selective bottom-up checks, such as sampled average contract values multiplied by estimated customer counts for key user groups, plus channel feedback on typical price bands.
Key inputs used in the model include cloud versus on-premises deployment share, organization size mix, the split of demand by application type (web, mobile, desktop/server, and API-centric builds), renewal and expansion behavior for subscriptions, and practical price progression over time as features and governance requirements increase. Where bottom-up signals are incomplete, gaps are handled by applying conservative ranges to pricing tiers and aligning them to validated adoption levels from interviews, then testing how sensitive the totals are to those ranges.
Forecasts rely mainly on scenario analysis because adoption can move quickly alongside enterprise digital transformation cycles and policy decisions around citizen development. The scenarios are guided by expert views on near-term IT budget changes, the pace of cloud migration, and controls that either accelerate or slow new app creation on low-code platforms.
Data Validation & Update Cycle
Outputs are checked against independent signals, then reviewed for regional and segment consistency before sign-off. We compare implied spending per organization with typical software budgeting patterns, and when we see anomalies, we trace them back to either pricing, adoption, or mix assumptions so they can be corrected.
A multi-step review is followed where assumptions are re-tested with selected respondents if the model indicates sharp jumps or unexplained share shifts. Reports are refreshed annually, and interim updates are triggered when material events occur, including major pricing changes, product bundling shifts, or policy-driven changes in adoption. Before delivery, the full model and narrative are reviewed again so clients receive the latest view available.
Mordor Intelligence's Low Code Development Platform Market Size Measured Against Other Published Estimates
Published market values for low-code platforms can differ because each publisher draws the line around what counts as platform revenue, the years used for currency conversion, and how cloud subscriptions are treated when bundled with adjacent software.
The largest gaps usually come from scope choices. For example, some studies blend no-code automation tools, integration platforms, or implementation services into the same number. Differences also show up when scenario assumptions are set aggressively for subscription expansion, or when older pricing and discount benchmarks are kept without re-checking them against current buyer behavior and partner feedback, which can shift quickly in this market.
Benchmark comparison
| Source | Market Size | Gaps in Research Methodology |
|---|---|---|
| Mordor Intelligence | USD 31.59 B (2026) | |
| Global Consultancy A | USD 45.30 B (2025) | Often includes a wider bundle that can fold in services and adjacent low-code or no-code automation categories, and the base year can be set earlier which changes how price progression is reflected. |
| Industry Research Group B | USD 27.20 B (2025) | Typically uses a narrower demand capture and may apply more conservative cloud adoption and expansion assumptions, which can understate enterprise-wide rollouts in later years. |
The spread across figures mainly tracks back to what is counted as platform-only revenue versus blended platform-plus-services, and how quickly subscription values are allowed to expand with broader usage. When platform revenue is counted only when it is directly tied to the low-code environment and then re-validated through current pricing and renewal inputs, the result is a cleaner like-for-like total, which is the approach reflected by Mordor Intelligence.
Key Questions Answered in the Report
What is the current size of the low-code development platform market?
The market stands at USD 31.59 billion in 2026 and is projected to reach USD 78.94 billion by 2031, growing at a 20.12% CAGR.
Which segment is growing fastest within the market?
Services linked to implementation, integration, and support are expanding at 23.45% CAGR, outpacing platform licence growth.
Why are federal agencies adopting low-code platforms?
Federal bodies cite accelerated legacy-system retirement, 23% contract-management savings, and simplified compliance as key benefits
How is generative AI influencing the market?
GenAI copilots embedded in leading platforms cut build-cycles by up to 40% and raise document throughput 75-fold, boosting ROI.