
Market Overview
| Study Period | 2021 - 2031 |
|---|---|
| Market Size (2026) | USD 10.86 Billion |
| Market Size (2031) | USD 14.34 Billion |
| Growth Rate (2026 - 2031) | 5.73 % |
| Fastest Growing Market | Asia-Pacific |
| Largest Market | North America |
| Market Concentration | Medium |
Major Players
*Disclaimer: Major Players sorted in no particular order Image © Mordor Intelligence. Reuse requires attribution under CC BY 4.0. |
|
Low-Calorie Sweeteners Market Analysis by Mordor Intelligence
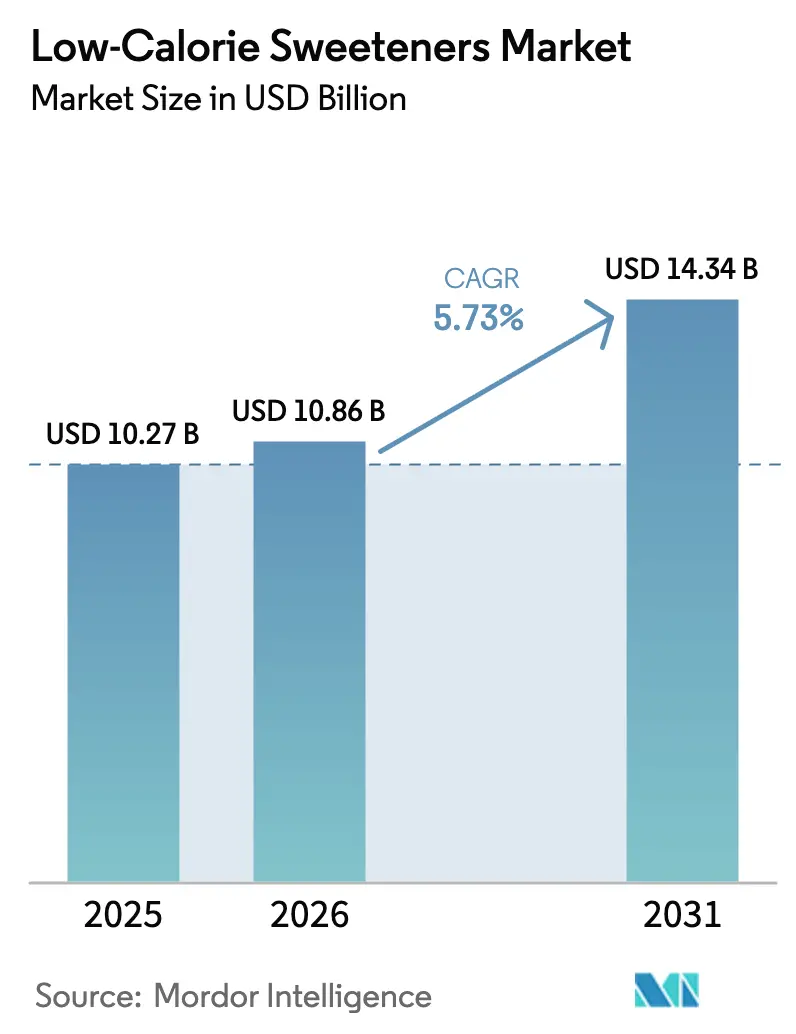
Low-calorie sweeteners market size in 2026 is estimated at USD 10.86 billion, growing from 2025 value of USD 10.27 billion with 2031 projections showing USD 14.34 billion, growing at 5.73% CAGR over 2026-2031. This growth is primarily driven by the increasing prevalence of diabetes, rising obesity rates, and extensive product reformulation initiatives undertaken by major players in the food, beverage, and pharmaceutical industries. Regulatory bodies are actively supporting sugar reduction efforts, while the rapid approval of innovative sweeteners like brazzein and the growing consumer preference for clean-label ingredients are encouraging companies to launch new products and expand production capacities. Asia-Pacific, led by South Korea and China, is expected to experience the fastest regional growth due to rising demand and supportive market dynamics. Meanwhile, North America continues to dominate in scale, supported by well-established FDA regulatory frameworks and a strong domestic manufacturing base. Innovation efforts are heavily focused on natural products, particularly stevia and monk fruit, as advancements in taste-modulation and fermentation technologies help close the performance gap with synthetic alternatives.
Key Report Takeaways
- By product type, sucralose led with 41.80% of the low-calorie sweeteners market share in 2025, whereas stevia is projected to expand at a 9.58% CAGR to 2031.
- By source, artificial sweeteners accounted for 79.45% revenue share in 2025, while natural alternatives are poised to grow at an 7.98% CAGR.
- By intensity, high-intensity products captured 62.60% share of the low-calorie sweeteners market size in 2025, and low-intensity options are forecast to rise at a 7.42% CAGR.
- By form, solid formats held 60.05% share in 2025; liquid variants record the highest projected growth at 7.31% through 2031.
- By application, food and beverages represented 39.20% of the low-calorie sweeteners market size in 2025 and are advancing at an 8.21% CAGR.
- By geography, North America dominated with 32.30% share in 2025, whereas Asia-Pacific is expected to log a 7.05% regional CAGR to 2031.
Note: Market size and forecast figures in this report are generated using Mordor Intelligence’s proprietary estimation framework, updated with the latest available data and insights as of 2026.
Market Trends and Insights
Drivers Impact Analysis of Low-Calorie Sweeteners Market*
| Driver | (~) % Impact on CAGR Forecast | Geographic Relevance | Impact Timeline |
|---|---|---|---|
| Increasing prevalence of diabetes and obesity | +1.8% | Global, with highest impact in North America and Asia-Pacific | Long term (≥ 4 years) |
| Expanding applications in food, beverage, and pharmaceutical industries | +1.2% | Global, concentrated in developed markets | Medium term (2-4 years) |
| Rising consumer health awareness | +1.0% | North America, Europe, urban Asia-Pacific | Medium term (2-4 years) |
| Consumer preference for sugar alternatives | +0.9% | Global, led by North America and Europe | Short term (≤ 2 years) |
| Government policies promoting sugar reduction | +0.7% | Europe, Middle East, selective Asia-Pacific markets | Long term (≥ 4 years) |
| Growing demand for low-calorie products among fitness enthusiasts | +0.5% | North America, Europe, urban centers globally | Short term (≤ 2 years) |
| Source: Mordor Intelligence | |||
Increasing prevalence of diabetes and obesity
The increasing prevalence of diabetes and obesity is a significant driver for the low-calorie sweeteners market. According to the International Diabetes Federation (IDF), approximately 589 million adults (20-79 years) were living with diabetes in 2024, and this number is projected to rise to 853 million by 2050 [1]Source: International Diabetes Federation, "Diabetes around the world in 2024", www.idf.org. The Centers for Disease Control and Prevention (CDC) highlights that in the United States alone, over 38.4 million people have diabetes, with 98 million adults having prediabetes as of 2024 [2]Source: Centers for Disease Control and Prevention, "National Diabetes Statistics Report", www.cdc.gov. This growing health crisis has led to increased awareness regarding the adverse effects of excessive sugar consumption, prompting consumers to seek healthier alternatives. Governments and health organizations worldwide are actively promoting the use of low-calorie sweeteners as part of dietary interventions to address these issues. For instance, the CDC and WHO recommend reducing added sugar intake to manage weight and prevent chronic diseases such as diabetes and cardiovascular conditions. Additionally, initiatives like sugar taxes and public health campaigns in countries such as the United Kingdom, Mexico, and India are further encouraging the adoption of low-calorie sweeteners. These factors are expected to significantly drive the demand for low-calorie sweeteners during the forecast period.
Expanding applications in food, beverage, and pharmaceutical industries
The expanding applications of low-calorie sweeteners in the food, beverage, and pharmaceutical industries are driving market growth. In the food and beverage sector, these sweeteners are increasingly used to cater to the rising demand for healthier alternatives, particularly among health-conscious consumers and those managing conditions like diabetes and obesity. Low-calorie sweeteners are being incorporated into a wide range of products, including baked goods, beverages, dairy products, and confectionery, to reduce calorie content without compromising taste. In the pharmaceutical industry, low-calorie sweeteners are gaining traction as excipients in formulations, especially in syrups, chewable tablets, and lozenges, where they enhance palatability without adding unnecessary calories. The growing focus on wellness and preventive healthcare further fuels the adoption of these sweeteners, as consumers and manufacturers alike seek to align with healthier lifestyle trends. This trend is supported by ongoing innovations in sweetener formulations, which aim to improve taste profiles and expand application possibilities.
Rising consumer health awareness
Consumers are becoming increasingly health-conscious, which is driving the demand for low-calorie sweeteners. With growing awareness about the adverse effects of excessive sugar consumption, such as obesity, diabetes, and other chronic health conditions, individuals are actively seeking healthier alternatives. This shift in consumer preferences is encouraging manufacturers to innovate and introduce low-calorie sweeteners that cater to the demand for healthier food and beverage options. Additionally, the trend is supported by government initiatives and campaigns promoting reduced sugar intake, further boosting the market for low-calorie sweeteners. The rising prevalence of lifestyle-related diseases has also heightened the focus on preventive healthcare, pushing consumers to adopt sugar substitutes as part of their daily diet. Furthermore, advancements in food technology have enabled the development of low-calorie sweeteners that mimic the taste of sugar without compromising on flavor, making them more appealing to a broader audience.
Government policies promoting sugar reduction
Government initiatives aimed at reducing sugar consumption are driving the growth of the market. Regulatory bodies, such as the World Health Organization (WHO) and national health departments, have introduced guidelines and policies to curb excessive sugar intake. For instance, the United States Food and Drug Administration (FDA) has mandated updated nutrition labels to highlight added sugars, while the United Kingdom's Soft Drinks Industry Levy (commonly referred to as the sugar tax) has incentivized manufacturers to reformulate products with reduced sugar content. Similarly, countries like Mexico and India have implemented taxation on sugar-sweetened beverages to discourage consumption. The European Union has also introduced strategies under its Farm to Fork initiative, aiming to reduce sugar levels in processed foods. Additionally, organizations like the American Heart Association recommends limiting added sugars to no more than 6% of calories each day [3]Source: American Heart Association, "Added Sugars", www.heart.org. These measures, supported by public health campaigns and collaborations with industry associations, are fostering the adoption of low-calorie sweeteners as viable alternatives in food and beverage formulations.
Restraints Impact Analysis of Low-Calorie Sweeteners Market*
| Restraint | (~) % Impact on CAGR Forecast | Geographic Relevance | Impact Timeline |
|---|---|---|---|
| High production costs of natural and novel sweeteners | -1.1% | Global, most acute in emerging markets | Medium term (2-4 years) |
| Limited availability of raw materials affects production scalability and price stability | -0.8% | Global, concentrated in stevia and monk fruit supply chains | Long term (≥ 4 years) |
| Health concerns regarding artificial sweeteners | -0.6% | Europe, North America, health-conscious demographics | Medium term (2-4 years) |
| Strict regulatory requirements and lengthy approval processes | -0.4% | Europe, emerging markets with evolving frameworks | Long term (≥ 4 years) |
| Source: Mordor Intelligence | |||
High production costs of natural and novel sweeteners
The high production costs associated with natural and novel sweeteners act as a significant restraint in the low-calorie sweeteners market. These sweeteners often require advanced extraction and processing techniques, which increase manufacturing expenses. Additionally, sourcing raw materials, such as stevia leaves or monk fruit, can be costly due to limited availability and the need for sustainable farming practices. The complexity of maintaining product quality and consistency further adds to the overall production costs. Furthermore, the regulatory requirements for natural and novel sweeteners, including compliance with food safety standards and obtaining necessary certifications, contribute to the financial burden on manufacturers. The need for research and development to improve production efficiency and develop innovative formulations also escalates costs. As a result, manufacturers face challenges in offering these sweeteners at competitive prices, which may hinder their adoption in price-sensitive markets. This cost barrier could also impact the ability of smaller players to enter the market, thereby limiting competition and innovation within the industry.
Strict regulatory requirements and lengthy approval processes
The low-calorie sweeteners market faces significant challenges due to strict regulatory requirements and lengthy approval processes. Governments worldwide have implemented stringent regulations to ensure the safety and efficacy of low-calorie sweeteners before they are introduced to the market. Regulatory bodies, such as the United States Food and Drug Administration (FDA) and the European Food Safety Authority (EFSA), mandate comprehensive testing and evaluation of these products. These processes often involve extensive clinical trials, toxicological assessments, and long-term studies to determine potential health impacts. Additionally, the approval timelines for new low-calorie sweeteners can be prolonged, as regulatory agencies meticulously review the submitted data to ensure compliance with safety standards. For instance, the FDA requires manufacturers to submit a Generally Recognized as Safe (GRAS) notification or a food additive petition, both of which involve rigorous scrutiny. Similarly, the EFSA conducts detailed risk assessments before granting approval for use within the European Union. These regulatory hurdles not only delay the introduction of new products but also increase the costs associated with research and development.
*Our forecasts treat driver/restraint impacts as directional, not additive. The impact forecasts reflect baseline growth, mix effects, and variable interactions.
Low-Calorie Sweeteners Market Segment Analysis
By Product Type:
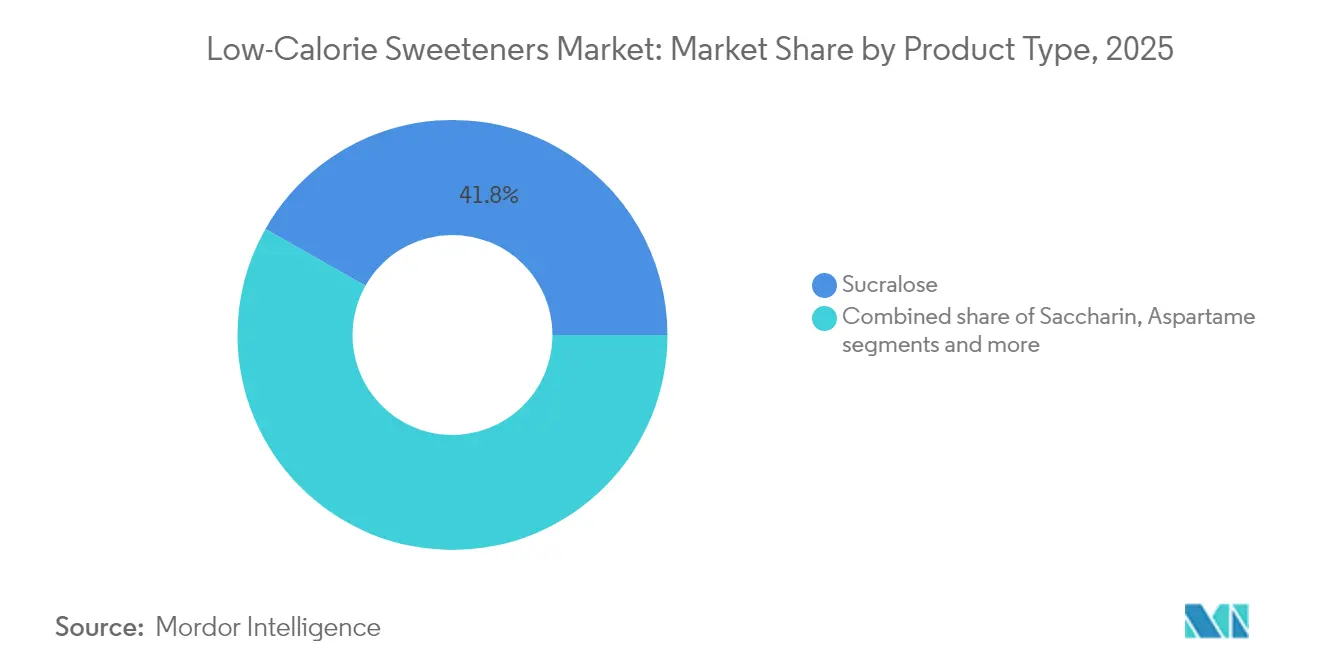
Sucralose Dominance Faces Natural Alternative ChallengeSucralose continues to dominate with a commanding 41.80% market share in 2025. This leadership is supported by its established regulatory approvals across more than 80 countries, ensuring its widespread acceptance. Sucralose is a high-intensity artificial sweetener that is approximately 600 times sweeter than sugar, making it highly efficient for use in small quantities. Its proven stability under high temperatures and across a wide pH range makes it ideal for various food and beverage applications, including baked goods, dairy products, and carbonated drinks. Additionally, sucralose is non-caloric and does not contribute to tooth decay, further enhancing its appeal among health-conscious consumers and manufacturers. The ingredient's long shelf life and compatibility with other sweeteners also contribute to its sustained market dominance.
On the other hand, stevia is emerging as the fastest-growing segment in the market, with a robust CAGR of 9.58% projected through 2031. This growth is primarily driven by increasing consumer preference for natural alternatives to artificial sweeteners. Derived from the leaves of the Stevia rebaudiana plant, stevia is a zero-calorie sweetener that aligns with the growing demand for clean-label and plant-based products. Technological advancements in taste optimization, such as reducing the bitter aftertaste traditionally associated with stevia, have significantly improved its sensory profile, making it more appealing to a broader consumer base. Stevia is widely used in beverages, confectionery, and dietary products, as it caters to the needs of consumers seeking healthier and more natural sweetening options.


By Source:
Artificial Leadership Challenged by Natural InnovationIn 2025, artificial sweeteners dominate the low-calorie sweeteners market with an 79.45% market share. This dominance is attributed to decades of regulatory approvals that have established their safety for consumption and their widespread adoption in large-scale food manufacturing. Artificial sweeteners offer significant cost advantages, making them a preferred choice for manufacturers aiming to produce low-calorie products at scale. These sweeteners are extensively used in beverages, baked goods, and processed foods due to their ability to provide sweetness without adding calories. Additionally, their long shelf life and stability under various processing conditions further enhance their appeal in the food and beverage industry.
Natural alternatives, on the other hand, are gaining momentum in the market, driven by a growing consumer preference for clean-label products. These alternatives are projected to grow at a compound annual growth rate (CAGR) of 7.98% through 2031. Innovations in production technologies have addressed historical challenges related to cost and taste, making natural sweeteners more accessible and appealing to both manufacturers and consumers. Ingredients such as stevia, monk fruit, and erythritol are increasingly being incorporated into food and beverage formulations, as they align with the demand for natural, plant-based, and minimally processed products. The rising awareness of health and wellness trends, coupled with regulatory support for natural sweeteners, is expected to further propel their adoption in the forecast period.
By Intensity:
High-Intensity Dominance with Low-Intensity GrowthIn 2025, high-intensity sweeteners dominate the market, holding a significant 62.60% market share. These sweeteners are widely preferred due to their cost-effectiveness, as they achieve the desired sweetness levels with minimal ingredient usage. High-intensity sweeteners, such as aspartame, sucralose, and saccharin, are extensively used in various applications, including beverages, confectionery, and processed foods. Their ability to provide intense sweetness without adding calories makes them a popular choice among manufacturers aiming to meet consumer demand for healthier, low-calorie products. Additionally, their long shelf life and stability under different processing conditions further contribute to their widespread adoption across the food and beverage industry.
On the other hand, low-intensity sweeteners are experiencing steady growth, with a projected CAGR of 7.42% through 2031. These sweeteners address specific formulation challenges where sugar's functional properties, such as texture, bulk, and moisture retention, are essential beyond just sweetness. Low-intensity sweeteners, including erythritol, xylitol, and sorbitol, are increasingly used in applications like baked goods, dairy products, and pharmaceuticals. Their ability to mimic sugar's physical properties while offering reduced calorie content makes them a valuable ingredient in product formulations. The growing demand for clean-label and natural ingredients further drives the adoption of low-intensity sweeteners, as they align with consumer preferences for healthier and more natural alternatives.
By Application:
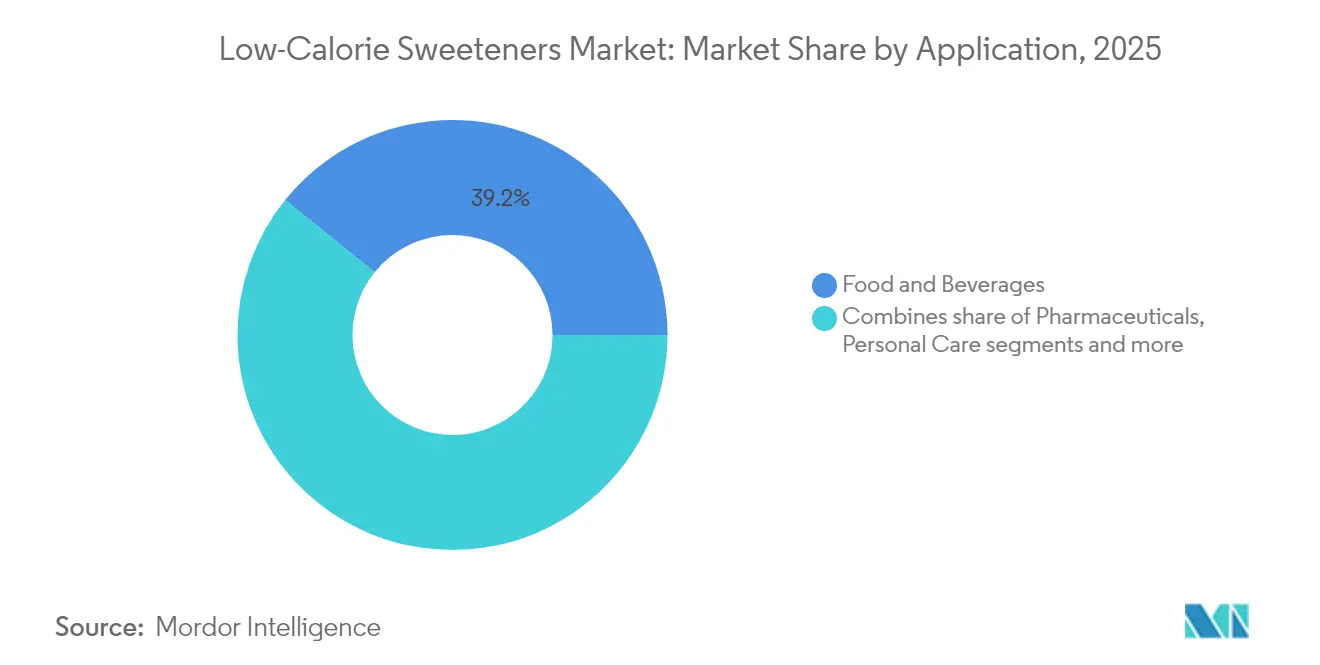
Food and Beverages Drive Growth Across CategoriesFood and beverages, accounting for a dominant 39.20% share, are not only the largest segment but also the fastest-growing, with an impressive 8.21% CAGR projected through 2031. This growth underscores extensive reformulation efforts across various product categories to meet the rising demand for low-calorie alternatives. Innovations in heat-stable sweeteners are benefiting bakery and confectionery applications by enabling the production of low-calorie products without compromising taste or texture. Meanwhile, the dairy and dessert sectors are utilizing texture-preserving formulations to retain desired mouthfeel characteristics while reducing calorie content.
Beverages are capitalizing on a zero-calorie positioning to drive volume growth, as consumers increasingly seek healthier options. Notably, sports drinks and functional beverages are turning to intricate sweetener blends for optimal taste enhancement, ensuring they meet the dual demand for functionality and reduced calorie intake. Pharmaceutical applications are broadening their horizons in the low-calorie sweeteners market. Beyond merely sweetening traditional tablets, they're now employing taste-masking technologies, especially for pediatric formulations and bitter drug compounds, to improve patient compliance. These advancements are particularly significant as they allow for the development of low-calorie medicinal products that cater to health-conscious consumers. The personal care sector is witnessing a surge in adoption, particularly in oral health products, which are harnessing the anti-cariogenic benefits of specific sweeteners like xylitol.
By Form:
Solid Preference with Liquid InnovationIn 2025, solid sweeteners dominate the Low Calorie Sweeteners Market with a 60.05% market share. This significant share is attributed to their well-established manufacturing processes and widespread consumer familiarity with powder and granular formats. Solid sweeteners are preferred in various applications, including baking, confectionery, and packaged foods, due to their ease of handling, longer shelf life, and consistent performance in recipes. Additionally, their compatibility with existing food production systems further strengthens their position in the market. The demand for solid sweeteners remains robust as they continue to cater to the growing need for low-calorie alternatives in traditional food products.
Liquid sweeteners, on the other hand, are experiencing rapid growth in the market, with a projected CAGR of 7.31% through 2031. This growth is primarily driven by their increasing adoption in the beverage industry, where their improved solubility and ease of blending make them a preferred choice. Recent advancements in solubility formulations have addressed historical challenges related to dissolution, enhancing their functionality in various liquid applications. Liquid sweeteners are also gaining traction in ready-to-drink beverages, flavored syrups, and dairy alternatives, where their ability to provide uniform sweetness and ease of incorporation into formulations is highly valued. As consumer demand for healthier beverage options rises, liquid sweeteners are expected to play a pivotal role in meeting these preferences.
Geography Analysis
North America Low-Calorie Sweeteners Market
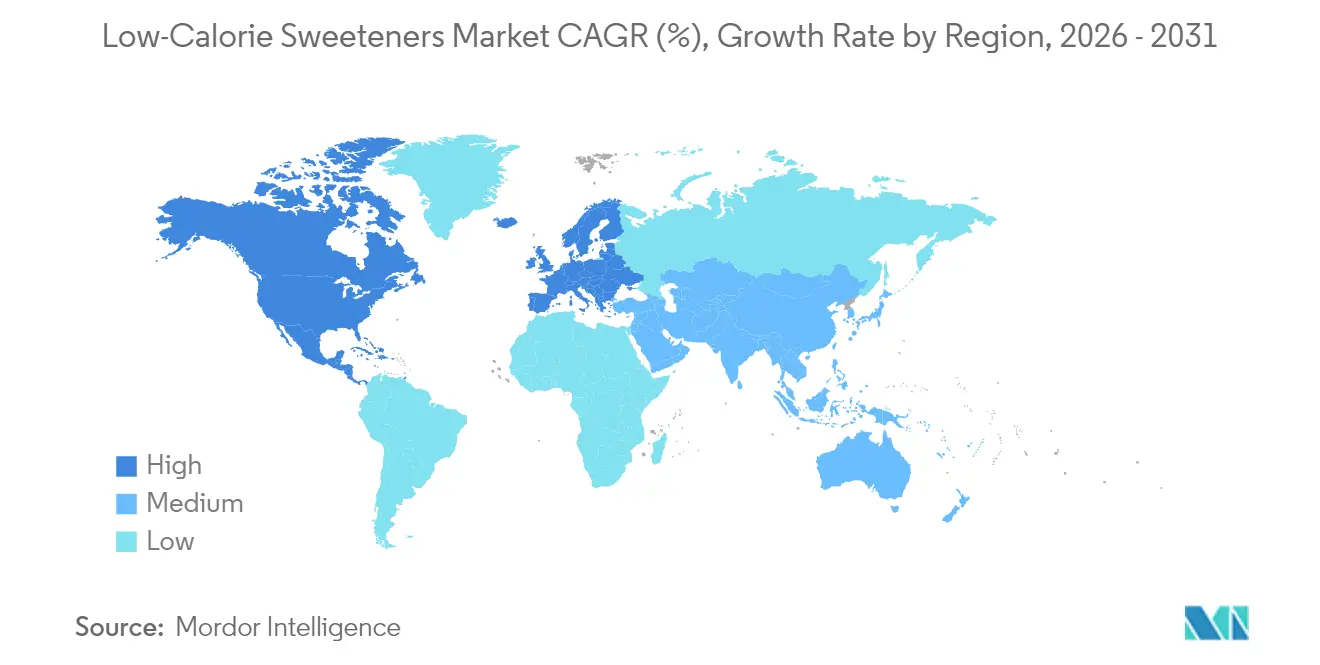
In 2025, North America commands a dominant 32.30% market share, bolstered by its robust regulatory frameworks and advanced food processing infrastructure, which facilitate swift adoption of new products. The region benefits from a well-established supply chain and significant investments in research and development, enabling manufacturers to introduce innovative low-calorie sweeteners that cater to evolving consumer preferences. Additionally, the growing demand for clean-label and natural sweeteners further strengthens North America's market position. The increasing prevalence of obesity and diabetes in the region has also led to heightened consumer awareness regarding sugar intake, driving the adoption of low-calorie alternatives. Major players in the market are leveraging partnerships with food and beverage companies to expand their product portfolios and meet the rising demand for healthier options.
APAC Low-Calorie Sweeteners Market
Asia-Pacific is on track to be the fastest-growing region, boasting a 7.05% CAGR through 2031. This growth is fueled by a surge in diabetes cases, increasing health consciousness, and a swift pace of regulatory approvals in major markets. Governments in countries like India and China are implementing sugar reduction policies, which are driving the adoption of low-calorie sweeteners. South Korea is at the forefront of regional innovation, making substantial investments in allulose production to meet rising demand. Meanwhile, Singapore's Frutti Sugar is ramping up production to match prices with conventional sugar, aiming to make low-calorie sweeteners more accessible to consumers across the region.
EMEA Low-Calorie Sweeteners Market
Europe holds a significant position in the low-calorie sweeteners market, driven by increasing consumer demand for healthier alternatives and stringent regulations promoting sugar reduction. The region is witnessing a rise in product innovation, with manufacturers focusing on natural and plant-based sweeteners to align with consumer preferences. Countries like Germany and the United Kingdom are leading in the adoption of low-calorie sweeteners, supported by government initiatives and collaborations with food and beverage companies. In the Middle East & Africa, the market is gradually expanding, supported by rising health awareness and government initiatives to combat obesity and diabetes. The United Arab Emirates and South Africa are emerging as key contributors, with investments in local production and distribution networks to cater to the growing demand.

Regulatory Landscape
Regulation for low-calorie sweeteners is primarily structured around pre-market safety assessments and permitted-use lists maintained by authorities such as the US Food and Drug Administration (FDA), the European Food Safety Authority (EFSA), and FAO/WHO JECFA. In the European Union, sweeteners are managed under the E-number system, and EFSA has continued its re-evaluation work across multiple sweetener classes, including ongoing work in 2026 on polyols (such as sorbitol, mannitol, maltitol, and xylitol).
A key recent proof point is EFSA's February 2026 communication on sucralose (E 955), which confirmed safety for currently authorised uses but did not extend that confirmation to uses involving industrial processes at high temperatures. In parallel, industry-facing compliance materials such as the Calorie Control Council Regulatory Handbook (updated November 2025) and country-level food codes, including Egypt NFSA Decree No. 5, 2024 and South Korea's Food Code, influence labeling, specifications, and market-entry requirements across major geographies.
Value Chain Analysis
The low-calorie sweeteners value chain begins with upstream agricultural and chemical feedstocks, for example stevia leaf supply for natural high-intensity sweeteners and carbohydrate streams used to manufacture polyols. This is followed by extraction, fermentation/bioconversion or chemical synthesis, and purification into standardized ingredient formats in solid and liquid forms. Ingredient manufacturers then supply both single sweeteners, such as sucralose and stevia, and application-specific systems for sugar reduction that are incorporated into food and beverage, pharmaceutical, and personal care formulations.
Downstream, formulators and brand owners depend on distributors, regional blenders, and technical service teams for specification management, sensory optimization, and regulatory documentation across markets. Trade groups such as the International Sweeteners Association (ISA) and the International Stevia Council (ISC) support alignment on scientific communication and policy engagement, which matters when approvals and use conditions vary by jurisdiction and when re-evaluations such as EFSA workstreams in 2026 adjust permitted applications and compliance requirements.
Competitive Landscape
The low-calorie sweeteners market demonstrates moderate consolidation. This score reflects a competitive landscape where a few key players hold significant market shares, driving strategic activities such as mergers, acquisitions, and partnerships. Companies are increasingly focusing on expanding their product portfolios and enhancing their market presence to gain a competitive edge. For instance, major players like Cargill, Incorporated, Archer-Daniels-Midland Company, Tate & Lyle PLC, and Roquette Freres SA have been actively investing in research and development to introduce innovative low-calorie sweetener solutions that cater to evolving consumer preferences.
In this moderately consolidated market, smaller players are also striving to carve out their niche by targeting specific consumer segments and offering unique value propositions. For example, startups and regional manufacturers are emphasizing natural and plant-based sweeteners, such as stevia and monk fruit, to meet the growing demand for clean-label and healthier alternatives. This trend has intensified competition, as established companies are also diversifying their offerings to include such products, thereby blurring the lines between traditional and emerging players.
The competitive dynamics in the low-calorie sweeteners market are further shaped by regulatory developments and shifting consumer trends. Companies are navigating stringent regulations regarding product safety and labeling while addressing the increasing demand for sustainable and environmentally friendly production practices. Strategic collaborations, such as partnerships with food and beverage manufacturers, are becoming common as companies aim to integrate their sweeteners into a broader range of applications. These factors collectively contribute to the evolving competitive landscape of the market, making it a dynamic and strategically active space.
Low-Calorie Sweeteners Industry Leaders
-
Tate & Lyle PLC
-
Cargill, Incorporated
-
Archer-Daniels-Midland Company
-
Ingredion Incorporated
-
Roquette Freres SA
- *Disclaimer: Major Players sorted in no particular order

Low-Calorie Sweeteners Market Companies Covered in this Report
- Tate & Lyle PLC
- Cargill, Incorporated
- Archer-Daniels-Midland Company
- Ingredion Incorporated
- Roquette Freres SA
- Ajinomoto Co., Inc
- NutraSweet Company
- Celanese Corporation
- Hyet Sweet B.V.
- Apura Ingredients Inc.
- Nantong Changhai Food Additive Co., Ltd.
- Foodchem International Corporation
- Alpspure Lifesciences Pvt. Ltd
- GLG Life Tech Corporation
- Evolva Holding SA
- Fengchen Group Co.,Ltd
- Morita Kagaku Kogyo Co. Ltd
- JK Sucralose Inc
- DSM - Fimenich
- Whole Earth Sweetener Company LLC

Market Opportunities and Future Outlook
A major opportunity is the shift from single-ingredient substitution toward integrated sugar-reduction solutions that combine high-intensity sweeteners with bulking agents and texture systems to preserve mouthfeel and stability in complex applications, particularly bakery, dairy, and beverages. This direction is supported by supplier activity: in June 2026, Ingredion announced a recommended all-cash offer to acquire Tate & Lyle for approximately GBP 3.7 billion (about USD 5.0 billion), positioning a combined portfolio spanning stevia, sucralose, allulose, fibers, texturisers, and stabilisers for reformulation programs that require both sweetness and functional performance.
Another opportunity is managing tighter scrutiny around use conditions and category-by-category compliance. Suppliers that pair ingredient innovation with regulatory dossiers and application support gain leverage as permitted uses become more nuanced. EFSA's February 2026 position on sucralose, safe for currently authorised uses but not confirmed for certain high-temperature industrial extensions, reinforces the commercial value of processing-compatible alternative sweetener systems. At the same time, trade and scientific bodies, including ISA and ISC, along with industry compliance references such as the Calorie Control Council handbook updated in November 2025, continue to standardize technical narratives that support adoption with multinational food, beverage, and pharmaceutical customers.
Recent Industry Developments in Low-Calorie Sweeteners Market
- June 2026: Cargill Incorporated reported a shift in sugar reduction strategy toward integrated formulation systems, combining its Eversweet stevia with polyols, starches, and texturizers to address bakery and beverage sugar reduction challenges. The cross-functional approach expands use-cases beyond single-ingredient substitutes in food and beverage applications.
- May 2026: Tate & Lyle PLC expanded its collaboration with BioHarvest Sciences to include multiple plant-based sweetener molecules within their joint development program. The expanded pipeline supports North American clean-label, plant-based sweetener capabilities and supply potential.
- February 2026: Tate & Lyle PLC launched the Yume brand under The Sweetener Alliance; the first product is Yume M Stevia Sweetener produced at the Manus BioFacility in Augusta, Georgia. The market entry adds US-sourced supply chain reach and extends the stevia-based portfolio.


Low-Calorie Sweeteners Market Report Scope and Research Methodology
Market Definition and Coverage
This market covers revenue from low-calorie sweeteners sold as sugar substitutes for use in packaged foods, beverages, and other end uses. Values are counted at the manufacturer selling level into downstream channels and sized in USD across major consuming regions.
Scope exclusions: We exclude table sugar and other high-calorie nutritive sweeteners. We also exclude retail price markups added after manufacturer-level selling.
Segments Covered in This Report
-
By Type
- Sucralose
- Saccharin
- Aspartame
- Neotame
- Advantame
- Acesulfame Potassium
- Stevia
- Sugar Alcohols
- Other Types
-
By Source
- Natural
- Artificial
-
By Intensity
- High-Intensity Sweeteners
- Low-Intensity Sweeteners
- Others
-
By Form
- Solid
- Liquid
-
By Application
-
Food and Beverages
- Bakery and Confectionery
- Dairy and Desserts
- Sauces, Dressings and Condiments
- Beverages
- Other Food and Beverage Applications
- Pharmaceuticals
- Personal Care
- Other Applications
-
Food and Beverages
-
By Geography
-
North America
- United States
- Canada
- Mexico
- Rest of North America
-
Europe
- Germany
- United Kingdom
- Italy
- France
- Spain
- Netherlands
- Sweden
- Poland
- Belgium
- Rest of Europe
-
Asia-Pacific
- China
- India
- Japan
- Australia
- South Korea
- Indonesia
- Thailand
- Singapore
- Rest of Asia-Pacific
-
South America
- Brazil
- Argentina
- Chile
- Peru
- Rest of South America
- Colombia
-
Middle East and Africa
- South Africa
- Saudi Arabia
- United Arab Emirates
- Nigeria
- Morocco
- Egypt
- Turkey
- Rest of Middle East and Africa
-
North America
Data Sources, Market Sizing, and Validation
Desk Research
Desk research was used to set the market boundary and to collect repeatable demand signals that can be checked each year. Public sources, such as USDA datasets and the US International Trade Commission trade statistics, helped us track import-export movements for key sweetener categories and how those flows vary by region.
We also referenced sources such as EFSA and European Commission materials for regulatory context, along with FAO statistics for food production and consumption patterns that influence sweetener usage. Company filings, investor presentations, association publications, and reputable press were reviewed to map capacity changes, product positioning, and application trends in beverages and processed foods. In addition, we used paid subscriptions for company financials and intelligence, news and financials, and patent databases to validate timelines and innovation activity. These sources are illustrative only, and many other public documents were also used for data collection, validation, and clarification.
Primary Interviews and Surveys
Primary interviews and structured surveys were carried out with a mix of manufacturers, distributors, ingredient buyers, and technical roles involved in formulation and compliance. To keep assumptions realistic, regional adoption patterns and pricing direction were checked across APAC, EMEA, and the Americas, and then used to close gaps left by public data in product mix and application splits.
Distribution of primary research fieldwork respondents
| Company type | Respondent position | Region |
|---|---|---|
| Top tier: 29% | CXOs: 12% | APAC: 40% |
| Mid tier: 57% | Functional/Unit leaders: 28% | EMEA: 36% |
| Smaller Players: 14% | Managers: 60% | Americas: 24% |
Market-Sizing & Forecasting
Our market model starts with a top-down build where packaged food and beverage output, along with trade indicators, is used to reconstruct the addressable demand pool for sugar-reduction ingredients. We then filter that pool through low-calorie sweetener adoption by application.
Once that structure is in place, selective bottom-up checks are used, such as sampling typical price bands and pairing them with volume proxies, followed by channel checks with buyers. Totals can be adjusted if the first pass looks inconsistent with supplier and buyer expectations.
A few of the practical inputs used in the model include sweetener penetration in beverages, reformulation activity tied to sugar-reduction policies, relative price progression versus sugar, the split between high-intensity and bulk sweeteners, and regional packaged food growth. Where detailed volume data is not available, gaps are handled by using proxy ratios from comparable applications and then confirming the direction and magnitude through expert feedback. For forecasting, scenario analysis is applied around key variables, and the final growth path is selected after it aligns with what interviewees expect for adoption, pricing, and reformulation pace over the forecast period.
Data Validation & Update Cycle
Before finalizing results, we run triangulation checks across multiple angles, including packaged food and beverage activity, trade movements, and pricing narratives gathered from interviews. Outliers are reviewed in a step-by-step way, where unusual jumps are traced back to a specific input, and then corrected or documented if a one-time event is responsible.
The model and narrative go through internal analyst reviews, and follow-up outreach is triggered when respondents disagree on a key assumption such as price change, mix shift, or application adoption. Reports are refreshed annually, and interim updates are done when material events occur, such as regulation changes or major capacity additions. Right before delivery, an analyst performs a fresh data pass so clients receive the most recently updated view.
Mordor Intelligence's Low Calorie Sweeteners Market Size Compared Against Other Published Estimates
Published market sizes for low-calorie sweeteners can look different even when the topic sounds the same, because the scope lines vary and so do the pricing and conversion assumptions. Differences also come from the base year selected for the headline number, and how often inputs are refreshed.
Trade-flow patterns for key sweetener categories and application-level reformulation signals are the evidence checks that keep Mordor Intelligence anchored to manufacturer-level revenue for low-calorie sweeteners, rather than counting broader sugar-substitute baskets or retail markups.
Benchmark comparison
| Source | Market Size | Gaps in Research Methodology |
|---|---|---|
| Mordor Intelligence | USD 10.86 B (2026) | |
| Global Publisher A | USD 4.91 B (2025) | Uses a reduced-calorie sweetener scope with a different base year and mix, and it can undercount beverage and processed-food intensity when prices are averaged broadly across forms and regions. |
| Industry Publisher B | USD 3.39 B (2025) | Starts from a narrower 2025 base and a short historical window, and the sizing appears to apply simplified adoption and price progression assumptions across geographies. |
The spread mainly comes down to what is included as a low-calorie sweetener, the year used for the headline value, and how price and mix are handled across regions. By keeping steps tied to observable demand signals and then re-checking them with supplier and buyer inputs, we arrive at a market total that can be repeated when new data becomes available.


Key Questions Answered in the Report
What is the projected size of the low-calorie sweeteners market by 2031?
The low-calorie sweeteners market size is expected to reach USD 14.34 billion by 2031, growing at a 5.73% CAGR.
Which product type currently leads the market?
Sucralose leads with 41.80% of global revenue and benefits from approvals in more than 80 countries.
Why are natural sweeteners gaining traction?
Clean-label demand, favorable regulatory shifts, and advances in fermentation that lower cost differentials are accelerating adoption of stevia and monk fruit.
Which region will expand the fastest?
Asia-Pacific is forecast to record a 7.05% CAGR through 2031, driven by rising diabetes prevalence and expanding manufacturing capacity.
How do government policies influence market growth?
Sugar taxes, school meal guidelines, and ingredient approval reforms create mandatory reformulation deadlines that propel supplier sales.
Page last updated on:


 Your data is secure and never sold or shared.


