
Los Angeles Data Center Market Size and Share
Market Overview
| Study Period | 2021 - 2032 |
|---|---|
| Forecast Data Period | 2026 - 2032 |
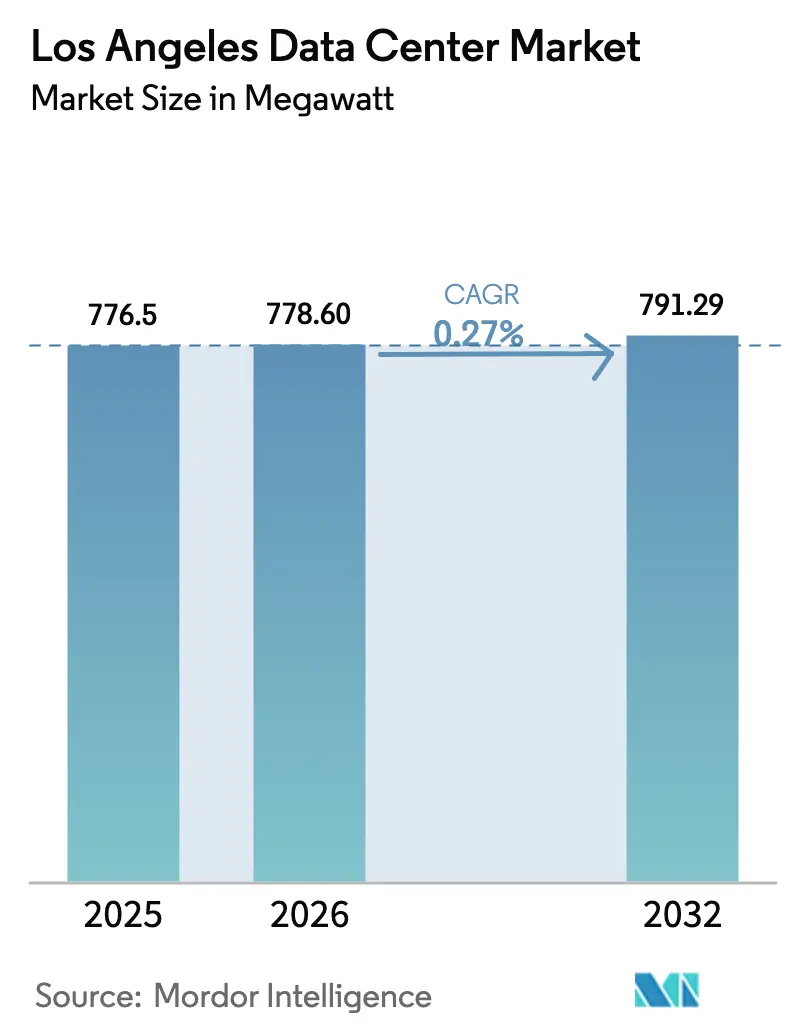
| Base Year Market Size (2025) | 776.5 megawatt |
| Market Volume (2026) | 778.60 megawatt |
| Market Volume (2032) | 791.29 megawatt |
| Growth Rate (2026 - 2032) | 0.27% CAGR |
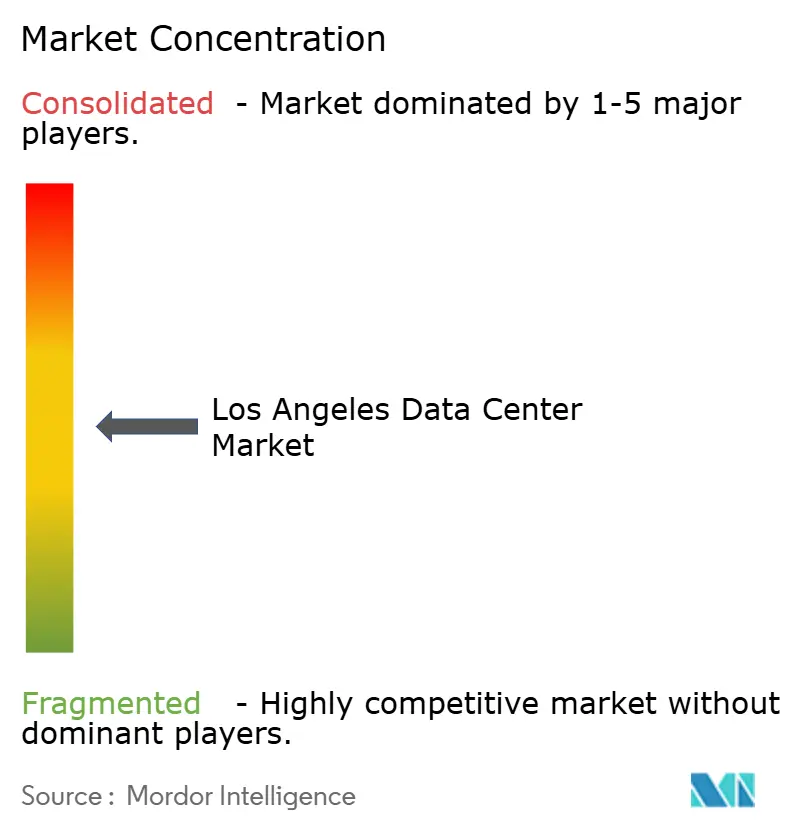
| Market Concentration | Medium |
Major Players *Disclaimer: Major Players sorted in no particular order Image © Mordor Intelligence. Reuse requires attribution under CC BY 4.0. | |
Los Angeles Data Center Market Analysis by Mordor Intelligence
The Los Angeles data center market size was valued at 776.5 MW in 2025 and estimated to grow from 778.6 MW in 2026 to reach 791.29 MW by 2032, at a CAGR of 0.27% during the forecast period (2026-2032). This tepid headline growth contrasts sharply with the city’s strategic role as a trans-Pacific interconnection hub and as North America’s entertainment capital, two factors that continue to anchor demand even when capacity additions remain modest. AI-centric hyperscale requirements, entertainment rendering workloads, and West-Coast subsea cable landings are driving incremental power purchases, while scarce 230 kV transmission interconnects, seismic-design premiums, and lengthy power-delivery queues restrain large new builds. Operators with legacy downtown footprints leverage existing utility allocations and dense carrier ecosystems to out-compete greenfield entrants in emerging suburban clusters. Together, these countervailing forces underpin a market that grows slowly in aggregate capacity yet remains critical for latency-sensitive workloads traversing both domestic and Asia-Pacific routes.
Key Report Takeaways
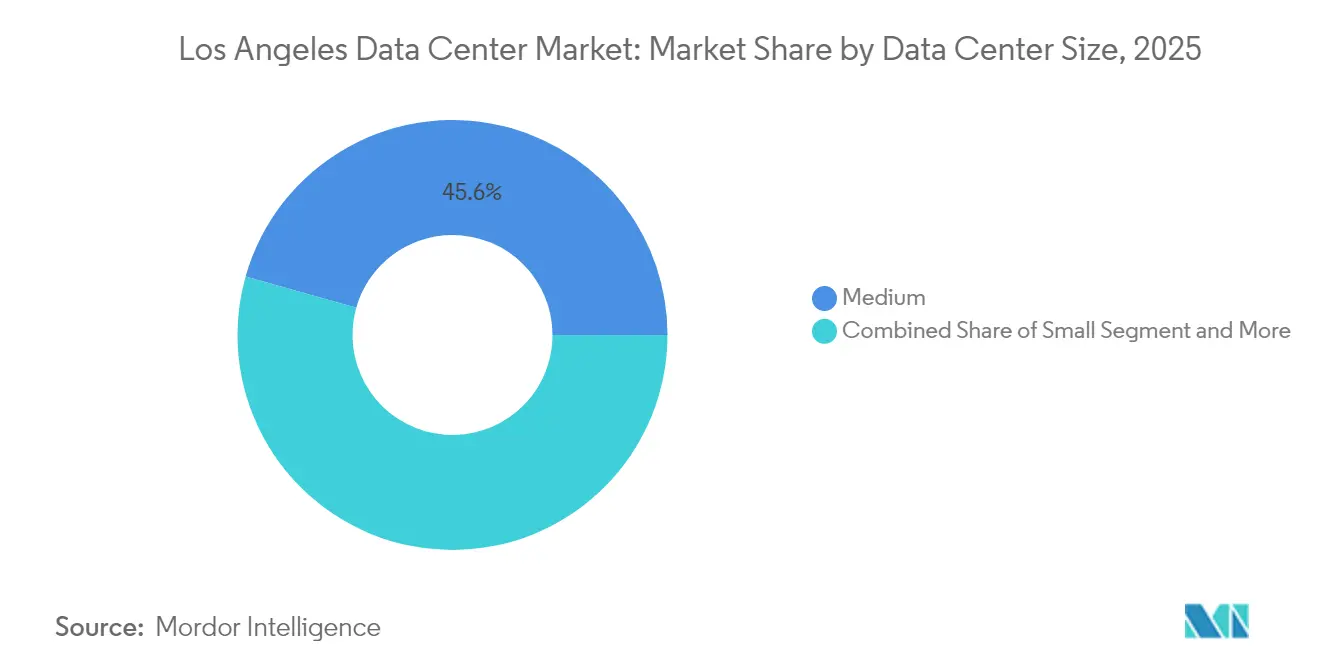
- By data center size, 20–50 MW facilities led with 45.62% of Los Angeles data center market share in 2025, whereas mega-scale deployments above 50 MW are forecast to expand at a 0.96% CAGR through 2032.
- By tier standard, Tier III infrastructure dominated with 63.25% share of the Los Angeles data center market size in 2025, while Tier IV facilities are projected to advance at a 2.08% CAGR to 2032.
- By absorption, retail colocation accounted for 57.65% of the Los Angeles data center market size in 2025; hyperscale utilization is rising at a 2.37% CAGR through 2032.
Note: Market size and forecast figures in this report are generated using Mordor Intelligence’s proprietary estimation framework, updated with the latest available data and insights as of 2026.
Los Angeles Data Center Market Trends and Insights
Drivers Impact Analysis*
| DRIVER | (~) % IMPACT ON CAGR FORECAST | GEOGRAPHIC RELEVANCE | IMPACT TIMELINE |
|---|---|---|---|
| AI-centric hyperscale tranche demand | +0.8% | Global, concentrated in LA metro | Medium term (2–4 years) |
| Surging film-render and streaming workloads | +0.4% | Los Angeles Basin, Hollywood corridor | Short term (≤ 2 years) |
| West-Coast subsea cable landings (Hawaiki Nui, CAP-1) | +0.3% | Pacific-Rim connectivity, LA landing points | Long term (≥ 4 years) |
| 400 MW Southern CA utility-scale solar + BESS PPAs | +0.2% | Southern California Edison territory | Medium term (2–4 years) |
| Revitalization of under-utilized Hollywood sound stages into edge DCs | +0.1% | Hollywood, Burbank, Culver City | Short term (≤ 2 years) |
| State “L.A. Clean Grid 2045” incentives for on-site micro-nuclear SMRs | +0.1% | LADWP service territory | Long term (≥ 4 years) |
| Source: Mordor Intelligence | |||
AI-centric hyperscale tranche demand
Liquid-cooled racks exceeding 50 kW are now standard in new builds as GPU training clusters reshape facility design parameters. Digital Realty introduced direct liquid cooling across its Los Angeles footprint in May 2024, eliminating the thermal limitations of legacy CRAC systems.[1]Swinhoe Dan, “Digital Realty Launches Direct Liquid Cooling Offering,” Data Center Dynamics, datacenterdynamics.com Equinix followed with a USD 15 billion joint venture that allocates more than 1.5 GW of hyperscale power to key U.S. metros, including Los Angeles. Procurement lead times reinforce first-mover advantages: Cooling Distribution Units now average 25 weeks, constraining late entrants from scaling at the pace demanded by AI tenants. Combined, these factors elevate the Los Angeles data center market as an AI infrastructure linchpin for workloads bridging North America and Asia-Pacific.
Surging film-render and streaming workloads
Netflix’s cloud-native Media Production Suite handles up to 700 TB per title, eliminating physical media and requiring edge nodes close to Hollywood studios.[2]Netflix Technology Blog, “Globalizing Productions with Netflix’s Media Production Suite,” netflixtechblog.com Warner Bros. committed USD 500 million to expand 16 soundstages—proof that studio operators view local compute as indispensable. Gaming adds parallel demand; Riot Games’ esports platform moves 3.2 PB in under 30 minutes during tournament play, reinforcing latency-sensitive traffic patterns. These workflows translate into sustained power draws for edge nodes within the Los Angeles Basin.
West-Coast subsea cable landings (Hawaiki Nui, CAP-1)
The JUNO cable will deliver 350 Tbps from Japan to Los Angeles, while Southern Cross NEXT links the city directly to Sydney at 72 Tbps, both raising the metro’s value as a Pacific gateway. The municipal Trans-Pacific Telecommunications Cable Hub authorizes four additional landings at Dockweiler State Beach, ensuring long-term path diversity. Elevated east-west traffic cements the Los Angeles data center market as the principal U.S. interconnection site for Asia-bound traffic.
400 MW Southern CA utility-scale solar + BESS PPAs
The Compass Battery Energy Storage Project provides 250 MW/1,000 MWh of four-hour storage, enabling dispatchable capacity that data center operators can contract under resource-adequacy agreements. LADWP’s LA100 Plan adds 400 MW of PV and 1,200 MWh of batteries, positioning renewable PPAs as a hedge against escalating spot power costs. State microgrid incentives totaling USD 200 million further sweeten on-site generation economics, especially for suburban campuses with excess land.
Restraints Impact Analysis*
| RESTRAINTS | (~) % IMPACT ON CAGR FORECAST | GEOGRAPHIC RELEVANCE | IMPACT TIMELINE |
|---|---|---|---|
| Scarce 230 kV transmission interconnects within LA Basin | −0.6% | Los Angeles Basin, downtown core | Medium term (2–4 years) |
| Rising seismic-design CAPEX premiums (Zone 4b) | −0.4% | Seismic Zone 4b areas, LA County | Long term (≥ 4 years) |
| Lengthy LADWP and SCE power-delivery queue (48-60 months) | −0.3% | LADWP and SCE service territories | Short term (≤ 2 years) |
| Shortage of Tier IV-certified technicians and electricians | −0.2% | Regional, affecting all major metros | Medium term (2–4 years) |
| Source: Mordor Intelligence | |||
Scarce 230 kV transmission interconnects within LA Basin
California ISO lists 28.4 GW of renewable projects already delayed by transmission constraints, a backlog mirrored in data-center queue positions.[3]California ISO, “2024 Transmission Plan Deliverability Allocation Report,” caiso.com LADWP’s McCullough-Victorville upgrades add only 475 MW by 2029, insufficient for the sub-gigawatt requests lodged by hyperscale aspirants. As a result, downtown expansions depend increasingly on networked diesel or gas-turbine generators for standby megawatts, inflating capital intensity and complicating air-quality permitting.
Rising seismic-design CAPEX premiums (Zone 4b)
California Building Code Zone 4b compels base-isolation systems, viscous dampers, and heavier steel weights. Data Center Knowledge estimates seismic provisions can add 15% to downtown project budgets. Operators scale up floor plates to dilute fixed-cost premiums, which helps explain why many new bids exceed 50 MW even though the Los Angeles data center market grows slowly in net capacity.
*Our forecasts treat driver/restraint impacts as directional, not additive. The impact forecasts reflect baseline growth, mix effects, and variable interactions.
Segment Analysis
By Data Center Size: Mega-scale Drives Future Capacity
Facilities exceeding 50 MW account for the fastest-growing slice of the Los Angeles data center market, expanding at a 0.96% CAGR to 2032, although mid-range Medium deployments still led with 45.62% of 2025 installed capacity. The Los Angeles data center market size for mega-scale builds registered an incremental 60 MW in 2024 after Prime Data Centers energized its 33 MW Vernon campus, the single-largest addition of the year. Edge nodes below 5 MW persist for specialized rendering, but their aggregate footprint remains less than 5% of capacity, underscoring a bifurcated demand curve favoring either hyperscale or highly targeted micro-edge projects.
Economies of scale drive this gravitation toward larger blocks because seismic-design premiums and protracted utility queues dilute unit costs when amortized over higher IT loads. Hyperscale operators also prefer campus-style layouts that support future expansions under a single permit umbrella, mitigating the risk of interconnect moratoria. Santa Clarita Valley, once a secondary location, now attracts master-planned campuses upwards of 80 MW as land and water availability exceed what downtown parcels can provide. Consequently, the Los Angeles data center market continues to consolidate incremental megawatts into fewer, but markedly larger, footprints.


By Tier Standard: Tier IV Gains Mission-Critical Traction
Tier III remained the workhorse in 2025, holding 63.25% of Los Angeles data center market share, yet Tier IV footprints are forecast to record a 2.08% CAGR to 2032. The Los Angeles data center market size for Tier IV builds rose by 8 MW in 2024 as CoreSite brought LA2 Phase 3 online, incorporating 2N utility feeds and N+1 chilled-water plants. Sector-specific compliance—FINRA, FedRAMP, and PCI-DSS—pushes financial and healthcare tenants toward Tier IV environments where concurrent maintainability is guaranteed.
Operational headwinds remain: a regional shortage of Tier-IV-certified technicians threatens uptime SLAs, fueling premium wage inflation that outpaces national averages. Training partnerships with IBEW and the County of Los Angeles aim to alleviate the gap, but those programs will not materially boost capacity until late-2027. Despite staffing constraints, demand outstrips supply, and operators able to demonstrate 99.995% availability continue to command double-digit price premiums over Tier III equivalents.
By Absorption: Hyperscale Momentum Accelerates
Retail colocation still captured 57.65% of 2025 utilized capacity, yet hyperscale tenants are adding square footage faster, growing at 2.37% CAGR through 2032. Hyperscale demand consumed 20 MW of fresh power in 2024 alone, largely within Digital Realty and Equinix campuses that can hand over 2–5 MW suites under single-tenant models. Because Los Angeles data center market vacancy sits below 3%, pre-leasing commitments often precede construction by 18 months, reinforcing first-mover advantages for incumbents with shovel-ready expansions.
Wholesale blocks serve enterprises bridging on-premises kit with public cloud platforms, a middle-ground absorption path expected to plateau as hybrid-cloud maturity increases. Non-utilized space, meanwhile, remains minimal; speculative builds rarely remain idle longer than two quarters due to acute absorption from media rendering bursts and AI experimentation labs. Overall, hyperscale demand sets the cadence, dictating both construction schedules and power-procurement strategies across the Los Angeles data center industry.

Geography Analysis
Downtown Los Angeles continues to house 42.55% of installed capacity, a consequence of One Wilshire’s 295-network meet-me room that underpins the region’s carrier-hotel status. Yet seismic premiums, land scarcity, and 230 kV congestion are pushing new-build activity toward northern suburbs. Santa Clarita Valley leads with a projected 2.03% CAGR, underpinned by greenfield parcels conducive to multi-building campuses and adjacency to renewable corridors capable of delivering 100 MW blocks under long-term PPAs.
Urban densification persists in limited downtown parcels. Digital Realty’s planned 13-story tower at 727 S. Grand Avenue will add 480,000 sq ft of server space and leverage dual LADWP substations in a stacked-data-hall design. Such vertical builds illustrate how operators reconcile core-metro latency requirements with land constraints, albeit at elevated per-MW costs relative to single-story suburban variants.
Southern nodes like Vernon capitalize on industrial zoning and easier access to 66 kV feeders, evidenced by Prime Data Centers’ 33 MW go-live in November 2024. Meanwhile, coastal sites near Dockweiler State Beach prepare for new cable landings, adding beach-manhole real estate that could spawn micro-edge facilities tailored to subsea backhaul termination. Collectively, these geographies form a hub-and-spoke topology in which downtown remains the network core while suburban spokes absorb the bulk of incremental megawatts.
Regulatory Landscape
The Los Angeles data center market operates under a multi-layered regulatory environment that combines California energy oversight with local land-use and environmental permitting. At the state level, the California Public Utilities Commission (CPUC) and California Energy Commission (CEC) are central: SB 57 (enacted September 2025) directs the CPUC to submit a ratepayer-impact assessment of data center load growth by January 2027, while AB 1577 tasks the CEC with establishing a monthly reporting process for data center metrics such as location, capacity, and energy and water consumption. In parallel, legislative proposals introduced in 2026 (including tariff-focused bills such as SB 886 and SB 978) raise the profile of utility-rate design and disclosure requirements for large-load users.
At the local level, Los Angeles County actions can affect siting and the timing of new supply in unincorporated areas. On April 14, 2026, the Los Angeles County Board of Supervisors directed preparation of a moratorium ordinance for certain data center developments in unincorporated parts of the county, increasing the need for early entitlement strategy and community engagement. Water-use scrutiny is also tightening, with measures such as AB 2619 requiring disclosure of projected water use on business license applications. That increases the permitting burden for projects that rely on water-intensive cooling approaches, while designs that reduce potable water dependence gain additional value.
Value Chain Analysis
The Los Angeles data center value chain is anchored by interconnection assets, utility power procurement, and specialized design and construction for seismic and high-density workloads. Carrier hotels and interconnection ecosystems, led by One Wilshire in downtown Los Angeles, sit upstream of colocation and hyperscale deployments by concentrating network access, cloud on-ramps, and content distribution. This makes connectivity a primary input alongside land and power. Power sourcing and grid access are governed by local utilities, notably LADWP and Southern California Edison service territories, with procurement increasingly tied to renewable PPAs and dispatchable capacity solutions as operators manage capacity constraints and sustainability requirements.
Downstream, development and delivery depend on a mix of developers, operators, and critical equipment suppliers. Recent activity reflects partnership-led execution models, including Goodman Group providing development and site-planning capabilities while operators like DataBank lead facility operations, go-to-market, and leasing. As permitting expectations broaden, the chain increasingly includes community-benefits alignment and compliance management around energy, water, and reporting mandates. These considerations can influence site selection, such as industrial-zoned nodes like Vernon, as well as the choice of cooling and backup-power architectures needed to meet both performance targets and local approval thresholds.
Competitive Landscape
Los Angeles displays moderate consolidation; the top five operators control roughly 68% of commissioned power, placing the market at a concentration score of 6. Incumbents Equinix, Digital Realty, and CoreSite exploit legacy interconnect ecosystems and entrenched power contracts, enabling rapid sell-outs of new phases. Equinix’s xScale rollout earmarks additional Los Angeles acreage for build-to-suit hyperscale pods, while Digital Realty leverages its global 3,000 MW portfolio to cross-sell hybrid deployments.
New entrants pursue suburban parcels; Prime Data Centers’ Vernon campus and Edge Centres’ acquisition of QuadraNet exemplify this outer-ring strategy. Competitive levers pivot on securing megawatt-class renewable PPAs, deploying liquid cooling, and obtaining Tier IV certifications faster than peers constrained by labor shortages. Technology upgrades are equally decisive: operators investing in 400G-ready DWDM backbones and campus microgrids differentiate themselves when courting AI tenants.
M&A remains active. Vantage Data Centers raised USD 13 billion in January 2025 for U.S. expansion, while DataBank secured USD 2 billion to proliferate edge campuses. Private-equity appetite suggests further roll-ups, although strict earthquake codes and utility bottlenecks temper speculative over-builds, sustaining pricing discipline across the Los Angeles data center market.
Los Angeles Data Center Industry Leaders
Digital Realty Trust, Inc.
DataBank
Equinix Inc.
CoreSite
Cogent
- *Disclaimer: Major Players sorted in no particular order

Market Opportunities and Future Outlook
A key opportunity in Los Angeles is adding capacity in submarkets with clearer power pathways and industrial zoning while maintaining low-latency access to the region's interconnection core. Vernon stands out as an active development node, reinforced by multiple committed projects: DataBank and Goodman Group formed a joint venture for a 32 MW facility at 3094 E Vernon Avenue, with an initial 6 MW phase slated for December 2026 and additional phased delivery through September 2027. Digital Realty also secured a Vernon site positioned for 32 MW of IT capacity. Taken together, these moves show developers and operators using Vernon to bridge local supply constraints while staying close to downtown network density for media, AI experimentation, and cloud connectivity needs.
Another opportunity is modernization and densification inside the established downtown ecosystem, where upgrades and vertical builds can unlock incremental megawatts without relying on large greenfield interconnects. CoreSite's infrastructure work at One Wilshire (LA1) strengthens the carrier-hotel backbone that supports downtown's role in the metro, and Digital Realty's filed plan for a 13-story data center at 727 S Grand Avenue shows how stacked data halls can work when land is scarce. Across both infill and suburban builds, emerging compliance and disclosure requirements around energy and water, including state-level reporting initiatives, create whitespace for operators that can standardize auditable sustainability and consumption reporting. Pairing that with high-density, liquid-cooling-ready design supports AI-driven deployments.
Recent Industry Developments
- April 2026: DataBank and Goodman Group form a joint venture to launch a new 32MW data center at Vernon, CA (initial 6MW opening planned for December 2026; phased delivery through September 2027). The venture adds scalable LA capacity via a partnered development; strengthens local supply for AI and cloud workloads.
- November 2025: Digital Realty acquires a 5.4-acre Vernon, CA site to support 32MW of IT capacity. The Vernon site adds LA capacity flexibility and expands the companys ability to meet demand in the market.
- August 2025: CoreSite completes infrastructure upgrade at LA1 data center in One Wilshire, including a new enterprise-class generator plant. This upgrade improves reliability and readiness for high-density, latency-sensitive workloads in the Downtown LA corridor.


Research Methodology Framework and Report Scope
Market Definition and Coverage
For this study, the Los Angeles data center market covers third-party and operator-run facilities located in the Greater Los Angeles area, measured by installed and planned IT load capacity, and the supporting power and space that enable that capacity.
Scope exclusions: Enterprise server rooms inside single-tenant offices and non-data-center telecom closets are excluded unless they operate as commercially available colocation or carrier hotel capacity.
Segmentation Overview
- By Data Center Size
- Small
- Medium
- Large
- Hyperscale
- By Tier Standard
- Tier I and II
- Tier III
- Tier IV
- By Absorption
- Non-Utilised
- Utilised
- By Colocation Type
- Retail
- Wholesale
- By End-User Industry
- Cloud Service Providers
- Media and Entertainment
- Manufacturing
- Telecom
- BFSI
- E-commerce
- Government
- Other End User
- By Colocation Type
Data Sources, Market Sizing, and Validation
Desk Research
Desk work starts by mapping what is physically buildable and powerable in Los Angeles, since capacity is the limiting factor in this market. We use public sources such as U.S. Energy Information Administration electricity data, Federal Energy Regulatory Commission filings, California Energy Commission publications, and U.S. Census and Bureau of Labor Statistics series to ground local growth context.
We then add cross-checks from sources such as City of Los Angeles and LA County planning documents, utility and interconnection related public notices, and industry standards bodies and peer-reviewed research on data center energy use and cooling. To connect these items, we also review company filings, investor presentations, reputable press coverage, and selectively use paid subscriptions for company financials and intelligence, news and financials, patent databases, and a contracts and tenders database when public disclosures are thin. The examples listed here are illustrative only, and many other sources were used for collection, validation, and clarification.
Primary Interviews and Surveys
Primary work focuses on confirming what is actually deliverable in the next few years in Los Angeles, which can differ from early project announcements. We interview and survey operators, colocation buyers, engineering and construction specialists, and energy and connectivity stakeholders across the metro, and then use their inputs to tighten assumptions on power availability, delivery timelines, and realistic phasing.
Distribution of primary research fieldwork respondents
| Company type | Respondent position | Region |
|---|---|---|
| Top tier: 29% | CXOs: 12% | APAC: 39% |
| Mid tier: 56% | Functional/Unit leaders: 32% | EMEA: 36% |
| Smaller Players: 15% | Managers: 56% | Americas: 25% |
Market-Sizing & Forecasting
Sizing is built using a top-down approach where capacity and demand are reconstructed from the local inventory base, live pipeline status, and the power that can be contracted and delivered within typical development timelines. Once the demand pool is formed, results are checked with selective bottom-up approximations using sampled rack and cage pricing, leased MW ranges discussed in channel checks, and a roll-up of a few visible facility expansions to keep totals realistic.
Key inputs used in the model include commissioned and under-construction MW, announced versus permitted project status, utility power delivery lead times, vacancy and absorption direction, and typical power density and cooling design choices used in the area (which affect how much white space converts into sellable IT load). Where bottom-up signals are missing for a sub-area or facility type, we fill the gap using conservative utilization and phasing ranges that were validated in interviews.
Forecasting uses scenario analysis supported by trend smoothing on the capacity pipeline, since step-changes are driven by permitting and power milestones rather than steady year-on-year additions. The final forecast is selected after expert feedback aligns on the most probable timing for energization and stabilization of new capacity.
Data Validation & Update Cycle
Outputs are validated through triangulation across independent signals, including capacity pipeline progress, lease activity direction, and power-related constraints that can be verified through public filings or operator commentary. Variance checks are run when the modeled MW or growth rate moves away from what local demand indicators imply, and then assumptions are revisited before sign-off.
A multi-step internal review is followed so definitions, unit consistency, and year mapping are kept clean, and re-contact is triggered when new builds shift status or power delivery timelines change. Reports are refreshed annually, with interim updates when material events occur, and a final pre-delivery pass is completed so clients receive the latest updated view.
Mordor Intelligence's Los Angeles Data Center Market Size Versus Other Published Estimates
Published figures for the Los Angeles data center market often do not line up because they use different units, different geographies, and different points in the build cycle. Some sources present figures in dollars, others in MW, and a few mix planned capacity with commissioned capacity, which can change the picture quickly.
The main gap comes from counting pipeline capacity as if it is already live, while Mordor Intelligence keeps the estimate tied to MW that is commissioned (and then adds under-construction capacity only when timing and delivery are supported by permitting and power availability checks). Differences also come from whether adjacent Southern California hubs are bundled into Los Angeles, how vacancy and absorption are interpreted for forward years, and whether currency and inflation assumptions are applied to convert capacity into a value-based view.
Benchmark comparison
| Source | Market Size | Gaps in Research Methodology |
|---|---|---|
| Mordor Intelligence | USD 0.78 B (2025) | |
| Real Estate Analytics A | USD 0.92 B (2025) | Often translates regional leasing and rent signals into a value number and can treat broader Southern California inventory as Los Angeles, which inflates totals when neighboring submarkets are added. |
| Industry Briefing B | USD 0.64 B (2024) | Commonly uses a conservative case based on near-term absorption and may exclude a portion of under-construction capacity until it is fully stabilized, which pulls down the reported figure. |
Taken together, the spread is mostly explained by what is counted as Los Angeles and when capacity is recognized as usable supply. By keeping the scope rules explicit and tying assumptions back to MW delivery and leasing reality, the estimate remains traceable to clear inputs and can be repeated as conditions change.


Key Questions Answered in the Report
How large is the Los Angeles data center market in 2026?
Installed capacity is 778.6 MW, edging toward 791.29 MW by 2032 at a 0.27% CAGR.
Which sub-market is growing fastest in Los Angeles?
Santa Clarita Valley leads with a projected 2.03% CAGR through 2032, thanks to land availability and renewable-energy proximity.
What segment commands the largest share of capacity?
2050 MW facilities hold 45.62% of installed capacity, making mid-range deployments the dominant footprint.
Why are Tier IV facilities gaining traction?
AI, BFSI, and healthcare workloads demand 99.995% uptime, pushing Tier IV capacity to a forecast 2.08% CAGR through 2032.
How does AI affect new data-center builds in Los Angeles?
AI workloads require liquid cooling and > 50 kW rack densities, accelerating hyperscale demand and lengthening equipment lead times.
What regulatory factors most constrain expansion?
Scarcity of 230 kV interconnects and LADWP power-delivery queues of up to 60 months delay greenfield projects inside the Los Angeles Basin.
Page last updated on:






