
London Data Center Market Size and Share
Market Overview
| Study Period | 2020 - 2031 |
|---|---|
| Forecast Data Period | 2026 - 2031 |
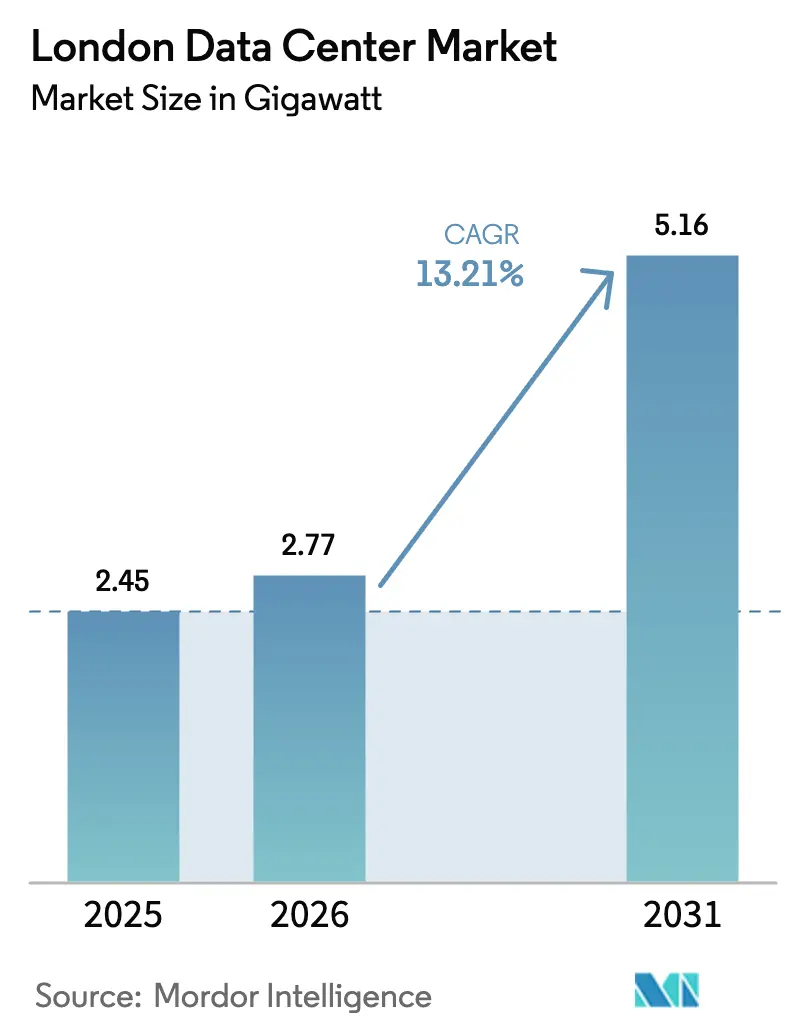
| Base Year Market Size (2025) | 2.45 gigawatt |
| Market Volume (2026) | 2.77 gigawatt |
| Market Volume (2031) | 5.16 gigawatt |
| Growth Rate (2026 - 2031) | 13.21% CAGR |
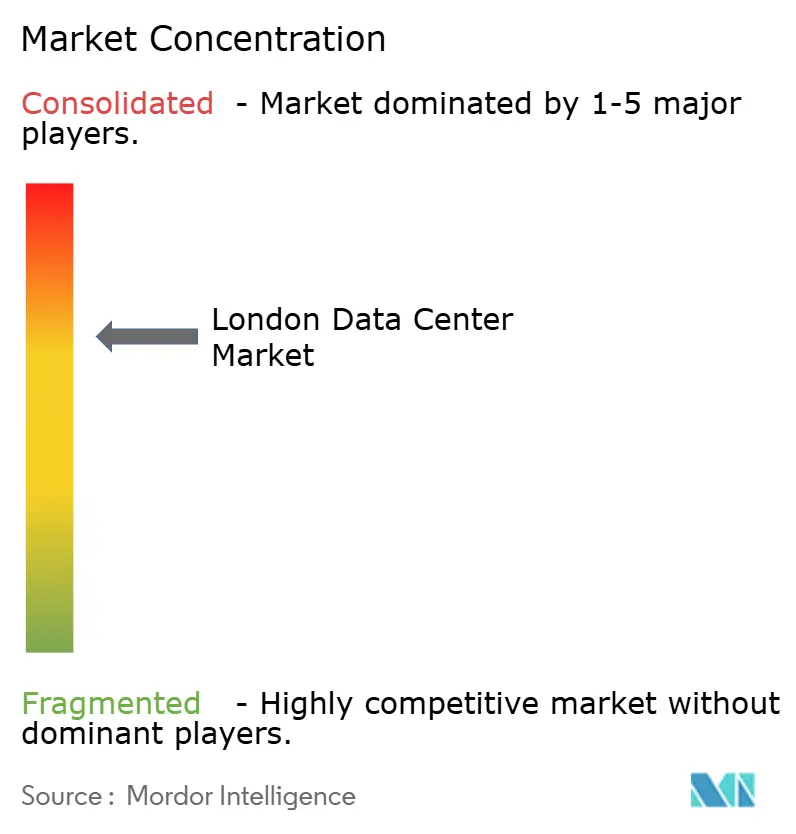
| Market Concentration | Medium |
Major Players *Disclaimer: Major Players sorted in no particular order Image © Mordor Intelligence. Reuse requires attribution under CC BY 4.0. | |
London Data Center Market Analysis by Mordor Intelligence
London data center market size in 2026 is estimated at 2.77 GW, growing from 2025 value of 2.45 GW with 2031 projections showing 5.16 GW, growing at 13.21% CAGR over 2026-2031. Growth is propelled by hyperscaler demand for AI-ready capacity, sustained enterprise migration to hybrid architectures, and London’s unmatched global connectivity. Operators are redesigning facilities to support 40-140 kW rack densities, embracing liquid and river-water cooling, and adopting 24/7 carbon-free power procurement. Intensifying grid constraints in West London have nudged new builds eastward, while the UK government’s AI Growth Zones and Critical National Infrastructure designation create a clearer policy runway. Market participants are now balancing soaring AI-driven power requirements against tightening energy-efficiency mandates, catalyzing investments in renewable PPAs, district-cooling schemes, and waste-heat recovery. Competitive pressure remains sharp as Equinix, Digital Realty, and NTT protect incumbency, yet agile specialists such as Kao Data capture premium AI workloads.
Key Report Takeaways
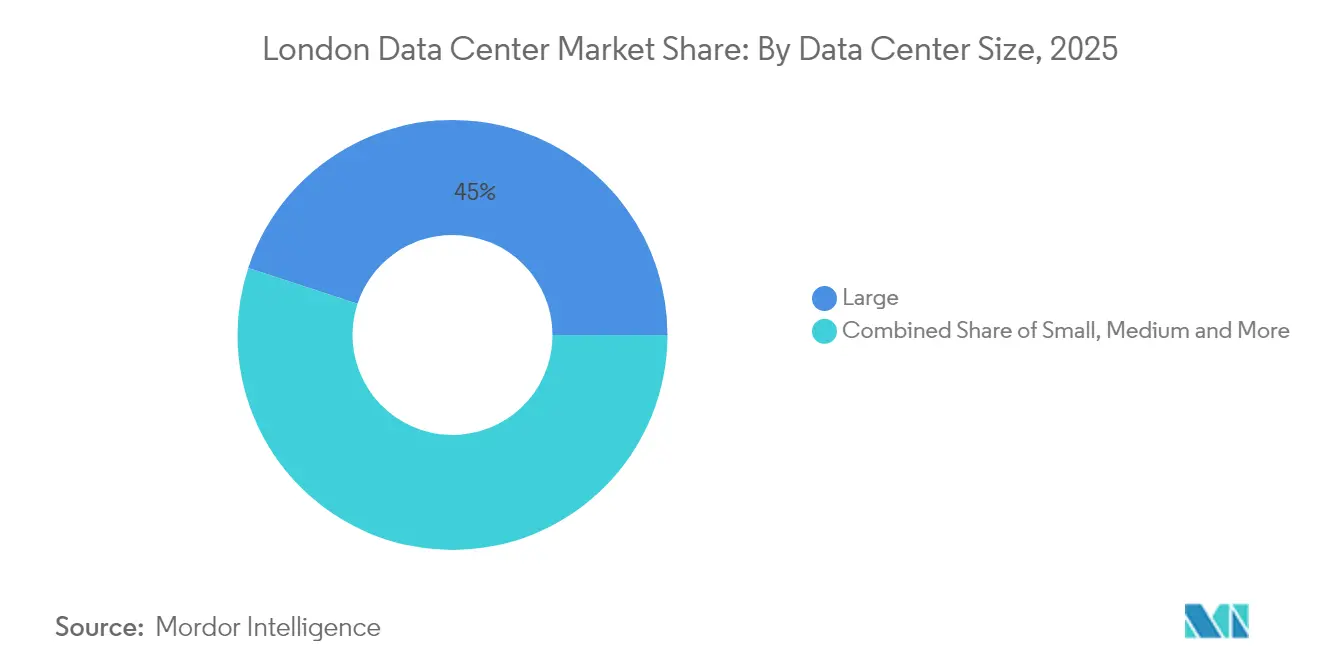
- By data-center size, Large facilities (10-20 MW) led with 44.95% of London data center market share in 2025, while Mega facilities (>40 MW) are poised for the fastest 27.60% CAGR through 2031.
- By tier type, Tier 3 sites held 84.35% revenue share in 2025; Tier 4 is projected to expand at 36.10% CAGR, the quickest among all tiers.
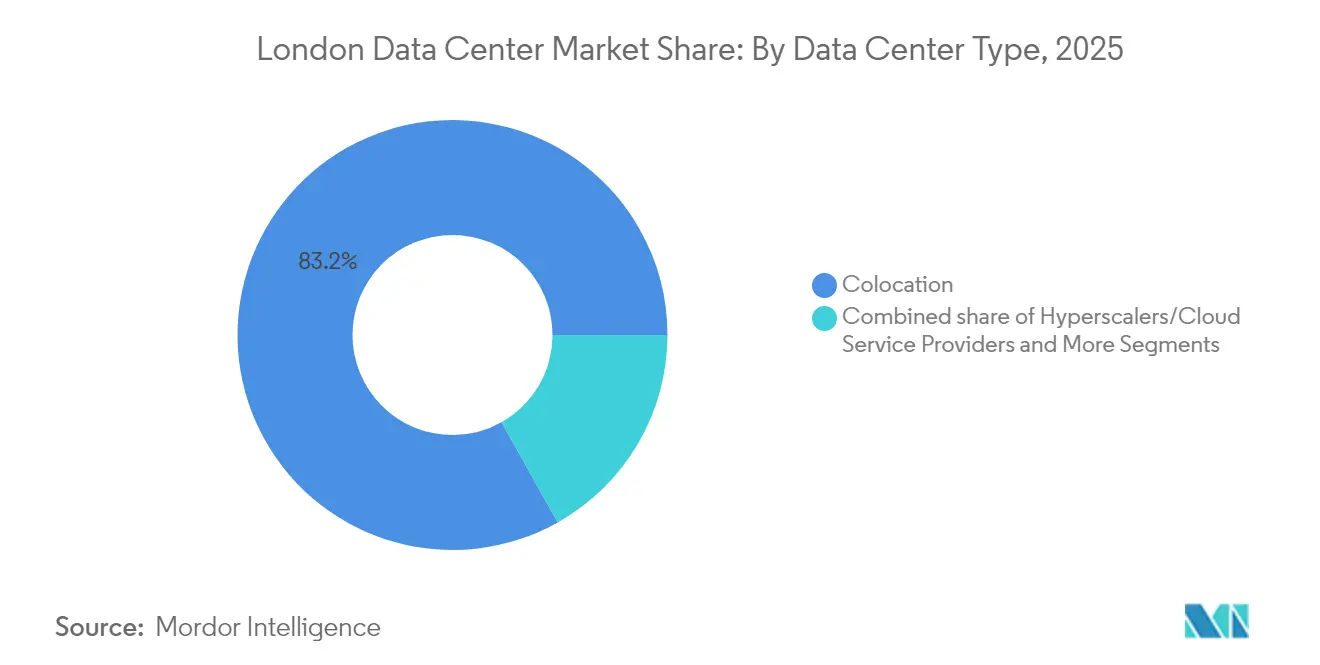
- By facility type, colocation captured 83.15% share of the London data center market in 2025; hyperscalers are projected to record a 14.55% CAGR to 2031.
- By end user, cloud & IT services commanded 22.10% of the London data center market size in 2025; government workloads exhibit the highest 22.40% CAGR outlook.
- By geography, West London retained close to half of installed capacity in 2025, but East London is forecast to outpace at 18.95% CAGR on new power availability.
- Equinix, Digital Realty, and NTT collectively controlled more than 44.20% of the London data center market size in 2025.
Note: Market size and forecast figures in this report are generated using Mordor Intelligence’s proprietary estimation framework, updated with the latest available data and insights as of 2026.
London Data Center Market Trends and Insights
Drivers Impact Analysis*
| Driver | (~) % Impact on CAGR Forecast | Geographic Relevance | Impact Timeline |
|---|---|---|---|
| Hyperscaler cloud expansion demand | +5.2% | Slough, Docklands, East London | Medium term (2-4 years) |
| AI / GPU-driven high-density compute requirements | +4.8% | Financial district, wider metropolitan area | Medium term (2-4 years) |
| Sub-sea cable and metro-fiber ecosystem depth | +1.8% | London core and adjacent counties | Long term (≥ 4 years) |
| Renewable-energy PPAs and net-zero mandates | +1.3% | UK-wide with London as early adopter | Long term (≥ 4 years) |
| London Underground fiber right-of-way for edge DCs | +0.6% | Central city extending to outer zones | Medium term (2-4 years) |
| Thames River district-cooling schemes | +0.4% | Docklands and riverside developments | Medium term (2-4 years) |
| Source: Mordor Intelligence | |||
Hyperscaler Cloud Expansion Driving Market Growth
Hyperscalers continue to underwrite the London data center market, committing multi-billion-pound budgets to AI-ready builds and retrofit programs. January 2025 saw a UK government announcement of GBP 14 billion in data-center projects aimed at AI infrastructure, redirecting new capacity toward designated AI Growth Zones. CoreWeave’s GBP 1 billion entry underscores the capital depth backing GPU-accelerated environments. Slough’s historic dominance is waning as power caps squeeze new requests; Ada Infrastructure’s 210 MW Royal Docks campus illustrates the eastward realignment. Community benefit packages—on-site skills academies, public green space, and district-heating interfaces—have become standard as developers secure faster approvals.
AI-Driven Compute Density Transforming Facility Design
The arrival of 40-140 kW racks has reset design norms across the London data center market. Kao Data’s deployment of Nvidia H200 GPUs in March 2025 demonstrated the operational leap, integrating closed-loop rear-door heat exchangers and 100% renewable energy feeds. Power draw per AI server now runs 4-5 times that of legacy workloads, forcing new revenue models that blend power, space, and cooling metrics. Financial-services tenants—whose algorithmic trading and risk simulations thrive on GPU clusters—accept higher colocation rates in exchange for latency-sensitive compute near the City. Facility blueprints increasingly adopt slab-to-slab clear heights above 6 m, dual 132 kV feeds, and modular cooling blocks that can swing from air-to-liquid without extended downtime.
Sub-sea Cable Ecosystem Enhancing London’s Connectivity Value
Low-latency trans-Atlantic links remain a marquee lure for the London data center market. Equinix’s LD4 and LD5 nodes in Slough anchor the Hibernia Express cable, sustaining sub-59 ms round-trip latency to New York, critical for high-frequency trading.[1]Equinix, “London Data Centers | Premium Colocation Provider and Internet Exchange Point,” equinix.com Hyperscalers’ direct ownership of new cables is reshaping carrier economics, routing fresh landings to purpose-built hyperscale campuses. This vertical integration deepens London’s role as a cloud region while heightening physical-security diligence; industry consortia have urged new European standards for cable protection, reflecting concerns over geopolitical disruption.
Renewable Energy PPAs Becoming Operational Imperative
For operators competing on ESG credentials, 24/7 carbon-free supply has replaced annual RECs. Kao Data’s Harlow campus exemplifies the shift, locking multi-year renewable PPAs that track hourly consumption. UK policy revisions tightening minimum energy-performance benchmarks spur similar commitments across the London data center market. Sophisticated energy-management software now arbitrages grid, battery, and onsite generation in real time, smoothing volatility from offshore wind. District-heating exports, such as Queen Mary University’s January 2025 heat-reuse rollout, demonstrate monetizable sustainability pathways.[2]UK Government, “Thousands of homes to be kept warm by waste heat from computer data centres in UK first,” gov.uk
Restraints Impact Analysis*
| Restraint | (~) % Impact on CAGR Forecast | Geographic Relevance | Impact Timeline |
|---|---|---|---|
| Grid-power allocation shortages in West London | -2.1% | Ealing, Hillingdon, Hounslow | Short term (≤ 2 years) |
| High land and business-rate costs + planning delays | -1.4% | Greater London, acutest in central zones | Medium term (2-4 years) |
| Waste-heat reuse obligations tightening CAPEX | -0.9% | City-wide with priority on new builds | Medium term (2-4 years) |
| HV commissioning-engineer scarcity | -0.5% | London-wide | Short term (≤ 2 years) |
| Source: Mordor Intelligence | |||
Grid-Power Allocation Creating Critical Development Bottleneck
Pending grid requests topping 400 GW in West London have triggered a pause on new connections, compelling developers to fund sub-station upgrades or migrate projects east of the city.[3]Greater London Authority, “West London Electricity Capacity Constraints,” london.gov.uk Some proposals have been rejected outright on power-availability grounds, pushing operators toward hybrid on-site generation and battery solutions. Government deliberations on connection-queue reform and vessel-to-grid pilots on the Thames hint at near-term relief, yet risk persists for schemes banking on 100 MW-plus blocks in constrained boroughs.
High Land Costs and Planning Complexities Impeding Growth
Land in Slough, Docklands, and Central London ranks among Europe’s most expensive parcels, elevating entry thresholds for new players. A more rigorous planning environment further elongates timelines; local councils now insist on clear community benefits and demonstrable emissions reductions. The national reclassification of data centers as significant infrastructure promises streamlined approvals above 50 MW, but smaller schemes still navigate borough-specific variances. Savvy developers now embed pre-application community sessions and transparent sustainability dashboards to secure buy-in.
*Our forecasts treat driver/restraint impacts as directional, not additive. The impact forecasts reflect baseline growth, mix effects, and variable interactions.
Segment Analysis
By Data Center Size: Mega facilities capturing AI-driven growth
Large sites between 10 MW and 20 MW led capacity in 2025, contributing 44.95% to the London data center market. The dominance reflected their sweet spot in balancing build costs and proximity to key fiber routes. Momentum is shifting, however, toward Mega campuses exceeding 40 MW, projected to gallop ahead at a 27.60% CAGR between 2026 and 2031. Ada Infrastructure’s 210 MW Royal Docks project illustrates the blueprint: three 70 MW halls configured for liquid-cooled GPU clusters and supplemented by district-cooling tie-ins. Such projects exploit economies of scale in power procurement and on-site sub-station build-outs, giving operators tariff leverage with distribution network operators. Smaller facilities under 5 MW are repurposed into edge nodes that trim latency for IoT and fintech applications, extending the London data center market footprint into suburban exchange buildings and underground fiber vaults.
The growth trajectory reinforces consolidation pressures. Mega campus investors bundle multiple data halls into a single planning envelope, reducing per-MW capital expenditure and shortening time-to-revenue. Enterprises gravitate toward these scale facilities for predictable expansion paths and richer interconnection fabrics. Conversely, medium-sized assets now face capex upgrades to chase rising rack densities. Operators unable to retrofit to 30 kW racks may see occupancy taper as AI workloads bypass them, driving mergers or asset sales. The London data center market size for Mega facilities is forecast to double, lifting their revenue contribution above one-third of the total by decade’s end.


By Tier Type: Tier 4 facilities surging on resilience demands
Tier 3 halls supplied 84.35% of the London data center market in 2025, valued for concurrent maintainability and cost discipline. Yet Tier 4 facilities, while a niche today, are racing ahead at 36.10% CAGR through 2031 as AI model-training jobs, financial clearing, and regulated workloads seek fault tolerance. Tier 4’s 99.99% uptime and 2N+1 redundancy shield high-value computations from costly resets—outages can erase days of training cycles or stall multi-billion-pound trades. Operators price Tier 4 footprints at a 25-40% premium over Tier 3; demand still outstrips supply, signaling headroom for new greenfield builds.
Regulation tightens the narrative. The EU’s Digital Operational Resilience Act pushes financial entities toward demonstrable infrastructure redundancy, channelling fresh requirements into London data center market contracts. Some hyperscalers are blending Tiers—hosting latency-sensitive front ends in Tier 4 zones and relegating batch processing to Tier 3 wings within the same campus. Over time, hybrid architectures could erode the stark pricing differentials, but for now, Tier 4 remains the favoured badge for mission-critical deployments.
By Data Center Type: Hyperscalers driving next wave of expansion
Colocation retained an 83.15% share of the London data center market in 2025, answering enterprises’ appetite for elasticity without capex burden. Within colocation, hyperscale-focused formats held 41.60%, themselves advancing at 23.90% CAGR. Parallel to this, hyperscalers’ self-built campuses are projected to outstrip every other archetype at 14.55% CAGR, reflecting surging AI inference and sovereign-cloud workloads. Sovereign requirements from UK public-sector agencies favour in-country zones, attracting AWS, Microsoft, and Google to earmark land for dual-region availability pairs.
Edge-compute footprints grow incrementally as 5G rollouts press latency expectations below 5 ms for fintech and augmented-reality use cases. Small carrier-neutral sites inside Tube stations and roadside cabinets emerge as new endpoints. Meanwhile, enterprise-owned on-premises suites decline, with CFOs reallocating budgets toward cloud architectures and GPU-as-a-service consumption. The London data center industry thus migrates toward a tri-layer stack—mega-scale cores, suburban edge pods, and metro micro-nodes—each commanding its own economics and power-density profile.
Geography Analysis
West London’s historic cluster, anchored by Slough Trading Estate, still hosts nearly half of installed capacity in the London data center market. Superior fiber routes to the City and primary liquidity venues made it the early default for colocation builds. Yet grid-power caps have frozen large new connections, and available land now trades at premium rates. Developers report lead times surpassing 60 months for 100 MW sub-station slots, prompting some operators to pivot expansions north toward Hemel Hempstead or Reading where grid headroom persists.
East London’s Royal Docks district is rapidly emerging as the new powerhouse. Ada Infrastructure’s 210 MW campus has become the bellwether, validated by planning approval that integrated community skills hubs and river-water cooling. Proximity to Docklands fiber paths maintains the low-latency link cherished by financial services; relative land affordability underpins project economics. Over the next five years, East London’s share of the London data center market size is projected to climb from single digits to mid-teens, lifting overall capacity resilience for the metro.
The Docklands area itself, despite spatial constraints, remains London’s interconnection heart, home to the London Internet Exchange. Telehouse is expanding legacy sites vertically, employing multi-story data halls and direct-to-chip liquid cooling to unlock incremental megawatts. Peripheral towns beyond the M25—such as Basingstoke and Didcot—now court hyperscale builds, bundling renewable-energy proximity and quicker grid hookups. This geographic dispersion ensures the London data center market retains growth momentum even as core boroughs face planning headwinds.
Regulatory Landscape
UK policy has elevated data centers as a strategic asset, changing how large London projects are consented, governed, and secured. Data centers were designated as Critical National Infrastructure in September 2024, increasing scrutiny around physical and cyber resilience. The UK Cyber Security and Resilience (Network and Information Systems) Bill also treats data centers as essential services, with Ofcom positioned as the operational regulator, which raises compliance expectations for operators serving cloud, financial-services, and public-sector workloads.
Planning and power-connection policy are also shifting in ways that affect site selection across Greater London. Reforms to the National Planning Policy Framework in December 2024 require local authorities to consider the need for data centers, while the option to use the Nationally Significant Infrastructure Projects (NSIP) regime creates a route for nationally significant schemes to move beyond borough-by-borough planning constraints. On the energy side, Ofgem and the Department for Energy Security and Net Zero (DESNZ) are progressing grid-connection reforms aimed at prioritizing strategically significant demand, a key lever as West London faces material connection constraints.
Value Chain Analysis
The London data center value chain starts with land acquisition and planning, then moves through grid connection and high-voltage design, construction and commissioning, and finally operations anchored by interconnection and managed services. Major campus operators such as Equinix and Telehouse (KDDI) sit at the center of the ecosystem, aggregating tenants, carriers, and cloud on-ramps, while utilities and network operators influence timelines through connection offers and substation readiness. The Docklands cluster illustrates how land and power shape the chain: Telehouse is developing its 33 MW Telehouse West Two facility at its London Docklands campus (target completion 2028), and it has also pursued adjacent, consented expansion land, reflecting how scarce, pre-entitled sites can compress delivery risk.
Upstream suppliers increasingly differentiate on high-density readiness, including liquid cooling components, modular electrical rooms, and lower-carbon backup-generation approaches such as HVO-capable gensets, as rack densities move toward 100 kW-class deployments in AI-focused halls. Standards and frameworks shape procurement and customer acceptance, including BS EN 50600 for data center facilities and ISO 27001 for information security management, along with cooling and building-performance guidance used by engineers and operators in the UK market. Delivery partners span engineering and construction specialists, commissioning providers, and OEMs for power and thermal infrastructure, while operator-led innovation labs and retrofit programs influence what becomes standard in new London builds.
Competitive Landscape
Equinix, Digital Realty, and NTT hold dominant interconnected campuses and collectively exceed 45% of installed MW, giving the London data center market a moderate concentration profile. Equinix leverages its neutral interconnection fabric, drawing cloud-on-ramp demand from financial and media firms. Digital Realty’s July 2024 Slough acquisition advanced its metro footprint to 14 facilities, boosting cross-campus capacity planning. NTT’s May 2025 land purchase for LON2 signals a continued multi-GW global expansion plan that positions London as its EMEA flagship.
Niche specialists add competitive nuance. Kao Data’s AI-optimized campus became the first UK site to host Nvidia H200 GPUs, winning workloads with tailored liquid-cooling and 100% renewable supply. Telehouse reinforces its position by anchoring subsea routes and maintaining sub-5 ms metro round-trips, a critical feature for financial exchanges.
Sustainability is now a visible battleground. Operators publish hourly carbon-intensity dashboards and commit to heat-reuse partnerships with municipal housing. Early movers secure planning goodwill and long-term PPAs at favourable tariffs, differentiating beyond megawatt scale alone. With capital inflows chasing AI capacity and policy tightening around emissions, consolidation may accelerate, especially for mid-tier players lacking liquidity for efficiency retrofits.
London Data Center Industry Leaders
Equinix, Inc.
Digital Realty Trust, Inc.
Telehouse (KDDI)
Global Switch
VIRTUS Data Centres
- *Disclaimer: Major Players sorted in no particular order

Market Opportunities and Future Outlook
Power-constrained planning zones and the move toward AI-grade densities are widening whitespace for developments that bundle grid solutions, high-density cooling, and compliance-grade resilience into a single package. Government-backed AI Growth Zones offer a named framework for faster planning and potential electricity price support, aligning public policy with hyperscaler and colocation investment requirements. Alongside that, the market is opening around grid flexibility: ongoing demand-connection reforms led by Ofgem and DESNZ create a clearer route for large loads to participate in flexibility and capacity mechanisms, supporting business models that pair data halls with batteries and active energy management where connection lead times are long.
Recent investment and facility moves also show where operators are concentrating capital and delivery capability around London. Equinix announced a GBP 3.9 billion UK investment plan tied to critical national infrastructure, including a Hertfordshire project targeting more than 250 MW of capacity, reinforcing a corridor approach for sovereign and AI workloads. In Docklands, Telehouse is advancing new build capacity (Telehouse West Two at 33 MW) alongside fossil-fuel-free retrofit activity, which creates ongoing demand for partners involved in liquid-cooling integration, heat reuse interfaces, and retrofit engineering. Developers with consented land, scalable 132 kV designs, and proven community-benefit packages are positioned to convert demand into deliverable megawatts as local planning and grid constraints continue to shape feasibility.
Recent Industry Developments
- July 2026: Telehouse officially opened its Telehouse South data center, located at Blackwall Yard in the London Docklands, which represents a total investment of £223 million once fully developed. The London Docklands expansion adds new capacity in the data-center hub and strengthens interconnection options for tenants. The completion augments Telehouse's footprint and enables AI and enterprise workloads through upgraded connectivity and capacity.
- June 2026: Equinix announced expansions of its existing LD7 and LD8 data center sites in the London metro area. The expansions increase London capacity for hyperscalers and improve interconnection options. The move boosts AI-ready capacity and cements Equinix leadership through accelerated build-out near London core.
- May 2026: Digital Realty launched a 100 sqm liquid cooling lab at its LHR19 (Cloud House West) data center in London's Docklands, capable of supporting densities of 150kW or more. The high density cooling innovation strengthens London's ability to host high-performance AI workloads. This reinforces Digital Realty's premium London presence and enables more power-intensive workloads.


Research Methodology Framework and Report Scope
Market Definition and Coverage
For this methodology, the London data center market is defined as third party and enterprise data center capacity available in the London metro area, captured as installed and planned IT load (MW) that supports colocation, cloud, and managed hosting workloads.
Scope exclusions: This sizing excludes end user IT spending such as servers and software, telecom network services, and pure office IT rooms that are not run as dedicated data center facilities.
Segmentation Overview
- By Data Center Size
- Small
- Medium
- Large
- Massive
- Mega
- By Tier Type
- Tier 1 and 2
- Tier 3
- Tier 4
- By Data Center Type
- Hyperscalers/Cloud Service Providers
- Enterprise and Edge
- Colocation
- Utilized
- Colocation Type
- Retail
- Wholesale
- Hyperscale
- End User
- Cloud and IT
- Telecom
- Media and Entertainment
- Government
- BFSI
- Manufacturing
- E-Commerce
- Other End User
- Colocation Type
- Utilized
- Non-Utilized
Data Sources, Market Sizing, and Validation
Desk Research
Desk research was used to set the starting structure for the model and align definitions before we spoke with industry participants. We relied on public datasets and rulebooks that influence build outs and operations in London, such as planning policy publications, grid connection updates, and sustainability reporting practices.
On the data side, we reviewed non paywalled sources such as UK government releases (including DCMS and ONS where relevant), Ofgem and National Grid ESO publications for power and connection signals, local planning portals for major development cues, and industry bodies such as TechUK and Uptime Institute for operational benchmark direction. We also used company filings, investor presentations, reputable press, and, where needed, paid databases for company financials, patent checks, and shipment level import export patterns on critical equipment. These examples are not exhaustive, and many other sources were also used for collection, cross checks, and clarification.
Primary Interviews and Surveys
Primary work focused on validating what the desk sources could not fully explain, mainly the split between delivered IT load, reserved power, and capacity that is still stuck in planning or grid queues. We spoke with operators, engineering and construction stakeholders, energy and real estate specialists, and larger customer groups that actively procure London capacity, then used their inputs to stress test utilization, ramp timelines, and realistic density assumptions across key zones.
Because this is a city level market, the interviews still covered demand drivers shaped by global customers, and the key checks focused on pre lease behavior, expansion triggers, and the pricing premium linked to power availability and network interconnect.
Distribution of primary research fieldwork respondents
| Company type | Respondent position | Region |
|---|---|---|
| Top tier: 36% | CXOs: 13% | APAC: 50% |
| Mid tier: 49% | Functional/Unit leaders: 38% | EMEA: 30% |
| Smaller Players: 15% | Managers: 49% | Americas: 20% |
Market-Sizing & Forecasting
The market was built using a top down capacity reconstruction, where site level IT load additions were tied back to the London build pipeline and then filtered through commissioning timelines and expected ramp to reach usable capacity each year. To keep the totals realistic, the output was corroborated with selective bottom up checks such as sampled site counts by zone, observed MW per facility ranges, and price per kW signals discussed during channel calls, which were then used to adjust outliers.
Key inputs included (illustrative) installed and announced IT load in MW, committed power availability and grid connection timelines, typical rack density shifts driven by workload changes, average utilization and take up patterns, and the pace of new campus delivery versus retrofit expansions. Forecasts were developed using scenario analysis because power access, planning approvals, and customer pre leasing can change in steps rather than in a smooth line, and the scenario weights were aligned to expert views gathered during primary work. Where bottom up data had gaps, conservative fill rates were applied and later replaced when confirmations were obtained from follow up calls or updated public disclosures.
Data Validation & Update Cycle
Validation was done by checking model outputs against independent signals such as announced MW by major campus clusters, published take up indicators, and power system constraints that limit how quickly new capacity can come online. If a facility level input created an unusual jump, it was reviewed for double counting between planned, under construction, and commissioned capacity before it was accepted.
A multi step review is followed, starting with peer checks on assumptions, followed by a manager review of totals and growth rates, and then a final pass to ensure definitions and units are consistent. Reports are refreshed annually, and interim updates are made when material events occur, such as major planning approvals, new power connection policies, or large capacity pre leases. Before delivery, an analyst performs a fresh update sweep so clients receive the latest view available at that time.
Mordor Intelligence's London Data Center Market Size Versus Other Published Estimates
Published numbers for the London data center market can look far apart because the scope is not always treated the same way, and some sources size by capacity while others mix in revenue or construction spending. Differences also come from how each estimate treats planned sites, how fast utilization is assumed to ramp, and how currency timing is handled when pricing inputs are converted.
The main gap comes from whether pipeline MW sitting in planning or grid queues is counted as part of the current market, where Mordor Intelligence keeps the core market number tied to installed IT load and only moves capacity forward as commissioning milestones and ramp assumptions are met.
Benchmark comparison
| Source | Market Size | Gaps in Research Methodology |
|---|---|---|
| Mordor Intelligence | USD 2.45 B (2025) | |
| Trade Journal A | USD 1.30 B (2024) | Often reports an IT capacity snapshot for London and nearby areas, and it can blend in MW that is still in development, which makes year matching and delivered capacity tracking less consistent. |
| Regional Consultancy B | USD 1.10 B (2024) | May narrow the geography to a smaller cluster definition and assume a slower ramp in utilization due to power constraints, which pulls down the implied market value for the same calendar year. |
The spread in the table is largely explained by timing and what stage of capacity is treated as active supply. By keeping the sizing steps explicit (delivered MW, ramp behavior, and cross checks against power and build signals), the final number stays traceable and can be repeated when new sites are commissioned or delayed.


Key Questions Answered in the Report
What is the current size of the London data center market?
The London data center market stands at 2.77 GW of installed IT power in 2026.
How fast is the London data center market expected to grow?
Capacity is projected to advance to 5.16 GW by 2031, translating to a 13.21% CAGR.
Why are Mega data centers gaining prominence in London?
AI workloads demand high rack densities and economies of scale, propelling Mega campuses (>40 MW) toward a 27.60% CAGR-the quickest among all size categories.
Which geographic area of London is attracting new data center investments?
East London’s Royal Docks is emerging as the preferred zone thanks to better grid access and lower land costs, exemplified by Ada Infrastructure’s 210 MW campus.
How are operators addressing power-grid constraints in West London?
Strategies include relocating builds eastward, funding sub-station upgrades, exploring vessel-to-grid battery projects on the Thames, and signing renewable-energy PPAs.
What regulatory trend most affects new data-center builds in London?
Tighter energy-efficiency and 24/7 carbon-free requirements are reshaping facility design and siting decisions, making sustainability credentials crucial for planning approval.
Page last updated on:






