
Logic IC (Integrated Circuit) Market Size and Share
Market Overview
| Study Period | 2020 - 2031 |
|---|---|
| Market Size (2026) | USD 254.58 Billion |
| Market Size (2031) | USD 303.91 Billion |
| Growth Rate (2026 - 2031) | 3.60 % |
| Fastest Growing Market | Asia-Pacific |
| Largest Market | Asia-Pacific |
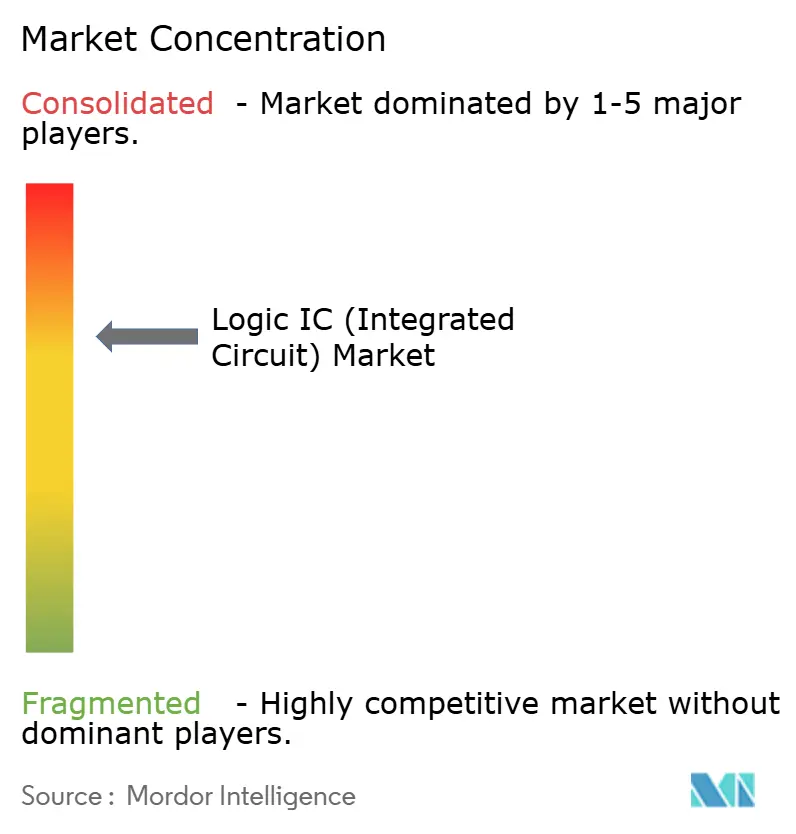
| Market Concentration | Medium |
Major Players
*Disclaimer: Major Players sorted in no particular order Image © Mordor Intelligence. Reuse requires attribution under CC BY 4.0. |
|
Logic IC (Integrated Circuit) Market Analysis by Mordor Intelligence
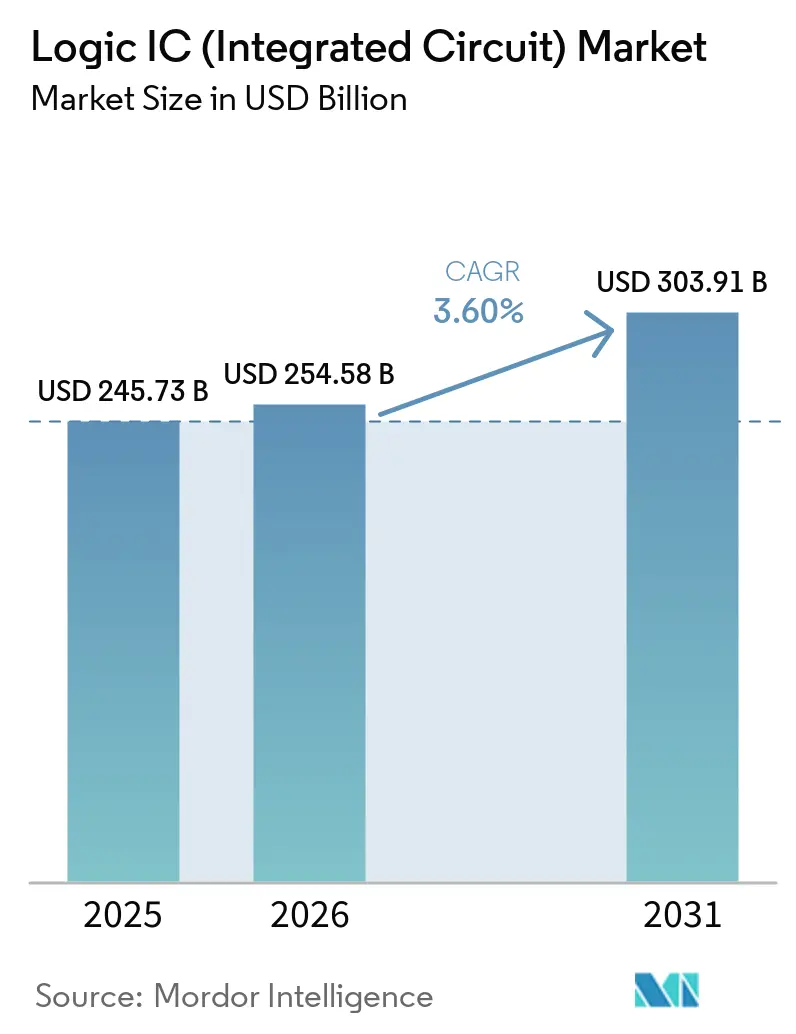
The logic IC market size was valued at USD 245.73 billion in 2025 and estimated to grow from USD 254.58 billion in 2026 to reach USD 303.91 billion by 2031, at a CAGR of 3.60% during the forecast period (2026-2031). Volume growth running ahead of revenue pointed to a deflationary trend on mature nodes, even as wafer prices at ≤5 nm surpassed historical peaks. Edge-AI inference, automotive domain controllers, and heterogeneous chiplet packaging jointly reshaped the logic IC market by redirecting investment toward ultra-low-latency designs, reliability enhancements, and advanced packaging capacity. Geographic concentration around Asia-Pacific remained a double-edged sword: the region provided the lowest die cost yet exposed supply chains to geopolitical shock. Competitive dynamics stayed oligopolistic, with the top ten suppliers owning 67% of revenue in 2024, but the emergence of specialized AI accelerator startups signaled technology-led openings for new entrants.[1]
Key Report Takeaways
- By IC type, MOS special-purpose logic led with 32.12% of logic IC market share in 2025; the segment is projected to expand at a 5.74% CAGR to 2031.
- By technology node, the 20-44 nm category held 37.02% revenue share in 2025, while ≤5 nm nodes are forecast to grow at 11.08% CAGR through 2031.
- By wafer size, 300 mm substrates captured 67.74% of the logic IC market size in 2025 and are set to rise at a 6.05% CAGR to 2031.
- By application, automotive logic commanded an 8.02% CAGR outlook, the fastest among all end-uses, whereas IT and communication infrastructure retained the largest 34.62% share in 2025.
- By geography, Asia-Pacific accounted for 33.05% of 2025 revenue; North America is projected to log the highest regional CAGR at 4.41% to 2031.
Note: Market size and forecast figures in this report are generated using Mordor Intelligence’s proprietary estimation framework, updated with the latest available data and insights as of 2026.
Market Trends and Insights
Drivers Impact Analysis of Logic IC (Integrated Circuit) Market*
| Driver | (~) % Impact on CAGR Forecast | Geographic Relevance | Impact Timeline |
|---|---|---|---|
| Edge-AI-Driven Demand for Ultra-Low-Latency Logic ICs | +1.2% | Global, with APAC and North America leading | Medium term (2-4 years) |
| Automotive ADAS and Domain Controllers Requiring High-Reliability Logic | +0.8% | Global, with Europe and North America as core markets | Long term (≥ 4 years) |
| Government-Backed Advanced-Node FAB Incentives | +0.6% | North America, Europe, and select APAC regions | Long term (≥ 4 years) |
| 3D/2.5D Heterogeneous Integration Accelerating Logic IC Content per Package | +0.5% | Global, with Taiwan and South Korea as manufacturing hubs | Medium term (2-4 years) |
| Rapid Proliferation of Battery-Powered IoT Nodes Demanding Sub-µW Logic | +0.4% | Global, with strong adoption in APAC and North America | Short term (≤ 2 years) |
| Source: Mordor Intelligence | |||
Edge-AI-driven demand for ultra-low-latency logic ICs
Edge AI deployment shifted inference workloads away from cloud data centers toward on-device processors that required sub-millisecond reaction times. In 2024, BrainChip’s Akida Pico delivered 0.35 TOPS/W, cutting power budgets by 90% versus conventional DSPs. EdgeCortix projected that such edge AI devices could capture 40% of AI semiconductor revenue by 2027, as autonomous robots, drones, and wearables cannot tolerate 50–100 ms cloud latency. With real-time perception systems needing image and LiDAR data processed inside 10 ms, logic IC designers pivoted to sparse neural-network accelerators. The convergence of 5G edge computing and AI inference created a USD 15 billion serviceable opportunity for specialized logic by 2028, reinforcing the growth trajectory of the logic IC market.
Automotive ADAS and domain controllers require high-reliability logic.
Software-defined vehicles consolidated multiple ECUs into centralized domain controllers subject to ISO 26262 safety grades. In 2024, Renesas introduced the R-Car V4H SoC that fused real-time control, AI inference, and cybersecurity on a 28 nm die. Continental’s ADCU family hit 171 TOPS with AEC-Q100 grade parts, and Tesla’s Hardware 4.0 platform targeted 1,000 TOPS, demonstrating a ten-fold leap in four years. Automotive logic ICs therefore carried 3–5 x price uplifts over consumer equivalents, sustaining margin resilience even in a deflationary cycle for mature nodes. The reliability imperative drove long-lifecycle supply contracts that deepened customer lock-in and underpinned demand across the logic IC market.
Government-backed advanced-node fab incentives
The 2024 US CHIPS Act set aside USD 52 billion while China’s National IC Fund added USD 47 billion, tilting fab economics in favor of localized capacity. Intel’s USD 20 billion Ohio site is aimed at 2 nm logic by 2027, and GlobalFoundries secured USD 1.5 billion to expand its 14/22 nm lines for automotive and defense clients. Parallel programs in Europe earmarked EUR 43 billion (USD 50.56 billion) to double the continent’s share of semiconductor output by 2030. The subsidies spurred orders for extreme-ultraviolet tools; ASML reported 18-month lead times for High-NA EUV units in 2025. Incentive-driven capex buffered supply and broadened geographic diversity, supporting mid-single-digit growth in the logic IC market through the forecast horizon.
3D/2.5D heterogeneous integration accelerating logic IC content per package
Advanced packaging lets architects sidestep die-size limits by interconnecting chiplets vertically and laterally. In 2024, TSMC’s SoIC process delivered 10x transistor density over planar equivalents, while AMD’s MI300 fused CPU, GPU, and HBM dies on a 2.5D interposer. Intel’s Ponte Vecchio placed 47 chiplets in one package, illustrating how heterogeneous integration multiplied logic value per system without monolithic yield penalties. Marvell’s 3 nm 1.6 Tbps PAM4 platform further underscored bandwidth gains made possible by 2.5D packaging. The packaging wave, therefore, amplified unit content even as individual die geometries shrank, lifting revenue intensity inside the broader logic IC market.
Restraints Impact Analysis of Logic IC (Integrated Circuit) Market*
| Restraint | (~) % Impact on CAGR Forecast | Geographic Relevance | Impact Timeline |
|---|---|---|---|
| Extreme-UV Lithography Equipment Bottlenecks | -0.9% | Global, affecting all advanced node production | Short term (≤ 2 years) |
| Escalating <5nm Design NRE and IP Licensing Costs | -0.7% | Global, with the strongest impact on smaller design houses | Medium term (2-4 years) |
| Geopolitical Export Controls on EDA and Process Equipment | -0.5% | China and Russia primarily, with spillover effects globally | Medium term (2-4 years) |
| Global Talent Crunch in Advanced Logic Design and Verification | -0.4% | Global, with acute shortages in North America and Europe | Long term (≥ 4 years) |
| Source: Mordor Intelligence | |||
Extreme-UV lithography equipment bottlenecks
ASML remained the sole supplier of EUV tools, and each High-NA machine cost USD 350 million while requiring 18 months to deliver. Limited throughput held back sub-3 nm capacity: the big three foundries needed more than 200 units by 2030, but ASML’s annual output plateaued near 60 systems. Intel’s 18A roadmap hinged on High-NA availability, pushing risk production toward 2027. Yield loss from sub-nanometer overlay error compounded capacity strain, curbing the supply side of the logic IC market until new tool generations matured.
Escalating <5 nm design NRE and IP licensing costs
Sub-5 nm tape-outs demanded USD 500 million–1.5 billion, pricing out all but the deepest pockets. TSMC charged USD 18,000 per wafer at 3 nm, 50% higher than 5 nm. IP blocks such as ARM Cortex-X925 posted 40% higher royalties versus prior cores, while verification cycles stretched to 24–36 months.[2] The cost barrier reduced the pool of qualified design houses to fewer than 50 worldwide, slowing innovation at the advanced edge and tempering growth on that slice of the logic IC market.
*Our forecasts treat driver/restraint impacts as directional, not additive. The impact forecasts reflect baseline growth, mix effects, and variable interactions.
Logic IC (Integrated Circuit) Market Segment Analysis
By IC Type:
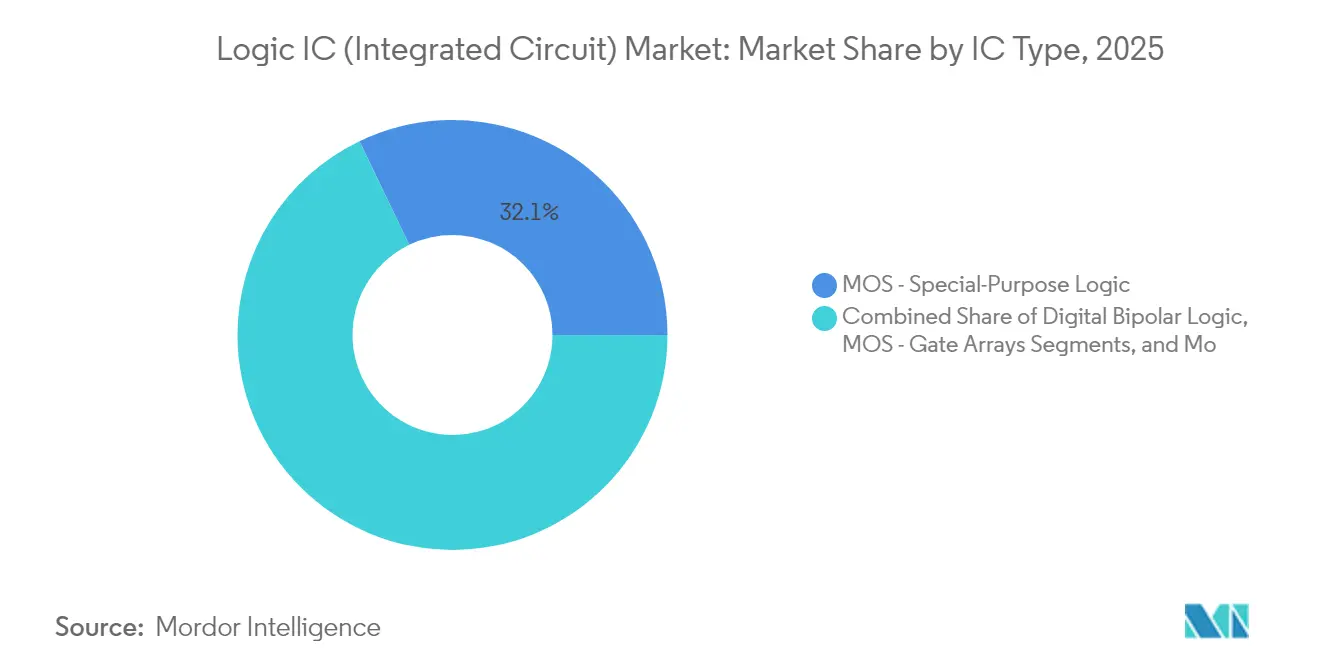
AI ASICs Drive MOS Logic TransformationMOS special-purpose logic captured a 32.12% share of the logic IC market in 2025 and is on course for a 5.74% CAGR until 2031. This branch is spearheaded by AI accelerators that offset the inefficiency of general-purpose processors. Meta’s 2024 disclosures of multiply-accumulate arrays showcased application-specific throughput gains of 10x over traditional scalar cores. The logic IC market size for AI-oriented MOS devices is projected to climb at a rate faster than the aggregate market as hyperscalers internalize custom silicon roadmaps.
Demand for MOS general-purpose logic, gate arrays, communication special purpose logic ICs, and drivers/controllers grew steadily inside consumer electronics and power-train modules. Automotive electrification injected extra volume into MOS driver ICs that oversee battery systems. Meanwhile, digital bipolar logic held niche value in radiation-hardened aerospace circuits. Samsung’s 2024 rollout of non-binary AI chips reinforced the trend toward purpose-built logic, pointing to an increasingly segmented supplier landscape.

By Technology Node:
Advanced Nodes Accelerate Despite Cost BarriersThe ≤5 nm cohort expanded at 11.08% CAGR through 2031, energised by AI, HPC, and premium mobile applications willing to absorb elevated wafer costs. The logic IC market size associated with ≤5 nm nodes is expected to jump in tandem with advanced packaging adoption. At the same time, the 20-44 nm class retained a 37.02% share in 2025, supporting infotainment, industrial control, and cost-sensitive IoT. TSMC’s 3 nm ramp in 2024 delivered 60% higher density relative to 5 nm, yet the premium contained its use to flagship products.
Nodes at 10-19 nm bridged cost and performance gaps, serving midrange smartphones and edge gateways. The ≥45 nm bracket persisted as a high-volume option for analog-heavy systems in motor drives and sensors. China’s industrial policy channelled billions toward 14 nm and 28 nm self-reliance, reinforcing mid-node capacity even as global attention gravitated to 2-3 nm. Consequently, the logic IC market displayed a bifurcated profile: volume resided in mature nodes, but profit pools coalesced at the leading edge.
By Wafer Size:
300 mm Dominance Drives Economies of ScaleThe 300 mm format held 67.74% of the logic IC market share in 2025 and logged 6.05% CAGR to 2031 on account of superior die counts per wafer. Migrating from 200 mm to 300 mm reduced unit cost by up to 40%, propelling continuous brownfield expansion in Taiwan, South Korea, and the United States. Infineon nonetheless extended its 200 mm automotive capacity to anchor supply resilience, reflecting an atypical preference for proven fabs among automakers.
≤150 mm lines supplied compound semiconductors and MEMS devices where small-lot specialty processes prevailed. GlobalFoundries elected to balance its 200 mm heritage footprint with new 300 mm lines, a strategy that hedged against cyclicality and maximised tooling utilisation. Although evaluations of 450 mm resurfaced periodically, consensus held that conversion costs outweighed savings for logic IC die sizes below 150 mm², leaving 300 mm the sweet spot for mainstream logic IC market manufacturing.
By Application:
Automotive Growth Outpaces Traditional SegmentsAutomotive electronics registered an 8.02% CAGR to 2031, the fastest within the logic IC market, as electric and autonomous vehicles embedded 2,000–3,000 logic devices per unit. Domain controllers alone carried USD 200–500 of logic content, markedly above legacy levels. IT and communication infrastructure preserved a 34.62% share in 2025 but faced utilisation improvements that trimmed per-server silicon demand. AMD’s EPYC CPUs consolidated four-socket workloads into one, underscoring the efficiency headwinds in data centres.
Consumer electronics moderated amid smartphone saturation, though AR/VR and wearables injected new vectors for specialised logic. Industrial automation and Industry 4.0 initiatives sustained mid-single-digit expansion as plants digitised sensing and control layers. Medical devices moved up the value chain with implantable logic that demanded extended validation cycles, yielding durable margins despite lower volumes. The interplay of automotive reliability and consumer innovation broadened the application tapestry that underpins the logic IC market.
Geography Analysis
APAC Logic IC (Integrated Circuit) Market
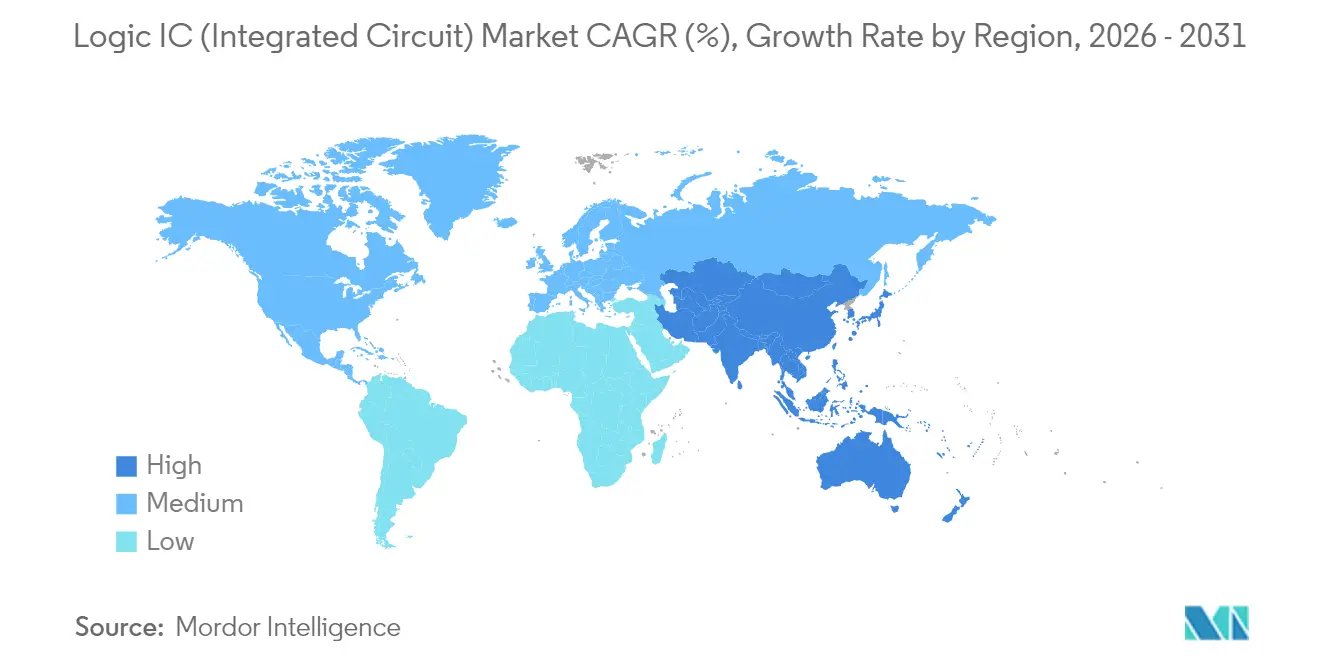
Asia-Pacific commanded 33.05% of 2025 revenue and advanced at 4.12% CAGR, anchored by Taiwan’s 64.9% foundry share and China’s accelerated build-out of domestic fabs. Political friction prompted multinational customers to dual-source outside the Taiwan Strait, yet TSMC retained technical leadership at 3 nm and early 2 nm tape-outs. China invested USD 143 billion up to 2030 to elevate its foundry capability toward 7 nm, gradually narrowing but not closing the gap with leading-edge peers.
North America Logic IC (Integrated Circuit) Market
North America used the CHIPS Act to push production share from 10% in 2025 toward 22% by 2031. Intel’s Ohio complex represented the largest greenfield logic facility in the region, aimed at 2 nm risk production by 2027. The United States benefited from demand in AI accelerators, aerospace-defence microelectronics, and automotive domain controllers, but a projected shortage of 67,000 skilled workers by 2030 risked hampering the ramp.
Europe, APAC and Middle East Logic IC (Integrated Circuit) Market
Europe positioned itself around automotive and industrial strengths. The EUR 43 billion (USD 50.56 billion) Chips Act set a target of 20% global output by 2030, leveraging clusters in Germany and France. Infineon and STMicroelectronics pivoted toward power and safety-critical logic platforms tailored for electrified transport and smart factories. Parallel investments in Japan, Israel, and the Gulf aimed to gain toeholds but remained subscale relative to the tri-polar core of East Asia, North America, and Western Europe, maintaining their roles as fast-growing demand zones rather than production hearts of the logic IC market.
Regulatory Landscape
Regulation affecting logic ICs is increasingly shaped by national security export controls for advanced computing and by industrial policy that links capacity expansion to public incentives. In the United States, the Department of Commerce, through the Bureau of Industry and Security (BIS), continues to refine Export Administration Regulations for advanced computing integrated circuits, including a January 2025 interim final rule that clarified due diligence expectations for compliance with updated controls and end-use screening.
In Europe, the European Commission advanced sovereignty-focused policy under the European Chips Act framework (Regulation (EU) 2023/1781 entered into force in September 2023) and, in June 2026, adopted a proposal for Chips Act 2.0 that emphasizes mapping supply chain vulnerabilities and dependencies. Policy discussions in 2026 also included U.S. consideration of a new framework for AI chip exports, which would condition access on investment commitments in U.S. AI data centers, adding compliance complexity for designers, foundries, and distributors serving cross-border AI and HPC demand.
Value Chain Analysis
The logic IC value chain spans architecture and IP (CPU/GPU/accelerator cores and interface IP), EDA and verification flows, wafer fabrication (IDMs and foundries), advanced packaging and test, and then module and system integration through OEMs and hyperscalers. Leading-edge production remains highly concentrated: sub-7 nm logic depends heavily on a small set of foundries, while the equipment chain includes single or limited-source dependencies, including ASML for EUV lithography, plus upstream suppliers such as Carl Zeiss SMT (optics) and TRUMPF (EUV drive lasers), with Japanese suppliers providing most EUV photoresists.
Backend constraints have moved closer to the front end for AI-heavy logic, with advanced packaging capacity (including CoWoS-class offerings) and HBM availability acting as throughput limiters alongside EUV tool availability. Supply-chain risk mitigation also shows up in geographic diversification and multi-year investment programs, including expanded U.S. manufacturing and ecosystem build-outs, with campus-scale construction tying wafer capacity, packaging, and sourcing of critical materials into a more regionally anchored operating model.
Competitive Landscape
The logic IC market remained oligopolistic: ten companies majority of the 2024 revenue. TSMC controlled 64.9% of third-party foundry sales through process leadership, while Samsung captured 9.3% by pushing Gate-All-Around structures into early customer trials. Intel’s revitalised foundry strategy won CHIPS Act support yet still sought broad customer adoption, underscoring that tooling capex is a necessary but insufficient differentiator.
Strategy shifted from horizontal scaling toward vertical specialisation. NVIDIA dominated AI accelerators via software lock-in, whereas AMD’s MI300 combined CPU, GPU, and HBM dies to chase heterogeneous workloads. Meta’s internal silicon program highlighted the trend of hyperscalers self-supplying core inference engines to trim operating expense and fine-tune performance.[4] EdgeCortix and BrainChip entered the fray with neuromorphic and reconfigurable data-flow architectures tuned for edge deployment, demonstrating how niche innovation can secure sockets that neither x86 nor Arm incumbents optimise.
Packaging technology emerged as a new battleground. TSMC’s SoIC platform and Samsung’s X-Cube offered wafer-to-wafer stacking with microbump pitches under 10 µm, while Intel pursued glass-core substrates to extend reticle-limited die area. Because advanced packaging determines thermal density and interposer bandwidth, leadership in this layer fortified foundries’ pricing leverage. Consequently, suppliers that integrated front-end nodes with proprietary packaging ecosystems strengthened their position across the logic IC market.
Logic IC (Integrated Circuit) Industry Leaders
-
Taiwan Semiconductor Manufacturing Company Limited (TSMC)
-
STMicroelectronics N.V.
-
Renesas Electronics Corporation
-
Analog Devices, Inc.
-
Broadcom Inc.
- *Disclaimer: Major Players sorted in no particular order
Logic IC (Integrated Circuit) Market Companies Covered in this Report
- Intel Corporation
- Taiwan Semiconductor Manufacturing Company Limited (TSMC)
- Samsung Electronics Co., Ltd.
- Texas Instruments Incorporated
- NXP Semiconductors N.V.
- STMicroelectronics N.V.
- onsemi (ON Semiconductor Corp.)
- Renesas Electronics Corporation
- Analog Devices, Inc.
- Broadcom Inc.
- Infineon Technologies AG
- Microchip Technology Incorporated
- Toshiba Electronic Devices & Storage Corp.
- Skyworks Solutions, Inc.
- ROHM Co., Ltd.
- Marvell Technology, Inc.
- MediaTek Inc.
- Silicon Laboratories Inc.
- Lattice Semiconductor Corporation
- Dialog Semiconductor Plc (Renesas)
Market Opportunities and Future Outlook
Opportunities are concentrated where capability bottlenecks intersect with fast-rising AI and electrification workloads, particularly in advanced packaging, power delivery, and safety-critical compute. Evidence that packaging is becoming a core differentiator includes TSMC reporting production use of 5.5-reticle-size CoWoS with greater than 98% yield in 2026, which supports a pathway for logic IC vendors to capture higher content per package through chiplets and high-bandwidth interconnect rather than relying only on node shrinks.
Localization programs and large capital commitments are also opening space for qualified suppliers that can meet domestic sourcing and assurance requirements while sustaining leading-edge performance. In 2026, TSMC expanded its planned Arizona investment footprint (including additional fabs targeting 2 nm and beyond), and Intel announced a EUR 5 billion investment to expand manufacturing capacity at Leixlip, Ireland, for Intel 3 node production. Together, these moves broaden the addressable ecosystem for equipment, materials, packaging and test, and design services serving advanced logic roadmaps and regulated end markets such as data-center infrastructure and automotive compute.
Recent Industry Developments in Logic IC (Integrated Circuit) Market
- July 2026: TSMC committed an additional USD 100 billion investment for its Arizona site, bringing total planned investment in the state to USD 265 billion and adding four more fabs aimed at 2 nm and more advanced technologies. The investment expands North American advanced-logic capacity and strengthens supply-chain diversification for customers seeking geographically resilient sourcing.
- May 2026: Analog Devices announced a definitive agreement to acquire Empower Semiconductor for USD 1.5 billion in an all-cash transaction. The deal expands ADI's high-density power portfolio that supports power delivery requirements surrounding advanced logic compute, including AI infrastructure designs.
- December 2024: Intel secured USD 7.86 billion in CHIPS Act grants to support manufacturing expansion and process advancement at its Ohio and Arizona sites. The award reinforced the role of public incentives in accelerating domestic advanced manufacturing capacity and related supplier ecosystem build-out.
Logic IC (Integrated Circuit) Market Report Scope and Research Methodology
Market Definition and Coverage
For this methodology, the market is defined as the revenue earned from selling logic integrated circuits that perform digital logic functions across major end-use equipment and systems worldwide.
Scope exclusions: We exclude memory ICs, analog ICs, discrete components, and power management ICs unless they are sold as part of a logic IC product line.
Segments Covered in This Report
-
By IC Type
- Digital Bipolar Logic
-
MOS Logic
- General-Purpose
- Gate Arrays
- Drivers / Controllers
- Standard Cells
- Special-Purpose
-
By Technology Node
- ≥ 45 nm
- 20-44 nm
- 10-19 nm
- 7-9 nm
- ≤ 5 nm
-
By Wafer Size
- ≤150 mm
- 200 mm
- 300 mm
-
By Application
- Consumer Electronics
- Automotive
- IT and Communication Infrastructure
- Computer / Data-Center
- Industrial and Automation
- Medical and Healthcare Devices
- Other Applications
-
By Geography
-
North America
- United States
- Canada
- Mexico
-
Europe
- Germany
- France
- United Kingdom
- Nordics
- Rest of Europe
-
Asia-Pacific
- China
- Taiwan
- South Korea
- Japan
- India
- Rest of Asia-Pacific
-
South America
- Brazil
- Mexico
- Argentina
- Rest of South America
-
Middle East and Africa
-
Middle East
- Saudi Arabia
- United Arab Emirates
- Turkey
- Rest of Middle East
-
Africa
- South Africa
- Rest of Africa
-
Middle East
-
North America
Data Sources, Market Sizing, and Validation
Desk Research
Desk research sets the guardrails for what is counted as logic IC revenue and how the demand pool behaves by end market. We relied on public, non-paywalled references such as World Semiconductor Trade Statistics (WSTS) releases, Semiconductor Industry Association (SIA) updates, OECD trade and industry indicators, World Bank macro series, and USITC trade statistics where they help explain electronics flows and cycle timing.
Alongside these, we reviewed annual reports, investor presentations, and earnings commentary from listed semiconductor firms to understand product mix shifts and typical pricing movement in logic-heavy portfolios. We scanned patents and technical papers to identify technology node transitions that later affect average selling prices and output mix. A paid subscription for company financials and a separate patent database were used selectively to cross-check revenue splits and to avoid double counting across adjacent IC categories. The sources listed here are illustrative, and we used additional references during data collection, validation, and clarification.
Primary Interviews and Surveys
Primary work was used to validate how logic IC revenue is classified in practice, and to pressure-test pricing, node mix, and end-use demand assumptions. We spoke with a mix of device suppliers, distribution participants, and downstream OEM or EMS stakeholders across the Americas, EMEA, and APAC so the model reflects purchase behavior and current cycle conditions.
Distribution of primary research fieldwork respondents
| Company type | Respondent position | Region |
|---|---|---|
| Top tier: 34% | CXOs: 12% | APAC: 44% |
| Mid tier: 48% | Functional/Unit leaders: 38% | EMEA: 34% |
| Smaller Players: 18% | Managers: 50% | Americas: 22% |
Market-Sizing & Forecasting
Market sizing starts with a top-down build where global semiconductor revenue signals are reconstructed into a logic IC demand pool by applying category shares and end-market exposure patterns that were validated through interviews. The totals are then corroborated with selective bottom-up approximations, such as sampled supplier revenue roll-ups, channel checks, and an ASP times volume sense-check for representative device families, before final numbers are locked.
A few market fingerprints were treated as core inputs because they move the logic IC market in a visible way. These include technology node mix (for example, shifts across 20-44 nm versus leading-edge nodes), wafer size mix (200 mm versus 300 mm exposure), end-use pull from consumer electronics, automotive, IT and communication infrastructure, and computers or data centers, and the pace of product refresh cycles that influence unit demand. Where a direct revenue split was not observable, gaps were handled using conservative allocation rules tied to the closest reported product family, followed by a review with interview inputs.
For forecasting, scenario analysis is used around the semiconductor cycle, and then a light multivariate regression is applied to link logic IC growth to key drivers like electronics production momentum, infrastructure capex direction, and expected node transition timing. Assumptions are iterated until the forecast path aligns with expert expectations for pricing normalization and mix changes, and until implied growth looks consistent with the demand signals seen in the field.
Data Validation & Update Cycle
Validation is done through triangulation across model outputs, independent market signals, and what respondents describe as current purchasing and inventory conditions. Large variances trigger a deeper check on scope alignment, currency conversion timing, and whether an end market assumption is overstating or understating a short-cycle swing.
Before sign-off, outputs go through multiple internal review steps, where anomalies are challenged and key assumptions are re-checked against the freshest public updates available. Reports are refreshed annually, and interim updates are made when material events occur, such as sharp cycle turns, major capacity changes, or policy shifts that alter electronics trade flows. Right before delivery, we do a final pass so clients receive the latest updated view.
Mordor Intelligence's Logic Ic Market Sizing Compared With Other Published Estimates
Published market values for logic ICs can differ quite a bit, even when the topic name looks similar, because the counting rules behind the numbers are not the same. Differences usually come from what is treated as a logic device versus a broader logic chip, the year chosen as the base, and how pricing and node mix are assumed to move through the cycle.
The main gap comes from scope overlap with CPUs, GPUs, and other compute chips, where Mordor Intelligence treats the market as revenue from logic integrated circuits across defined IC-type families and end-use applications, instead of counting the full logic chip universe that some sources bundle together.
Benchmark comparison
| Source | Market Size | Gaps in Research Methodology |
|---|---|---|
| Mordor Intelligence | USD 254.58 B (2026) | |
| Trade Publisher A | USD 189.40 B (2024) | Uses a broader logic chip framing that can include CPU and GPU type devices, and it anchors growth on a different base year and forecast window, which changes the cycle point and implied pricing path. |
| Regional Consultancy B | USD 186.09 B (2024) | Presents a faster growth track with limited visible controls for node mix and end-use weighting, and the scope description suggests a wider inclusion of standard logic plus application-specific categories that may pull in adjacent IC revenues. |
The spread in estimates becomes easier to explain when scope is mapped carefully and year timing is aligned to the semiconductor cycle. By keeping the count tied to clearly defined logic IC families and by checking results with practical revenue and mix sense-checks, the final number stays traceable to repeatable inputs rather than broad category bundling.
Key Questions Answered in the Report
What is the current value of the logic IC market and its growth outlook?
The market stood at USD 254.58 billion in 2026 and is projected to reach USD 303.91 billion by 2031, posting a 3.60% CAGR.
Which IC type contributes the largest share to the logic IC market?
MOS special-purpose logic, largely AI accelerators, contributed 32.12% of 2025 revenue and is expanding at 5.74% CAGR.
How fast are ≤5 nm technology nodes growing relative to other nodes?
The ≤5 nm segment is advancing at 11.08% CAGR, the quickest among all process categories.
Why is automotive the fastest-growing application segment?
Software-defined vehicles now embed up to 3,000 logic devices, lifting automotive logic demand at an 8.02% CAGR through 2031.
Which region is expected to add the most new logic IC capacity?
North America is set to double its production share from 10% to 22% by 2031 due to CHIPS Act-backed fab projects.
What is the main supply constraint facing advanced logic IC production?
Availability of high-NA EUV lithography tools from a single supplier limits sub-3 nm capacity expansion in the near term.