
Market Overview
| Study Period | 2020 - 2031 |
|---|---|
| Market Size (2026) | USD 3.29 Billion |
| Market Size (2031) | USD 4.25 Billion |
| Growth Rate (2026 - 2031) | 5.23% CAGR |
| Fastest Growing Market | Middle East and Africa |
| Largest Market | Asia Pacific |
| Market Concentration | Medium |
Major Players
*Disclaimer: Major Players sorted in no particular order Image © Mordor Intelligence. Reuse requires attribution under CC BY 4.0. |
|
Load Break Switch Market Analysis by Mordor Intelligence
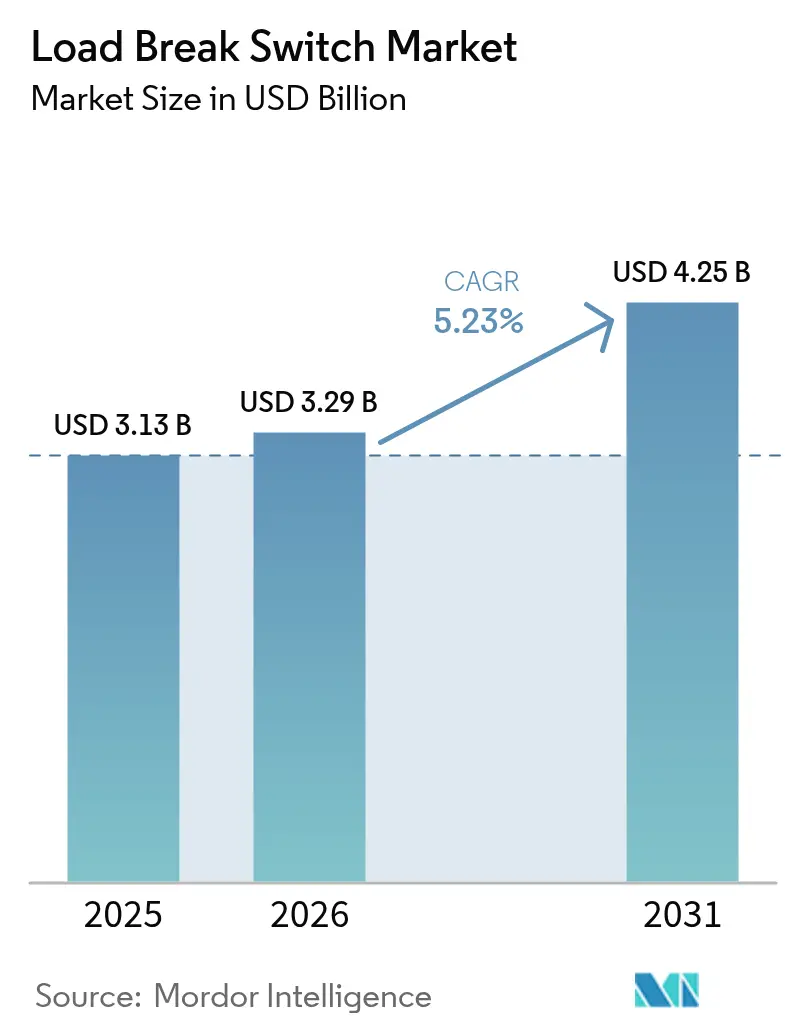
Load Break Switch market size in 2026 is estimated at USD 3.29 billion, growing from 2025 value of USD 3.13 billion with 2031 projections showing USD 4.25 billion, growing at 5.23% CAGR over 2026-2031. Widespread grid-modernization programs in North America and Europe, coupled with electrification projects across Asia-Pacific, position the Load Break Switch market as a critical enabler of reliable, flexible medium-voltage distribution networks. Strong policy support for renewable integration, data-center expansion, and rail electrification is reshaping demand toward more automated, SF₆-free products. Meanwhile, cost volatility in copper and stainless steel, together with regulatory uncertainty around SF₆ phase-out, introduces margin pressure and planning complexity for manufacturers. Competitive differentiation is therefore shifting from price toward technology leadership in digital control, eco-efficient insulation, and application-specific designs that meet emerging standards for sustainability and resiliency.
Key Report Takeaways
- By product type, gas-insulated units led with 44.78% Load Break Switch market share in 2025, whereas solid/vacuum-insulated switches are advancing at a 6.71% CAGR through 2031.
- By installation, outdoor pole-mounted equipment accounted for 52.58% of the Load Break Switch market in 2025, while indoor panel-mounted solutions are forecast to grow 7.18% annually to 2031.
- By voltage class, the 11–33 kV segment held 45.92% of Load Break Switch market share in 2025; the >33 kV class is projected to expand at a 7.26% CAGR over the same horizon.
- By operating mechanism, manual devices dominated with a 62.53% share in 2025, yet motorized/automatic models are set to post a 7.54% CAGR through 2031.
- By end-user, utilities commanded 40.92% of the Load Break Switch market in 2025, whereas renewable IPPs and micro-grids recorded the quickest growth at 6.89% CAGR.
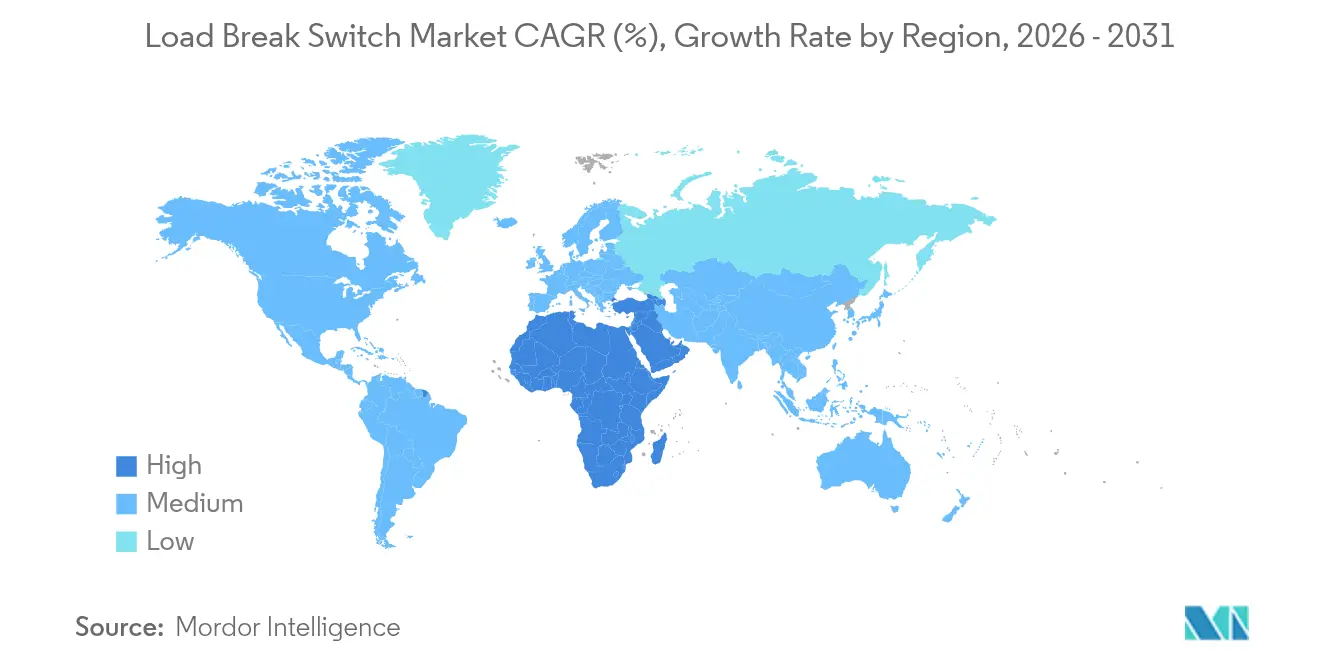
- By geography, Asia-Pacific contributed 38.45% of global revenue in 2025; the Middle East and Africa register the fastest regional CAGR at 7.05% to 2031.
Note: Market size and forecast figures in this report are generated using Mordor Intelligence’s proprietary estimation framework, updated with the latest available data and insights as of 2026.
Global Load Break Switch Market Trends and Insights
Drivers Impact Analysis*
| Driver | (~) % Impact on CAGR Forecast | Geographic Relevance | Impact Timeline |
|---|---|---|---|
| Grid refurbishment programs in developed economies | +1.1% | North America and Europe | Medium term (2-4 years) |
| Renewable-energy driven medium-voltage switch demand | +1.2% | Global, with APAC leading | Long term (≥ 4 years) |
| Urban distribution automation roll-outs | +0.8% | APAC core, spill-over to MEA | Medium term (2-4 years) |
| Electrification of rail and metro networks | +0.9% | Europe and APAC primarily | Long term (≥ 4 years) |
| MV switch as integral to data-center resiliency | +0.7% | North America and Europe | Short term (≤ 2 years) |
| ESG push for SF₆-free LBS designs | +0.6% | Europe leading, global adoption | Medium term (2-4 years) |
| Source: Mordor Intelligence | |||
Grid Refurbishment Programs in Developed Economies
Utilities in North America and Europe are replacing legacy switchgear to handle bidirectional power flows required by distributed resources, triggering steady demand for advanced units that interface seamlessly with automated feeders. Asset-replacement cycles of 25–30 years coincide with new smart-grid mandates enforced under 55% carbon-reduction goals, elevating specifications for remote control and condition monitoring. Vendors that embed sensors and communication modules into the Load Break Switch market portfolio capture premium margins as operators prioritize uptime and workforce safety.
Renewable-Energy Driven Medium-Voltage Switch Demand
As ASEAN nations alone prepare to add 30 GW of solar and wind capacity, project developers specify switches engineered for fluctuating output and anti-islanding functions. Solutions must integrate vacuum or solid dielectric interruption with fast reclosing to meet grid-code requirements, growing the Load Break Switch market addressable value in utility-scale renewables.
Urban Distribution Automation Roll-outs
Major Asian cities deploy FLISR and Volt/VAr optimization schemes that depend on motorized switches to localize faults within seconds and balance voltage proactively. [1]Siemens, “Distribution Automation Box,” siemens.com Capital spending on automation software drives parallel hardware upgrades, reinforcing the Load Break Switch market as a gateway to smarter distribution grids.
Electrification of Rail and Metro Networks
Rising investment in traction-power networks—exemplified by the EUR 49.33 million Larissa-Volos line in Greece—requires vibration-resistant load interrupters that withstand inductive loads. Tailored designs enhance the Load Break Switch market penetration in rolling-stock depots and sub-stations for both AC and DC systems.
Restraints Impact Analysis*
| Restraint | (~) % Impact on CAGR Forecast | Geographic Relevance | Impact Timeline |
|---|---|---|---|
| Volatile copper and stainless-steel prices | -0.4% | Global | Short term (≤ 2 years) |
| Regulatory uncertainty over SF₆ phase-out timelines | -0.3% | Europe and North America | Medium term (2-4 years) |
| Limited OEM localisation in Africa and S-America | -0.2% | Africa and South America | Long term (≥ 4 years) |
| Slow standardisation for solid-insulated LBS | -0.2% | Global, with Europe leading adoption | Medium term (2-4 years) |
| Source: Mordor Intelligence | |||
Volatile Copper and Stainless-Steel Prices
Copper climbed to USD 5.20 per pound in May 2024, prompting OEM list-price hikes of up to 45% and complicating budget cycles for price-sensitive utilities. [2]LAPP Tannehill, “The Copper Boom: Understanding Record-High Prices,” lapptannehill.com Smaller firms lacking hedging programs face working-capital strain, potentially slowing new orders in the Load Break Switch market until commodity costs normalize.
Regulatory Uncertainty Over SF₆ Phase-out Timelines
Divergent schedules between EU, California, and federal US rules force suppliers to maintain dual product lines, raising R&D and inventory overhead. Ambiguity over enforcement dates can delay customer purchasing decisions, dampening near-term growth prospects in the Load Break Switch market despite long-term decarbonization drivers.
*Our forecasts treat driver/restraint impacts as directional, not additive. The impact forecasts reflect baseline growth, mix effects, and variable interactions.
Segment Analysis
By Product Type: SF₆-Free Innovation Accelerates
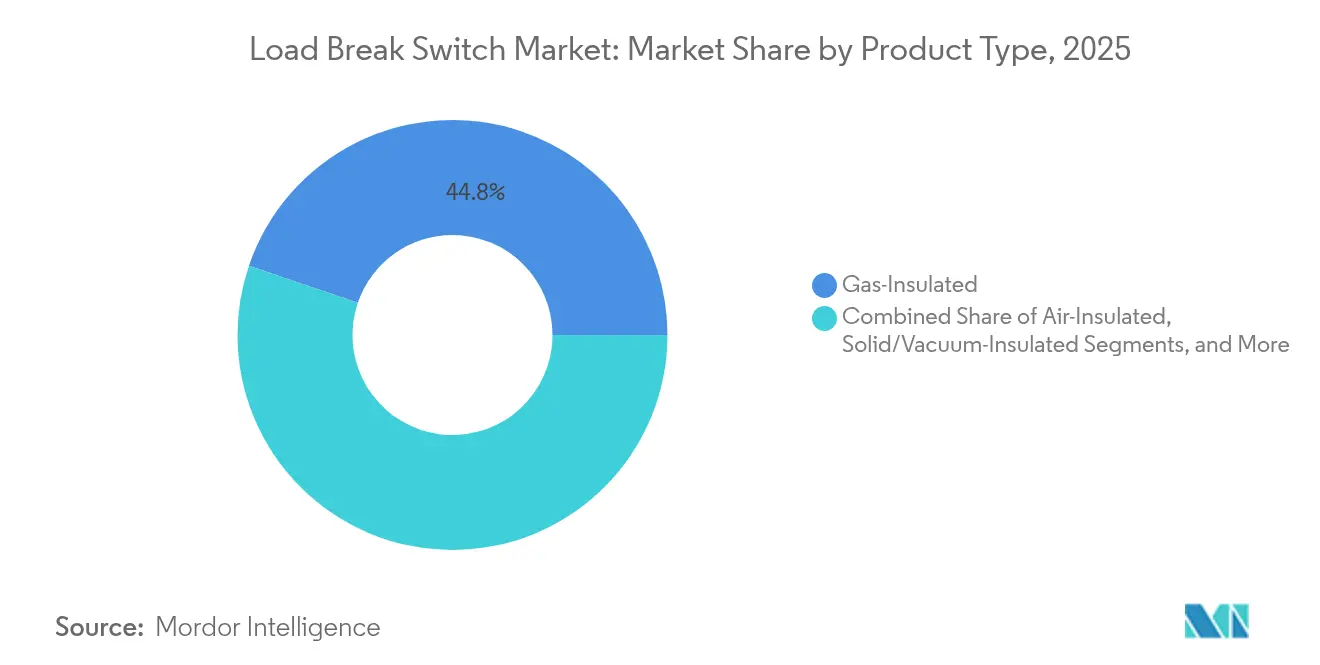
Gas-insulated models delivered 44.78% Load Break Switch market share in 2025 due to proven compactness and dielectric strength. Yet solid/vacuum designs are scaling fastest at 6.71% CAGR because regulators cap SF₆ usage, and cost differentials narrow as volumes rise. The Load Break Switch market size for vacuum units is projected to expand from USD 1.11 billion in 2026 to USD 1.58 billion by 2031 at plant-level pricing, underscoring the sustainability premium.
Technology migration favors OEMs that secure eco-gas patents or deploy vacuum interrupters across higher voltage classes. ABB’s puffer-type switch with alternative gases and Siemens Energy’s Blue platform cut lifecycle CO₂ equivalents by more than 80%. Utilities issuing net-zero tenders expedite the replacement of SF₆ baselines, further diversifying the Load Break Switch market.


By Installation: Indoor Applications Drive Growth
Outdoor pole-mounted units represented 52.58% revenue in 2025, due to overhead line prevalence in rural grids. However, the Load Break Switch market size for indoor panel-mounted configurations is forecast to grow 7.18% annually, reaching USD 1.44 billion by 2031, propelled by data-center and industrial retrofits that prize climate-controlled enclosures.
High-density facilities demand arc-flash mitigation and cyber-secure SCADA interfaces that indoor gear accommodates readily. Pad-mounted variants bridge the gap for suburban substations, preserving upgrade flexibility while keeping footprints compact. Investment in intelligent panels, therefore, redistributes revenue streams across the Load Break Switch market, even as outdoor hardware maintains baseline volumes.
By Voltage Class: Higher Voltages Gain Momentum
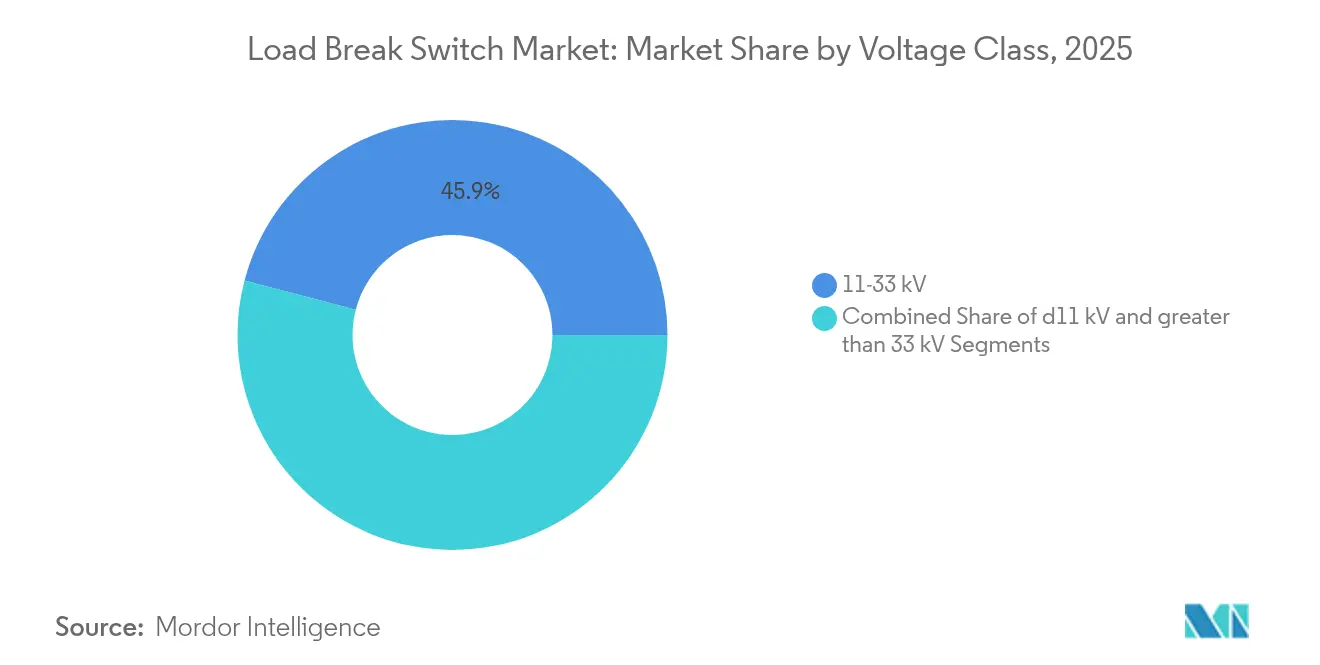
The 11–33 kV band captured 45.92% Load Break Switch market share in 2025, supporting mainstream distribution feeders worldwide. Utilities now migrate to 35 kV circuits to reduce thermal losses and connect utility-scale renewables more efficiently, fueling a 7.26% CAGR for >33 kV switches through 2031.
Sub-transmission expansion, especially in wind-rich zones, raises technical requirements for higher BIL ratings and extended mechanical endurance. Premium pricing in this class compensates for lower unit volumes, lifting overall Load Break Switch market revenue. Meanwhile, the ≤11 kV niche remains stable, anchored by rooftop solar farms and light industrial loads.
By Operating Mechanism: Automation Transforms Operations
Manual handles dominated 62.53% of shipments in 2025 due to straightforward design and low acquisition cost. Yet remote-ready motor drives register a 7.54% CAGR because FLISR programs demand split-second isolation without dispatching field crews.
The Load Break Switch industry is converging on plug-and-play motor kits that retrofit legacy units, accelerating automation without full replacement. Utilities justify the premium via avoided outage penalties and reduced truck rolls, injecting resilient growth into the segment. Integration of IEC 61850 digital relaying and cloud analytics redefines value propositions. The Load Break Switch market responds with firmware-upgradable controllers that allow predictive maintenance via temperature and pressure sensors. Cybersecurity certification further elevates market entry barriers, rewarding incumbents that embed secure boot and encryption protocols.
By End-user: Renewables Reshape Demand
Utilities procured 40.92% of units in 2025, but renewable IPPs and micro-grids will outpace at 6.89% CAGR to 2031. Hybrid micro-grids serving remote mines or islands specify switches capable of seamless grid-to-island transfer, differentiating the Load Break Switch market from conventional feeder applications.
Commercial campuses and industrial parks incorporate medium-voltage loops to accommodate on-site PV and battery assets, widening the customer base. OEM channel strategies now target EPCs and energy-as-a-service providers that bundle switchgear with storage and controls.
Geography Analysis
Asia-Pacific led with 38.45% of 2025 revenue, anchored by Chinese renewable build-outs and Indian rural electrification that necessitate robust feeder automation. Urban megaprojects in ASEAN capitals likewise boost demand for compact, arc-resistant assemblies that fit underground substations. Policymakers prioritize domestic manufacturing incentives, which encourage joint ventures and technology transfer within the Load Break Switch market.
Middle East and Africa log the highest regional CAGR at 7.05% as Egypt’s Megaproject added 14.4 GW of capacity and Gulf states diversify grids to host mega-solar complexes. Public-private partnerships accelerate procurement, while multilaterals finance upgrades in Sub-Saharan Africa, driving adoption of low-maintenance, weather-proof models.
North America and Europe sustain sizeable installed bases that require replacement of 1990s-era gear now reaching end-of-life. The US medium-voltage switchgear market, worth roughly USD 2 billion, is growing 10.5% annually on data-center builds and undergrounding programs that favor sealed interrupters. Europe pioneers SF₆-free standards, compelling accelerated upgrades, and spurring innovation clusters that enhance the global Load Break Switch market.

Regulatory Landscape
Load break switches are subject to medium-voltage switchgear design and test requirements under the IEC 62271 series standards, which utilities and EPCs typically reference in tenders alongside utility-specific type-test and endurance requirements. At the same time, the regulatory direction for insulating gases is tightening, most visibly in Europe through the European Commission F-Gas Regulation (EU) 2024/573. The rule has introduced prohibitions for certain new switchgear applications at lower voltage levels, including <= 24 kV, which is reinforcing the shift toward vacuum, solid dielectric, and other alternative insulation platforms.
In the United States, grid security and resiliency measures also shape procurement, with a March 2026 Federal Energy Regulatory Commission (FERC) action approving modified cybersecurity-related Reliability Standards and definitions for the Bulk-Power System. Industrial policy has also become a complementary lever, highlighted by an April 2026 Presidential Determination under the Defense Production Act Section 303. That move targets expanded domestic capacity for critical grid infrastructure such as substations and high-voltage switchgear, influencing localization priorities and supplier qualification practices across adjacent medium-voltage equipment.
Value Chain Analysis
The load break switch value chain begins with metals and insulation systems (copper and stainless steel for conductors and hardware, plus polymers/epoxies, vacuum interrupters, or gas systems depending on the design). It then moves into component manufacturing for enclosures, contacts, operating mechanisms, and optional motor drives and control electronics. Switchgear OEMs typically carry out assembly and type testing, after which products reach end users through direct utility channels, EPCs for renewables and industrial projects, and regional distributors or packagers for panel and pad-mounted solutions.
Supply dynamics have been influenced by bottlenecks in broader T&D equipment manufacturing and upstream material constraints. Industry commentary has pointed to shortages affecting medium-voltage switchgear availability and lead times. In response, manufacturers have emphasized regional capacity investments, including accelerated efforts in 2025 to add domestic US manufacturing capacity to ease delivery delays and reduce dependency on single-source supply routes. These conditions increase the value of dual-sourcing for key parts, especially copper-intensive assemblies and interrupter components, and strengthen partnerships between traditional hardware OEMs and digital control suppliers as motorized or automatic and SCADA-integrated offerings gain traction.
Competitive Landscape
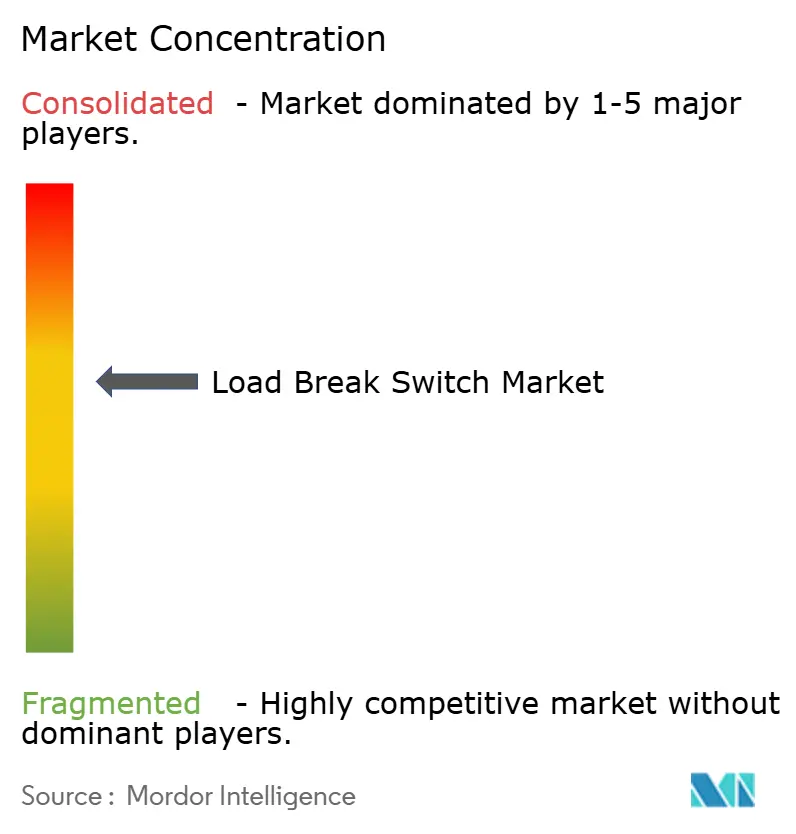
The market is moderately fragmented. Global majors—Schneider Electric, ABB, Siemens, Eaton—share roughly 55% of global revenue, while dozens of regionals compete on niche customizations. Large players leverage integrated portfolios that span substation automation, breakers, and digital services, enabling turnkey bids that win utility tenders.
Technology differentiation is sharpening around eco-efficient gases and solid-state interruption. ABB’s SACE Infinitus solid-state breaker debuted in April 2025, breaking the 2,500 A ceiling and setting new response benchmarks. Siemens Energy’s Blue range eliminates greenhouse gases entirely, appealing to European DSOs with strict ESG mandates. Emerging disruptors such as Atom Power push silicon-based devices that integrate metering and analytics, challenging mechanical designs in premium applications.
Strategic moves include Eaton’s double-digit backlog growth in 2024 on data-center-focused lines and Schneider Electric’s 2025 acquisition of Motivair to broaden liquid-cooling capabilities for critical power sectors. Suppliers targeting SF₆-free patents or digital-native platforms gain pricing power, tilting competition toward innovation rather than scale alone within the Load Break Switch market.
Load Break Switch Industry Leaders
-
Schneider Electric SE
-
ABB Ltd.
-
Siemens AG
-
Eaton Corporation plc
-
Lucy Group Ltd. (Lucy Electric)
- *Disclaimer: Major Players sorted in no particular order

Market Opportunities and Future Outlook
A key whitespace is the pace of replacement from SF6-insulated designs toward SF6-free and eco-efficient alternatives across utilities and critical infrastructure, particularly where explicit restrictions or procurement policies influence technical specifications. The market has a concrete adoption anchor in California, where the regulatory framework restricted new SF6-insulated equipment at 72 kV and below effective December 31, 2024, with additional phased steps at higher voltage classes after 2026. Utilities are acting on that direction, and in June 2026 Southern California Edison selected Schneider Electric GM-AirSeT switchgear for the Great Lakes and Running Springs substations to meet SF6 compliance needs, reinforcing demand pull for vacuum and air-based platforms in medium-voltage networks.
A second opportunity area is distribution automation and retrofitability. When utilities implement FLISR and reliability programs, they increasingly need motorized load break switches paired with controllers that support common SCADA protocols, such as DNP3 and IEC 61850. NOJA Power’s January 2026 integration of the RC 10 control system into VISI SWITCH units reflects product roadmaps converging on remote operation and smarter edge control, creating space for upgrade kits, communications modules, and sensor-enabled condition monitoring on existing feeder assets. This aligns with data-center resiliency and urban network undergrounding programs, where indoor panel-mounted and compact solutions help meet tighter requirements for arc-fault protection, cyber-secure control, and footprint-constrained upgrades.
Recent Industry Developments
- June 2026: Schneider Electric announced a collaboration with Southern California Edison to deploy SF6-free gas-insulated switchgear technology using pure air and vacuum at two substation facilities in California. The deployment supports compliance-driven replacement of SF6 equipment and helps add grid capacity within existing substation footprints. It also raises the reference bar for SF6-free architectures in utility specifications for medium-voltage applications.
- August 2025: Schneider Electric signed a long-term framework agreement with E.ON to supply GM-AirSeT primary and RM-AirSeT secondary (RMU) SF6-free switchgear for deployments across Europe. The agreement strengthens multi-year visibility for SF6-free product lines and supports scale-up of manufacturing and service capabilities. It further accelerates standardization of eco-efficient switchgear across a large DSO footprint.
- October 2024: Eaton highlighted strong momentum in its electrical business with record Q3 2024 results and a rising backlog, reflecting heavy ordering tied to grid modernization and capacity additions. The order strength underscores procurement pressure across medium-voltage distribution equipment supply chains. It also reinforces the competitive advantage of suppliers with shorter lead times and robust channel coverage.


Research Methodology Framework and Report Scope
Market Definition and Coverage
For this report, the load break switch market covers the value of switches used to make or break a circuit safely under load in power distribution networks, across indoor and outdoor installations and common medium to high voltage ranges.
Scope exclusions: We exclude upstream raw materials, generic switchgear assemblies sold as complete panels, and services such as installation labor, commissioning, and routine maintenance.
Segmentation Overview
-
By Product Type
- Gas-Insulated
- Air-Insulated
- Solid/Vacuum-Insulated
- Hybrid and SF?-Free Alternatives
-
By Installation
- Outdoor – Pole-Mounted
- Outdoor – Pad/Cubicle-Mounted
- Indoor – Panel-Mounted
-
By Voltage Class
- ≤11 kV
- 11–33 kV
- >33 kV
-
By Operating Mechanism
- Manual
- Motorised/Automatic
-
By End-user
- Utilities
- Industrial Facilities
- Commercial and Institutional Buildings
- Renewable IPPs and Micro-grids
-
By Geography
-
North America
- United States
- Canada
- Mexico
-
South America
- Brazil
- Argentina
- Chile
- Rest of South America
-
Europe
- Germany
- United Kingdom
- France
- Italy
- Spain
- Russia
- Rest of Europe
-
Asia-Pacific
- China
- India
- Japan
- South Korea
- Singapore
- Malaysia
- Australia
- Rest of Asia-Pacific
-
Middle East and Africa
-
Middle East
- United Arab Emirates
- Saudi Arabia
- Turkey
- Rest of Middle East
-
Africa
- South Africa
- Nigeria
- Rest of Africa
-
Middle East
-
North America
Data Sources, Market Sizing, and Validation
Desk Research
Desk research started with mapping demand signals tied to distribution build outs and refurbishment, since load break switches usually move alongside feeder automation, substation upgrades, and renewables interconnection. We used public sources such as the International Energy Agency for grid investment context, the World Bank for electrification and infrastructure indicators, and the United Nations Comtrade database to understand trade flows for electrical switching equipment.
To keep assumptions practical, we also reviewed sources such as the U.S. Energy Information Administration for electricity and grid related indicators, IEEE publications for application and standards context, and national grid and energy regulator portals for project pipelines and policy cues. Company annual reports, investor presentations, and reputable press were used to validate product mix shifts like gas insulated versus air insulated designs, along with the move toward motorized mechanisms. We also referenced paid subscriptions for company financials and intelligence, news and financials, patents, and selective shipment level import export checks when a public series was missing. These desk research sources are illustrative, and many other references were used for data collection, validation, and clarification.
Primary Interviews and Surveys
Primary work was used to pressure test what we saw in secondary sources, especially for average selling price movement, order lead times, and how demand splits between utilities, industrial users, commercial sites, and renewable and microgrid projects. We spoke with a balanced mix of manufacturers, channel partners, EPC and utility procurement teams, and engineers who specify equipment. Respondent input was cross checked across major regions so the model did not lean too heavily on one geography.
Distribution of primary research fieldwork respondents
| Company type | Respondent position | Region |
|---|---|---|
| Top tier: 31% | CXOs: 16% | APAC: 52% |
| Mid tier: 53% | Functional/Unit leaders: 41% | EMEA: 30% |
| Smaller Players: 16% | Managers: 43% | Americas: 18% |
Market-Sizing & Forecasting
The core sizing uses a top-down build that reconstructs demand from power distribution investment and connection activity, and then allocates it into the load break switch requirement pool by voltage class and installation footprint. In practice, we first aligned the demand backbone to indicators such as distribution line additions and upgrades, substation and feeder automation programs, renewable capacity additions that require switching on feeders, and replacement cycles tied to aging networks.
Once the demand pool was shaped, it was translated into value using market checks on product mix and pricing, including gas insulated versus air insulated adoption, the split between manual and motorized mechanisms, and the weight of the 11 to 33 kV range in typical deployments. Utility share trends and the outdoor versus indoor preference were treated as key fingerprints because they move volumes differently across regions. To corroborate totals, we also used selective bottom-up approximations like sampled price times shipment volumes from channel feedback, plus supplier revenue exposure checks when disclosures were clear. For gaps, we used regional proxy ratios that were validated in interviews.
For forecasting, scenario analysis was applied so the base case remains consistent with grid spending plans and electrification outlooks shared by experts, while still reflecting uncertainty around project timing and regulation. We then translated the scenario paths into annual values with smoothing on pricing so one-off tender spikes did not distort the trend line.
Data Validation & Update Cycle
Validation was done in layers so that obvious errors were caught early, and subtle drifts were caught before final sign off. We compared the model outputs against independent signals like regional grid capex direction, trade movement trends for relevant electrical switching categories, and the expected end user shares that practitioners see in the field.
When a variance looked large, assumptions were rechecked and respondents were recontacted to confirm whether it came from pricing, a change in product mix, or timing of major projects. A second analyst review was conducted on the calculations and the logic behind inputs, and only then were the final numbers locked. The report is refreshed annually, and interim updates are made when a material event changes demand or pricing direction. A last pre delivery pass is then completed so clients receive the most current view.
Mordor Intelligence's Load Break Switch Market Estimate Compared With Other Published Estimates
Published market sizes for load break switches can look far apart because boundaries are not always consistent, and the same year label may hide different product mixes and regional coverage. In our work, we also see differences coming from how firms treat voltage ranges, whether complete switchgear panels are counted, and the way pricing is normalized across currencies.
By tracking voltage class splits, installation mix, and utility procurement patterns, Mordor Intelligence keeps the 2026 total tied to equipment only demand, which reduces inflation from counting full panel assemblies and service add-ons that sometimes get bundled into a broader switchgear total.
Benchmark comparison
| Source | Market Size | Gaps in Research Methodology |
|---|---|---|
| Mordor Intelligence | USD 3.29 B (2026) | |
| Trade Journal A | USD 3.00 B (2026) | This estimate is presented at a headline level with limited visibility on segmentation, and it may exclude parts of the medium voltage distribution replacement cycle that lift volumes in utility led markets. |
| Industry Research Outlet B | USD 2.72 B (2025) | The number is anchored to a different base year and can reflect narrower product scope or conservative pricing assumptions, with less clarity on how gas insulated adoption and motorized mechanisms are priced over time. |
Overall, the spread is mainly explained by what is included around switchgear assemblies, the year used for the starting point, and how pricing is carried forward. Our approach stays easier to audit because it is built from clear demand indicators, checked through interviews, and then adjusted only when multiple signals point to the same variance.


Key Questions Answered in the Report
What is the current size of the Load Break Switch market?
The market stands at USD 3.29 billion in 2026 and is projected to reach USD 4.25 billion by 2031 at a 5.23% CAGR.
Which region leads the Load Break Switch market?
Asia-Pacific commands 38.45% of global revenue, driven by large-scale infrastructure and renewable investments.
Why are SF₆-free load break switches gaining traction?
Environmental regulations that phase out high-GWP gases are pushing utilities to adopt vacuum or eco-gas alternatives that cut lifecycle emissions by over 80%.
What segment is growing fastest by installation type?
Indoor panel-mounted switches show the highest growth at 7.18% CAGR because data centers and industrial plants prefer climate-controlled, secure environments.
How are commodity prices affecting manufacturers?
Record-high copper costs forced up to 45% price increases, squeezing margins for suppliers lacking hedging strategies.
Who are the major players in the Load Break Switch market?
Key companies include Schneider Electric, ABB, Siemens, Eaton and emerging entrants like Atom Power focusing on solid-state technology.
Page last updated on:






