
LNG Storage Tank Market Size and Share
Market Overview
| Study Period | 2021 - 2031 |
|---|---|
| Market Size (2026) | USD 17.78 Billion |
| Market Size (2031) | USD 26.27 Billion |
| Growth Rate (2026 - 2031) | 8.13 % |
| Fastest Growing Market | Asia-Pacific |
| Largest Market | Asia-Pacific |
| Market Concentration | Medium |
Major Players *Disclaimer: Major Players sorted in no particular order Image © Mordor Intelligence. Reuse requires attribution under CC BY 4.0. | |
LNG Storage Tank Market Analysis by Mordor Intelligence
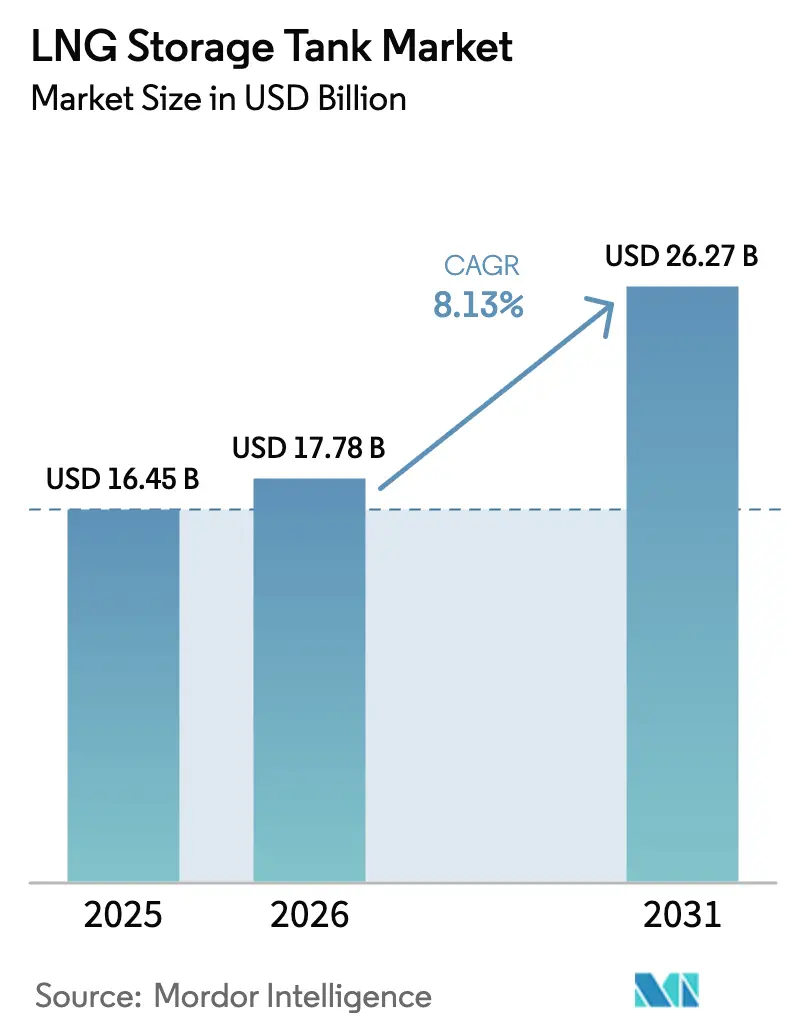
The LNG Storage Tank Market size was valued at USD 16.45 billion in 2025 and estimated to grow from USD 17.78 billion in 2026 to reach USD 26.27 billion by 2031, at a CAGR of 8.13% during the forecast period (2026-2031).
Rising LNG trade volumes, the widening acceptance of LNG-fueled vessels, and the Asia-Pacific region’s emphasis on supply security are reinforcing steady capital deployment in new tank farms and floating systems. Tightening sulfur-emission limits for ships, rapid growth in floating storage and regasification units, and automation in 9%-nickel welding are shortening project schedules and lowering lifetime risk. Modular prefabrication, especially of membrane designs, is unlocking remote project sites and mid-scale hubs. Steel and nickel cost volatility, as well as protracted coastal permitting, form the principal headwinds; however, long-term policy backing for gas as a transition fuel keeps the LNG storage tank market on a resilient trajectory.
Key Report Takeaways
- By containment type, full containment led with a 41.75% share of the LNG storage tank market in 2025; membrane tanks are projected to expand at a 11.02% CAGR through 2031.
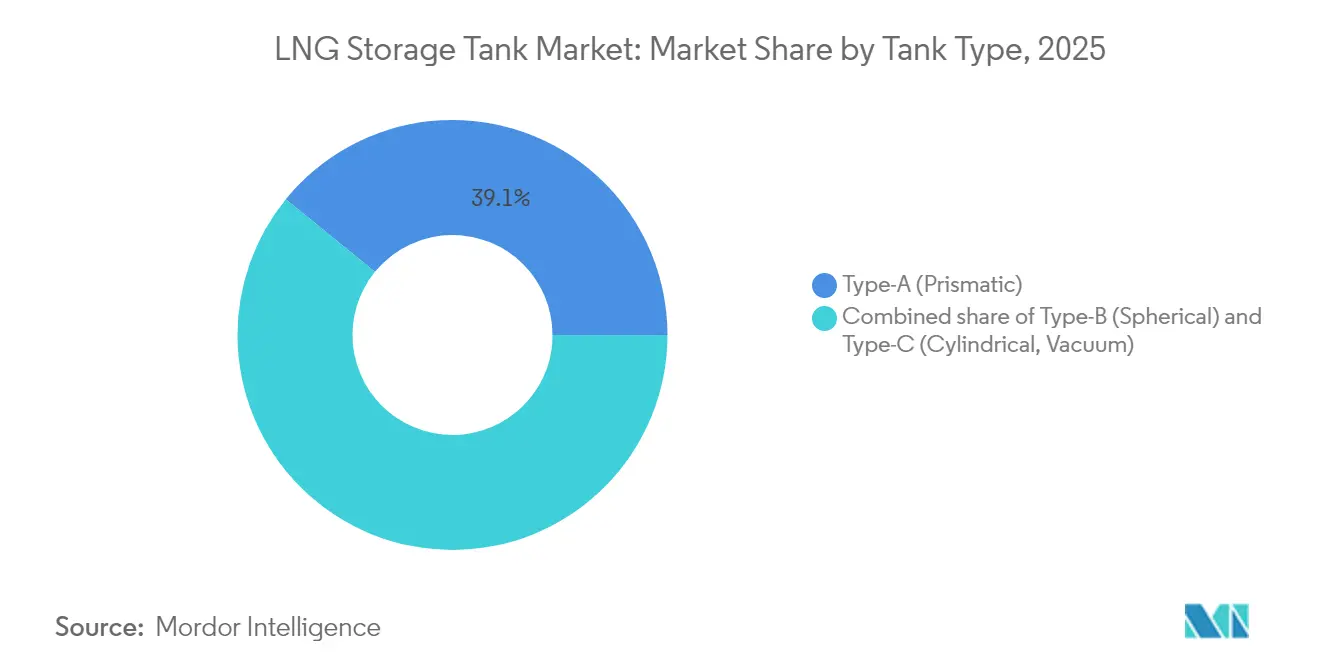
- By tank geometry, Type-A prismatic designs accounted for 39.12% share of the LNG storage tank market size in 2025, while Type-C cylindrical tanks registered the fastest forecast CAGR at 10.05%.
- By material, 9%-nickel steel captured 51.82% of the revenue in 2025; aluminum alloys are forecasted to grow at a 10.92% CAGR through 2031.
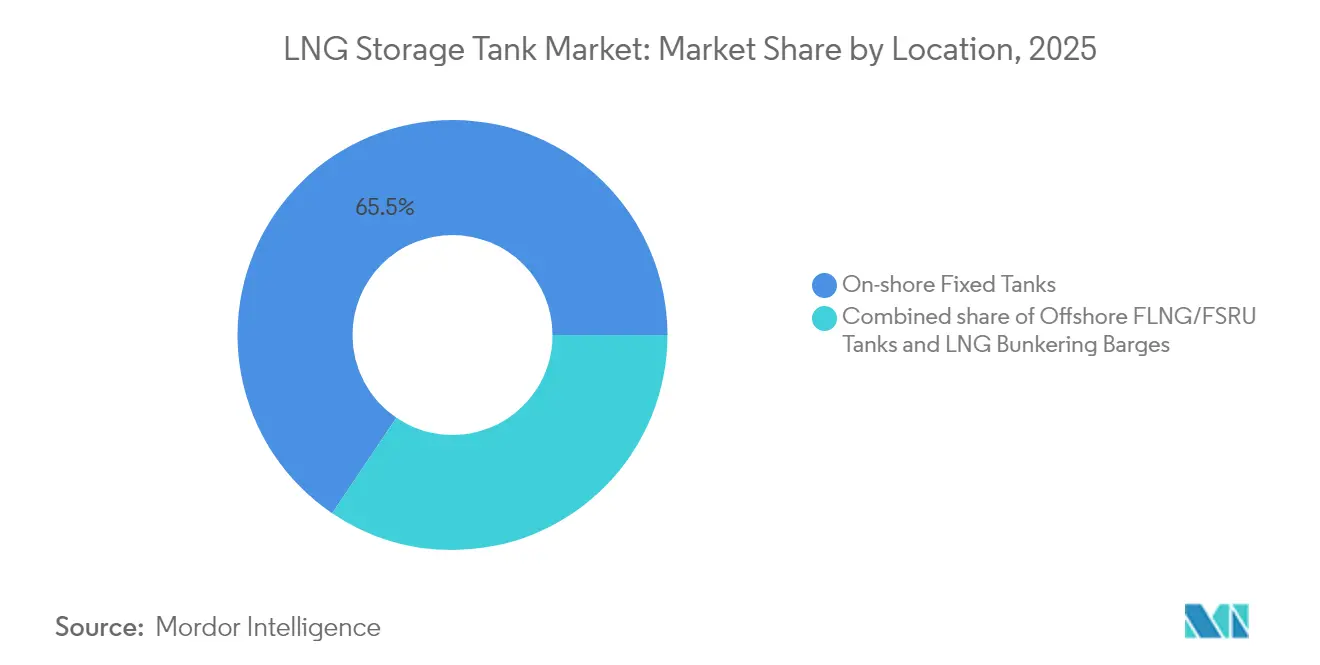
- By location, on-shore fixed tanks dominated with a 65.54% share in 2025, whereas offshore FLNG/FSRU units are set to rise at a 13.18% CAGR.
- By application, import and regasification terminals held 42.60% share of the LNG storage tank market size in 2025, and marine bunkering facilities are advancing at an 10.88% CAGR.
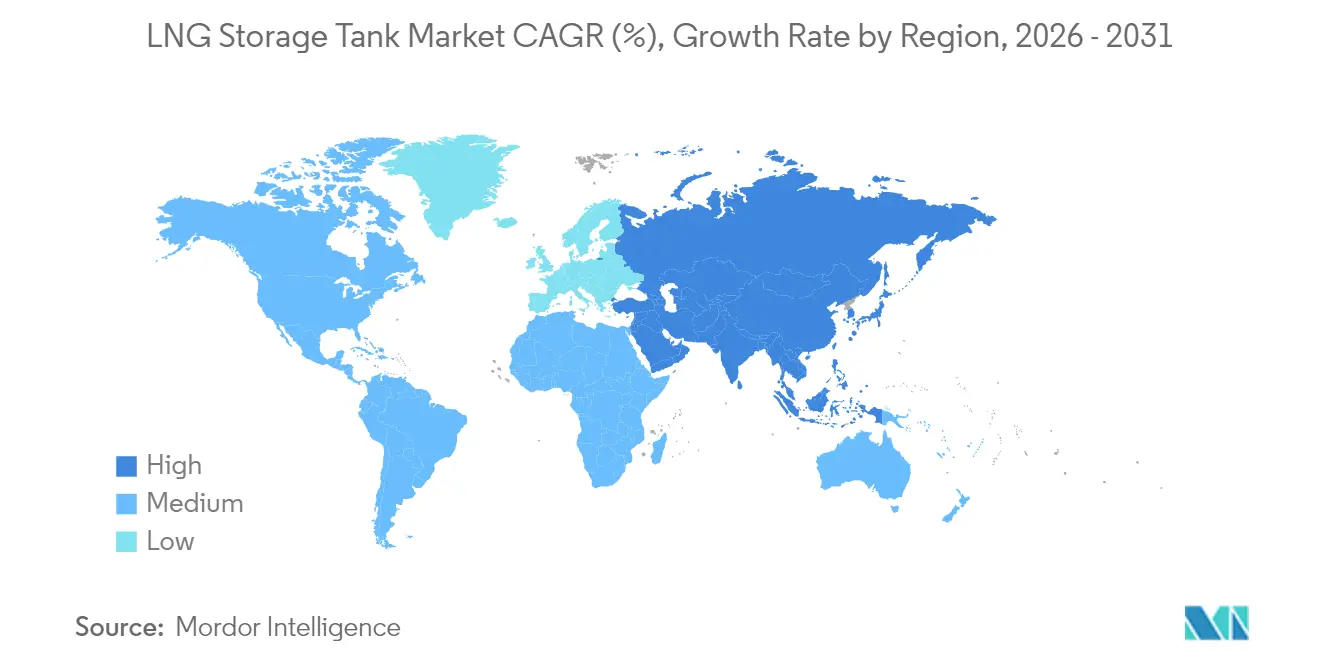
- By geography, the Asia-Pacific region commanded 44.10% of the revenue in 2025 and is expected to show the quickest regional expansion at a 8.94% CAGR.
Note: Market size and forecast figures in this report are generated using Mordor Intelligence’s proprietary estimation framework, updated with the latest available data and insights as of 2026.
Market Trends and Insights
Drivers Impact Analysis of LNG Storage Tank Market*
| Driver | (~) % Impact on CAGR Forecast | Geographic Relevance | Impact Timeline |
|---|---|---|---|
| Expansion of LNG bunkering infrastructure for maritime decarbonization | 1.2% | Global, with early gains in Singapore, Rotterdam, Gibraltar | Medium term (2-4 years) |
| Growth in floating LNG import terminals (FSRUs) | 1.8% | APAC core, spill-over to Europe & Latin America | Short term (≤ 2 years) |
| Surge in Asian gas demand & energy security policies | 2.1% | Asia-Pacific, with secondary impact on Middle East suppliers | Long term (≥ 4 years) |
| Adoption of 9%-nickel cryogenic welding robots | 0.7% | Global, concentrated in Japan, South Korea, China | Medium term (2-4 years) |
| Modular prefabricated on-ground membrane tanks | 0.9% | North America & EU, expanding to APAC | Short term (≤ 2 years) |
| Small-scale LNG satellite hubs boosting Type-C demand | 0.8% | Global, with early adoption in remote regions | Medium term (2-4 years) |
| Source: Mordor Intelligence | |||
Expansion of LNG Bunkering Infrastructure for Maritime Decarbonization
International Maritime Organization emission caps are steering shipowners toward LNG propulsion, which is fostering the development of large-scale bunkering nodes in Singapore, Rotterdam, and the US Gulf. The American Bureau of Shipping anticipates that the LNG-powered fleet will exceed 1,000 vessels by 2027, a shift that is stimulating demand for high-pressure Type-C tanks capable of withstanding rapid cyclic loading[1]American Bureau of Shipping, “Global LNG Fleet Outlook,” eagle.org. Ports are racing to license bunker operators and add dedicated storage berths, which is accelerating project lead-times and encouraging modular tank packages that minimize quayside disruption. The Asia-Pacific region is moving at the fastest pace, thanks to dense feeder routes and flexible ship-to-ship transfers that require compact, high-turnover storage. Suppliers with proven membrane or cylindrical designs are capturing early contracts as charterers seek compatible, future-proof solutions.
Growth in Floating LNG Import Terminals (FSRUs)
Countries facing urgent supply gaps after the 2022 energy shock favor FSRUs, as build times of 18–24 months compare favorably with the 4–6 year horizon of onshore terminals. The U.S. Energy Information Administration estimates 2024 floating regas capacity at 7.8 billion cubic feet per day, or approximately 8% of global send-out [2]U.S. Energy Information Administration, “International LNG Import Terminals,” eia.gov. The new units ordered for Pakistan, Egypt, and Germany demonstrate the model’s portability and lower permitting requirements. Containment systems tailored to the dynamic motions of floating hulls—predominantly membrane variants—are consequently in high demand. Designers able to guarantee sloshing resistance while enabling high cargo turnover are winning the majority of EPC awards.
Surge in Asian Gas Demand & Energy Security Policies
Japan’s strategic LNG reserve plan and China’s target of 55 billion cubic meters of storage by 2030 are reshaping regional procurement cycles. Giant 230,000 m³ tanks under construction on China’s coast signal a sustained wave of full-containment orders. India’s public oil and gas (O&G) entities are doubling capacity at Ennore and increasing LNG’s share in the national mix. These measures enhance asset utilization, reduce payback periods, and strengthen the LNG storage tank market in the region over the long term.
Adoption of 9%-Nickel Cryogenic Welding Robots
Laser-guided robotic welding has cut person-hours and defect rates for 9%-nickel joints, as confirmed in peer-reviewed studies covering ASTM A553-1 plate behavior at -196 °C.[3]Metals Journal (MDPI), “Laser Welding Behavior of ASTM A553-1 at Cryogenic Temperatures,” mdpi.com Asian shipyards are leading the deployment of multi-axis robots to expedite the execution of QatarEnergy's carrier backlogs. The precision of controlled heat input mitigates the risk of hot cracking, thereby increasing fabrication yields and reducing the need for rework. Producers able to certify automated procedures are securing framework agreements with tier-one EPCs.
Restraints Impact Analysis of LNG Storage Tank Market*
| Restraint | (~) % Impact on CAGR Forecast | Geographic Relevance | Impact Timeline |
|---|---|---|---|
| Volatility in steel & nickel prices | -0.9% | Global, with acute impact on Asia-Pacific manufacturing | Short term (≤ 2 years) |
| Permitting delays for coastal tank farms | -0.6% | North America & EU regulatory jurisdictions | Long term (≥ 4 years) |
| Emerging underground LNG storage alternatives | -0.4% | Europe & North America, pilot projects in Asia | Long term (≥ 4 years) |
| Membrane-tank patent litigation narrowing supplier base | -0.3% | Global, concentrated in major shipbuilding nations | Medium term (2-4 years) |
| Source: Mordor Intelligence | |||
Volatility in Steel & Nickel Prices
Nickel content up to 9% makes raw material swings a key cost factor, with Argus assessments showing spot nickel prices gyrating by more than 35% during 2024. For a 180,000 m³ full-containment tank, plate costs can equate to 45% of delivered EPC value, leaving fabricators exposed when hedging fails. Some Asian mills are trialing 7%-nickel TMCP plate to reduce alloying cost without losing low-temperature toughness, and EPCs are locking in longer-term supply contracts to stabilize bids.
Permitting Delays for Coastal Tank Farms
In North America, county-level and federal reviews must reconcile consultations regarding dredge, wetland, and indigenous lands. Projects like Texas LNG have postponed first gas beyond 2029 as legal appeals proceed. Europe confronts similar opposition, with environmental groups challenging German coastal terminals. Developers are padding schedules by a year or more, trimming near-term demand for large-volume storage.
*Our forecasts treat driver/restraint impacts as directional, not additive. The impact forecasts reflect baseline growth, mix effects, and variable interactions.
LNG Storage Tank Market Segment Analysis
By Containment Type:
Full containment remains the benchmark while membrane tanks gain momentumFull containment systems accounted for 41.75% of 2025 revenues, thanks to robust safety credentials and regulatory familiarity. Operators servicing high-throughput import terminals value the double-wall configuration that confines spills and simplifies maintenance. The LNG storage tank market continues to witness consistent specifications for 160,000 m³–230,000 m³ units at new Chinese, Japanese, and Indian sites, affirming confidence in the design. Membrane tanks, favored for floating and modular projects, are projected to log an 11.02% CAGR through 2031, reflecting yard preferences for faster assembly and superior volumetric efficiency. During 2025-2027, floating regas deployments in Germany and Brazil are expected to anchor further membrane conversions.
Membrane suppliers are investing in sloshing research and barrier-foil alloys to extend design life beyond 40 years. GTT’s NEXT1 earned major approvals and several Asian yard orders, signaling broader acceptance. Single containment persists in niche peak-shaving plants where cost is a primary consideration, while concrete in-ground concepts are employed in geologies that allow for mined cavern approaches. Overall, the LNG storage tank market is likely to strike a balance between proven full-containment safety and membrane-driven speed and footprint gains as developers optimize their designs by project context.
By Tank Type:
Type-A leadership meets accelerating Type-C uptakeType-A rectangular tanks held a 39.12% share in 2025, dominating land-constrained terminals that utilize their high space efficiency. Mature fabrication lines in Korea, China, and Europe maintain a competitive cost per cubic meter, and retrofits of vapor handling gear extend asset value. Yet small-scale distribution networks and bunkering hubs propel Type-C cylinders at a forecast 10.05% CAGR. Their vacuum insulation slashes boil-off, supporting multi-stop fuel delivery with minimal loss.
Compact reliquefaction modules, showcased by Wärtsilä in the 4,000-40,000 m³ carrier range, pair naturally with Type-C to enable point-to-point logistics. Type-B spheres maintain a foothold in extreme-pressure contexts but face high capital expenditures and longer build schedules. Across various applications, developers are combining geometries: prismatic shore tanks at the jetty head, cylindrical lag tanks on bunker barges, and spheres on older FLNG conversions, reflecting the diverse service envelopes within the LNG storage tank market.


By Material:
9%-nickel steel dominates while aluminum pulls ahead in weight-critical usesHolding 51.82% of 2025 revenue, 9%-nickel steel remains the gold standard for cryogenic durability and well-characterized weldability. Comprehensive fracture-mechanics data facilitate regulatory acceptance, and global plate capacity supports high-volume mega-projects. However, volatile nickel prices spur the development of alternatives. Aluminum alloys, with an 10.92% CAGR outlook, are gaining favor in marine spheres and mobile ISO containers, where lower density translates into lighter hulls and chassis. Fiber-laser welding breakthroughs for high-manganese and 7%-nickel plates widen material choices and promise meaningful capital expenditure relief.
EPCs weigh trade-offs between higher raw cost and lifecycle savings from reduced painting and corrosion. Concrete, particularly prestressed variants paired with membrane liners, garners attention for seismically active regions and aesthetic constraints. Collectively, innovations keep the LNG storage tank market supplied with a diversified materials toolbox suitable for both mega-scale shore tanks and containerized micro-hubs.
By Location:
On-shore installations hold sway while offshore capacity surgesOnshore tanks contributed 65.54% of 2025 sales due to existing jetty networks, simpler maintenance, and integrated pipeline tie-ins. Brownfield expansions at legacy import terminals in Japan, South Korea, and Spain predominantly involve the addition of onshore units, leveraging shared boil-off recovery and nitrogen utilities. Meanwhile, offshore FLNG and FSRU capacity advances at a 13.18% CAGR, driven by countries seeking swift supply without land-use conflicts.
New-build floating hulls in the Middle East, West Africa, and Northern Europe often feature large membrane tanks that accommodate sloshing mitigation and warm-stacking flexibility. Leasing models lower upfront cash requirements, extending reach to emerging markets with limited sovereign credit. Over the forecast period, the LNG storage tank market is expected to see onshore volumes grow steadily, while the share of floating assets will increase as more hulls are rolled off order books.
By Application:
Import terminals stay dominant; marine bunkering acceleratesImport and regasification complexes retained a 42.60% share in 2025, anchored by Europe’s post-2022 diversification away from pipeline gas and Asia’s capacity additions. Baseload offtake and long-term contracts sustain bankable cashflows, reinforcing this segment’s prominence. Marine bunkering storage climbs at an 10.88% CAGR, powered by the IMO’s tighter sulfur and GHG limits and the rising fleet of LNG dual-fuel container ships and tankers.
Dedicated bunker ports, such as Rotterdam, Singapore, and Galveston, commission specialized cylindrical or membrane tanks to meet the quick-turn refueling windows. Peak-shaving units for gas utilities and satellite plants for remote mines round out demand, offering diversified revenue streams for EPC contractors. Collectively, these varied uses confirm sustained breadth across the LNG storage tank market.
Geography Analysis
APAC LNG Storage Tank Market
Asia-Pacific generated 44.10% of global revenue in 2025 and is on track for a 8.94% CAGR to 2031. China alone is building more than thirty new terminals, each equipped with multiple 220,000 m³ full-containment tanks, to safeguard against spot-market volatility. Japan’s newly approved strategic stockpile scheme mandates a standing cargo inventory, adding predictable drawdown and replenishment cycles to storage demand. India is doubling its Eastern-coast capacity and incentivizing city-gas distributors to charter floating storage, thereby broadening the addressable volume. Regional fabricators benefit from shorter logistics chains for plate and alloy supply, which compresses delivery times and solidifies the LNG storage tank market in the area.
Europe and North America LNG Storage Tank Market
Europe’s import capacity rose 34% between 2021 and the end of 2024 as Germany, France, and the Netherlands installed emergency FSRUs. Although send-out fell in 2024 due to mild weather curbing gas burn, regulators continue to approve incremental shore tanks sized for future hydrogen or ammonia blends. The policy push for ammonia-ready components has prompted revisions to the design of secondary barriers and boil-off systems. North America hosts the deepest project queue but faces challenges from litigation and federal reviews. Developers prolong schedules by 12–18 months, delaying construction plate demand but not eroding the underlying need for it.
MEA LNG Storage Tank Market
The Middle East and Africa are emerging growth poles. Qatar’s expanded North Field output will require new tankage at Ras Laffan to handle incremental trains, while the UAE’s Ruwais project awards EPC contracts for dual 200,000 m³ cryogenic tanks delivering by 2029. Africa’s FLNG wave will bring floating hulls fitted with multi-row membrane tanks to Congo, Mauritania, and Senegal. Local governments view these assets as revenue boosters for exports and enablers of domestic power, positioning the LNG storage tank market for sustained momentum across multiple regions.
Mordor Intelligence provides coverage of the lng storage tank market across other key regional markets. Detailed country-level analysis extends to Singapore incorporating local coverage and market participation, as required.

Regulatory Landscape
Regulation for LNG storage tanks largely focuses on siting authorization, prescriptive safety codes, and periodic updates to technical requirements covering materials, welding, and spill containment. In the United States, LNG facilities fall under PHMSA safety rules in 49 CFR Part 193, while the Federal Energy Regulatory Commission (FERC) authorizes siting and construction of onshore and near-shore LNG import and export facilities under Section 3 of the Natural Gas Act, which in turn affects timelines for tank farms tied to liquefaction and regas terminals.
Across Asia, national technical and safety standards are increasingly formalizing requirements for LNG handling and storage, which helps standardize tank specifications across new terminals and bunkering nodes. India applies PNGRB technical standards and safety specifications for LNG facilities (including storage tanks), and Singapore refreshed its Technical Reference for inland LNG handling and storage through TR 74:2020(2025)+A1:2025 in February 2025, reinforcing operational controls for smaller inland and port-adjacent storage footprints.
Competitive Landscape
The industry shows moderate concentration. Five established suppliers control just over 70% of the installed capacity, yet recent transactions are reshuffling the alignments. Mason Capital’s USD 475 million purchase of CB&I’s storage arm yields a pure-play entity unfettered by EPC conglomerate cycles.[4]McDermott International, “CB&I Storage Platform Acquisition,” mcdermott.com GTT reinforces its membrane monopoly through incremental technology upgrades and consistent approvals, securing orders for next-generation carriers from Chinese yards. Chart Industries’ award for Woodside’s Louisiana LNG plant underscores its competitiveness in cold-box modules and prefabricated tanks.
Strategic alliances signal a push toward vertical integration and diversification. Kawasaki and CB&I collaborate on liquefied hydrogen containment, positioning themselves for the post-2030 low-carbon fuels market. Suppliers hedge nickel risk via tie-ups with upstream alloy producers, while yards invest in automated welding to boost throughput. Patent disputes remain a wildcard: protracted litigation could deter new entrants, concentrating intellectual property in a handful of licensors.
Regional challengers are climbing the value chain. Korean shipbuilders, leveraging government support, fabricate membrane panels in-house to capture more margin. Chinese fabricators expand 9%-nickel plate rolling capacity, shortening lead-times for domestic megaprojects. Although underground storage innovators pitch rock-cavern concepts, mainstream on-shore and membrane positions dominate procurement lists, keeping the LNG storage tank market in a state of disciplined competition.
LNG Storage Tank Industry Leaders
Chart Industries Inc.
CIMC Enric
Linde plc
McDermott (CB&I Storage)
IHI Corporation
- *Disclaimer: Major Players sorted in no particular order

LNG Storage Tank Market Companies Covered in this Report
- Chart Industries Inc.
- China International Marine Containers (CIMC Enric)
- Linde plc
- McDermott International
- IHI Corporation
- Wärtsilä Oyj
- Samsung Heavy Industries
- Mitsubishi Heavy Industries
- KOGAS Tech
- Air Water Inc.
- Isısan A.Ş.
- Cryolor SA
- INOX India Ltd.
- Wison Offshore & Marine
- Saipem SpA
- Technip Energies
- Victaulic Company
- Fives
- CSIC Hudong-Zhonghua
- GTT (Gaztransport & Technigaz)

Market Opportunities and Future Outlook
A near-term opportunity is emerging around standardized, multi-tank packages for newbuild and expansion export terminals, where owners are placing large, repeat orders across sites and phases. In May 2026, CB&I received an award to engineer, procure, fabricate, construct, and pre-commission five 50,000 m3 full-containment concrete LNG storage tanks for the Commonwealth LNG project in Cameron, Louisiana, which points to bundled tank scope favoring suppliers with proven full-containment execution, concrete cryogenic capability, and pre-commissioning depth.
Project financing and stakeholder structures are also creating room for developers and EPCs to package storage tanks alongside broader community and permitting alignment, especially in North America. LNG Canada announced an equity option agreement on July 14, 2026 with MNT Investments LP (representing five First Nations) to invest up to CAD 1 billion toward a planned LNG storage tank for a Phase 2 expansion, indicating that tank procurement, ownership, and project governance can be structured to support progression on large coastal projects. With floating regas build cycles and the continuing spread of LNG bunkering nodes, modularization and higher-turnover storage layouts remain a practical fit, alongside equipment suppliers able to deliver compact tanks and boil-off management systems aligned to port operating constraints.
Recent Industry Developments in LNG Storage Tank Market
- July 2026: LNG Canada signs an agreement giving five First Nations an option to invest up to C$1 billion to acquire the LNG storage tank for the Phase 2 Kitimat export facility. The agreement advances indigenous equity in export terminal infrastructure and may influence tank procurement and project timeline.
- October 2025: Chart Industries, Inc. is awarded a contract to supply air cooled heat exchangers, brazed aluminum heat exchangers, and cold boxes for Sempra Infrastructure’s Port Arthur LNG Phase 2 project in Texas. The award demonstrates Chart's capacity to deliver complete mid to large scale LNG storage and processing components for a major expansion project and reinforces its position in North American LNG infrastructure.
- July 2025: LNG Alliance / Chart Industries selected by LNG Alliance for IPSMR process technology and modular solution, including cold boxes, for the 7.8 MTPA Amigo LNG export facility in Mexico. The selection highlights growth of modular, scalable LNG solutions in a new export hub and strengthens Chart’s presence in the Latin American LNG market.


LNG Storage Tank Market Report Scope and Research Methodology
Market Definition and Coverage
For this study, the market covers revenue linked to engineering, manufacturing, and installation of LNG storage tanks used to store liquefied natural gas across import, export, peak shaving, and industrial uses, including tank systems used at terminals and related facilities.
Scope exclusions: We exclude LNG carriers and other marine cargo containment systems, along with small cryogenic cylinders meant mainly for portable distribution.
Segments Covered in This Report
- By Containment Type
- Full Containment Tanks
- Single Containment Tanks
- Membrane Tanks
- In-ground/Cryogenic Concrete Tanks
- By Tank Type
- Type-A (Prismatic)
- Type-B (Spherical)
- Type-C (Cylindrical, Vacuum-insulated)
- By Material
- Carbon Steel
- 9 %-Nickel Steel
- Aluminium Alloys
- Prestressed Concrete
- By Location
- On-shore Fixed Tanks
- Offshore FLNG/FSRU Tanks
- LNG Bunkering Barges
- By Application
- Liquefaction Plants
- Import and Regasification Terminals
- Peak-Shaving and Satellite Plants
- Marine Bunkering Facilities
- By Geography
- North America
- United States
- Canada
- Mexico
- Europe
- Germany
- United Kingdom
- France
- Russia
- Spain
- Rest of Europe
- Asia-Pacific
- China
- Japan
- India
- South Korea
- Singapore
- Malaysia
- Australia
- Rest of Asia-Pacific
- South America
- Brazil
- Argentina
- Rest of South America
- Middle East and Africa
- Saudi Arabia
- United Arab Emirates
- Qatar
- South Africa
- Rest of Middle East and Africa
- North America
Data Sources, Market Sizing, and Validation
Desk Research
Desk research starts with public signals that explain where LNG capacity is being added and what type of storage is typically built with it. We referenced sources such as the International Energy Agency, the US Energy Information Administration, UN Comtrade, World Bank indicators, and trade and safety publications from bodies such as ISO, which help anchor activity levels, trade flows, and compliance-led design needs.
Next, we review project announcements, terminal expansion notes, environmental filings, and company annual reports and investor decks to estimate likely tank counts, sizes, and typical construction timelines. Where available, subscription databases for company financials, project tenders, and shipment-level trade help us sanity check the scale and timing of large awards without relying on a single data point. The sources listed here are illustrative only, and many other public documents and data sets were used to fill gaps, validate assumptions, and clarify inconsistencies.
Primary Interviews and Surveys
Primary work is used to pressure-test the desk view with people who sit close to the buying cycle, design specs, and installation realities. We spoke with a mix of EPC viewpoints, tank fabricators, material and insulation linked experts, terminal operators, and consultants across APAC, EMEA, and the Americas, and then we used follow-ups to confirm typical capacity ranges, lead times, and pricing movements by tank type.
Distribution of primary research fieldwork respondents
| Company type | Respondent position | Region |
|---|---|---|
| Top tier: 34% | CXOs: 13% | APAC: 50% |
| Mid tier: 51% | Functional/Unit leaders: 40% | EMEA: 29% |
| Smaller Players: 15% | Managers: 47% | Americas: 21% |
Market-Sizing & Forecasting
Sizing is built by reconstructing the demand pool from LNG infrastructure build-outs, where planned liquefaction and regasification capacity, terminal additions, and storage expansion projects are translated into likely tank capacity additions and spending. This is where the top-down and bottom-up logic is used together: we first link macro signals to expected tank demand, then corroborate totals with selective supplier and project roll ups.
Key inputs include announced import and export terminal capacity (mtpa), the number of tank additions per project type, typical tank capacity bands (for full containment and other containment designs), average project cycle times, and material mix effects that influence cost (such as 9% nickel steel share and insulation requirements). Pricing is handled through ranges that are refreshed using recent bid and award commentary, and then adjusted by region using currency timing and construction cost indicators. Forecasts are created using scenario analysis so the model can reflect different commissioning slippages, new FIDs, and policy-driven LNG demand shifts, with scenario weights aligned to what interviewees describe as most realistic. Where project details are missing, we fill gaps using analog projects in the same region and similar capacity class, and the assumptions are flagged for validation checks.
Data Validation & Update Cycle
Validation happens in layers so individual assumptions do not quietly move the total. Model outputs are checked against independent signals such as LNG trade growth, terminal capacity additions, and the visible pipeline of tank construction awards, then outliers are reviewed to see if a single large project is being double counted or missed.
Before sign off, a second analyst reviews the core variables, math, and unit conversions, followed by targeted re-contacts when a major variance shows up by region, application, or tank type. Reports are refreshed annually, with interim updates when material events occur, such as large project approvals, cancellations, or sharp changes in input material pricing. Right before delivery, an analyst performs a fresh pass on key data points so clients receive the most current view available.
Mordor Intelligence's Lng Storage Tank Market Size Measured Against Other Published Estimates
Published market sizes for LNG storage tanks can look far apart because the underlying scope and the counting unit are not always the same. Differences also come from how teams treat project timing, how they convert capacity plans into tank demand, and how often assumptions get refreshed after new project awards.
LNG carriers and shipboard cargo containment often get blended into the same bucket as stationary tanks, but that item sits outside Mordor Intelligence's scope, which keeps the total tied to onshore and fixed facility storage spending. Other gaps usually come from whether a study counts only new build tanks versus also including major retrofits, how it handles lump sum EPC versus tank only pricing, and whether it uses a single global average price or region specific ranges that move with steel and labor conditions.
Benchmark comparison
| Source | Market Size | Gaps in Research Methodology |
|---|---|---|
| Mordor Intelligence | USD 16.45 B (2025) | |
| Industry Publisher A | USD 15.90 B (2024) | Uses an earlier base year and can understate the 2025 uplift if final investment decisions and award timing that occurred later are not fully reflected in the capacity to spend conversion. |
| Trade Release B | USD 5.71 B (2023) | Appears to focus more on modular and small scale tank demand, which can exclude large terminal scale tanks and therefore compress the market total even if growth rates look reasonable. |
When viewed together, the spread is mainly explained by what gets counted as a storage tank market and how project pipelines are translated into dollars for a given year. Our approach stays repeatable by tying results back to capacity additions, project counts, and pricing ranges that can be rechecked as new awards and commissioning updates are released.


Key Questions Answered in the Report
What is the current value of the LNG storage tank market?
The market stands at USD 17.78 billion in 2026 and is forecast to hit USD 26.27 billion by 2031.
Which region generates the highest demand for LNG storage tanks?
Asia-Pacific leads with 44.10% of global revenue in 2025 and is growing at a 8.94% CAGR through 2031.
Why are membrane tanks gaining traction?
Membrane designs offer superior space efficiency and accelerated installation, driving an 11.02% CAGR that outpaces other containment types.
How does steel and nickel price volatility affect tank costs?
Nickel fluctuations can push plate costs to nearly half of total tank expense, pressuring EPC margins and encouraging alloy innovation.
What role do floating storage and regasification units (FSRUs) play?
FSRUs shorten build-times to under two years, giving nations rapid import capacity and fueling a 13.18% CAGR in offshore tank demand.
Which tank geometry is preferred for small-scale LNG distribution?
Vacuum-insulated Type-C cylindrical tanks dominate satellite hubs and bunkering services because they handle higher pressures and lower boil-off losses.
Page last updated on:


 Your data is secure and never sold or shared.


