
Liver Diseases Therapeutics Market Size and Share
Market Overview
| Study Period | 2020 - 2031 |
|---|---|
| Market Size (2026) | USD 25.08 Billion |
| Market Size (2031) | USD 35.33 Billion |
| Growth Rate (2026 - 2031) | 7.09 % |
| Fastest Growing Market | Asia-Pacific |
| Largest Market | North America |
| Market Concentration | Medium |
Major Players *Disclaimer: Major Players sorted in no particular order Image © Mordor Intelligence. Reuse requires attribution under CC BY 4.0. | |
Liver Diseases Therapeutics Market Analysis by Mordor Intelligence
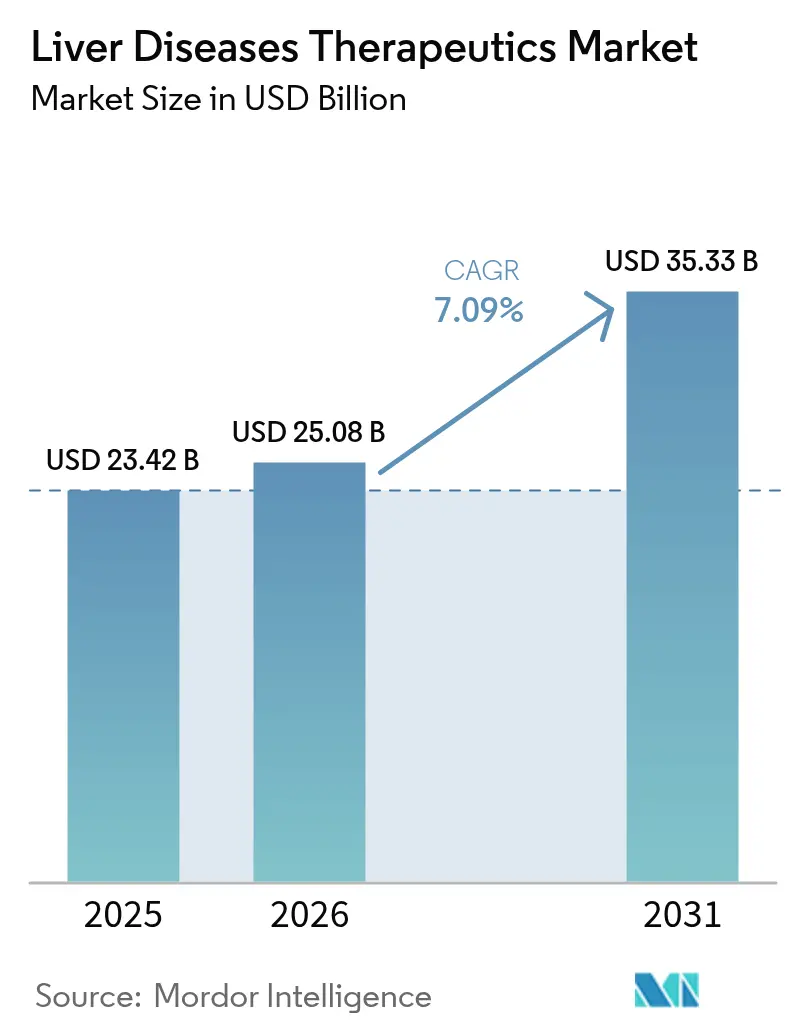
The Liver Diseases Therapeutics Market size is expected to grow from USD 23.42 billion in 2025 to USD 25.08 billion in 2026 and is forecast to reach USD 35.33 billion by 2031 at 7.09% CAGR over 2026-2031.
Robust demand is underpinned by breakthrough regulatory approvals, the rising global prevalence of viral hepatitis and metabolic dysfunction-associated steatotic liver disease (MASLD), and technological leaps in RNA-based delivery platforms. Manufacturers prioritise precision medicine, integrating companion diagnostics that stratify patients by viral genotype, fibrosis stage, or metabolic profile to maximise treatment benefit. Meanwhile, hospital formulary committees face escalating budget pressures as multi-drug regimens reach five-digit annual costs, prompting negotiations around risk-sharing contracts linked to sustained virologic response or histology-confirmed fibrosis reversal.
Key Report Takeaways
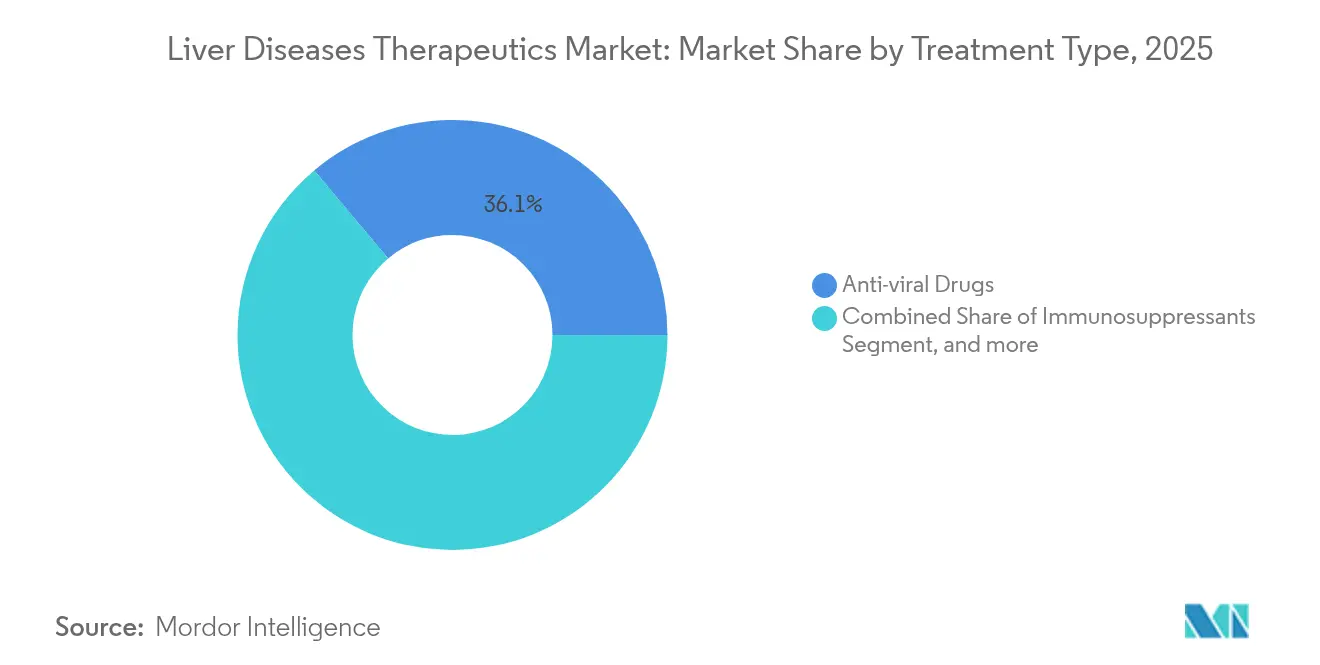
- By treatment type, anti-viral drugs commanded 36.12% of liver disease therapeutics market share in 2025, whereas antifibrotic/antisteatotic agents are projected to accelerate at a 10.22% CAGR through 2031.
- By disease type, viral hepatitis accounted for a 42.35% share of the liver disease therapeutics market size in 2025; MASLD is expanding at an 11.28% CAGR to 2031.
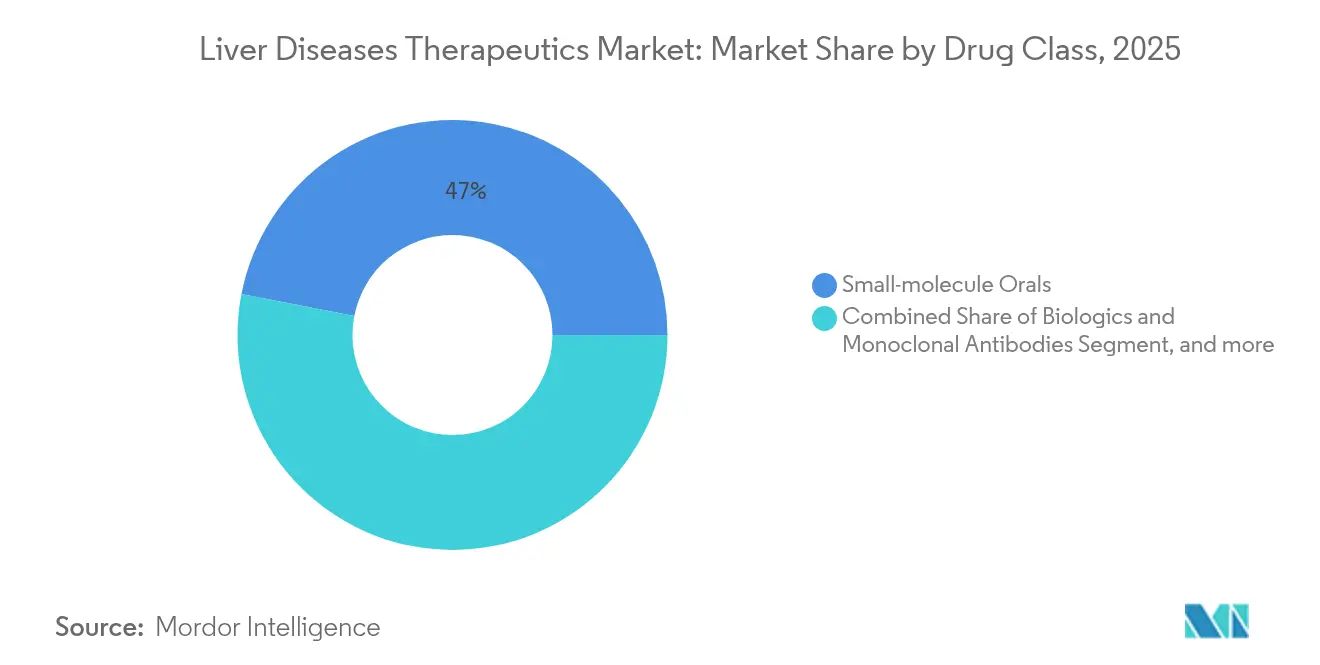
- By drug class, small-molecule orals captured 46.95% share of the liver disease therapeutics market size in 2025, while RNA-based therapeutics exhibit the fastest 11.92% CAGR through 2031.
- By route of administration, injectable formulations are advancing at a 13.10% CAGR to 2031, outpacing oral alternatives; orals captured 62.84% share of the liver disease therapeutics market size in 2025,
- By end user, hospitals held 53.05% of liver disease therapeutics market share in 2025, but specialty clinics are growing at an 10.74% CAGR through 2031.
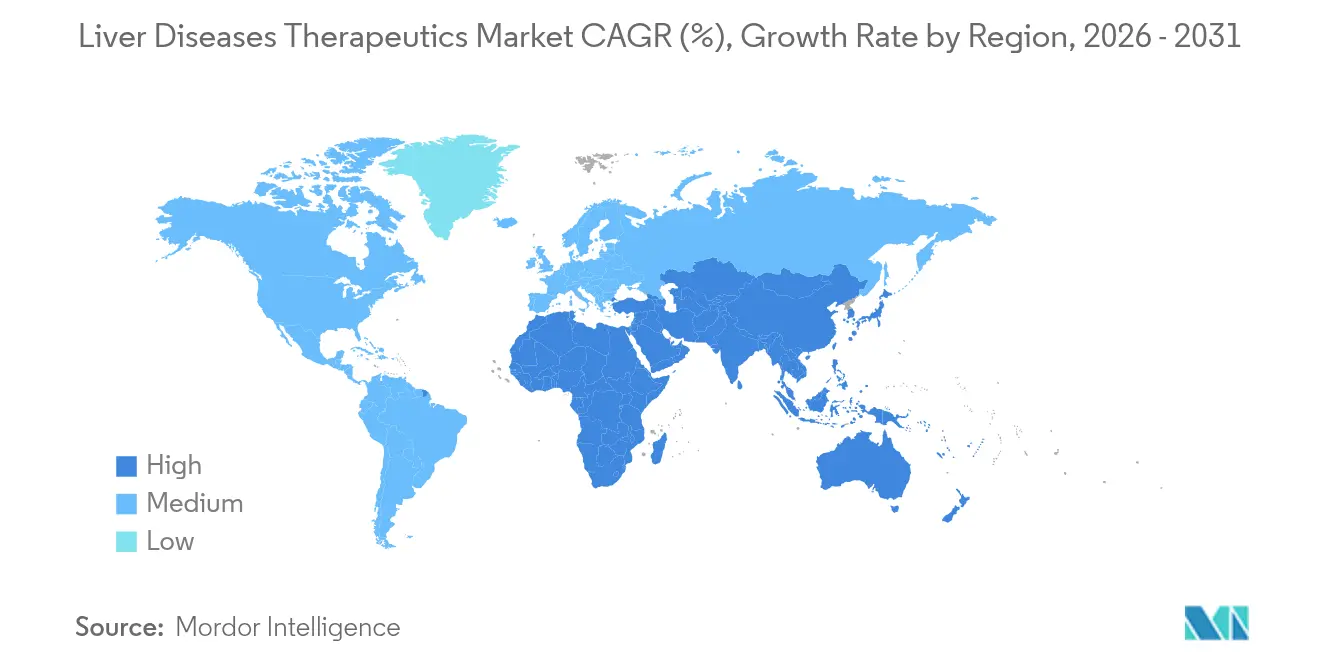
- By geography, North America held 42.10% of the liver disease therapeutics market share in 2025, whereas Asia Pacific exhibits the fastest regional CAGR at 12.45% to 2031.
Note: Market size and forecast figures in this report are generated using Mordor Intelligence’s proprietary estimation framework, updated with the latest available data and insights as of 2026.
Market Trends and Insights
Drivers Impact Analysis of Liver Diseases Therapeutics Market*
| Driver | (~) % Impact on CAGR Forecast | Geographic Relevance | Impact Timeline |
|---|---|---|---|
| Rise in the incidence of liver diseases | +1.2% | Global | Long term (≥ 4 years) |
| Alcohol consumption & obesity-driven MASLD | +0.8% | North America & Europe | Medium term (2-4 years) |
| Government vaccination & screening programs | +0.6% | APAC core, spill-over to MEA | Medium term (2-4 years) |
| Breakthrough NASH-specific approvals | +0.4% | Global | Short term (≤ 2 years) |
| AI-powered non-invasive diagnostics | +0.3% | North America & EU | Medium term (2-4 years) |
| Combination RNAi-immunotherapy pipelines | +0.2% | Global | Long term (≥ 4 years) |
| Source: Mordor Intelligence | |||
Rise in the Incidence of Liver Diseases
Hepatocellular carcinoma ranks as the third-leading cause of cancer mortality worldwide, while chronic liver disease affects more than 4.5 million Americans each year.[1] This epidemiological surge stimulates sustained uptake of antivirals, immunotherapies, and disease-modifying antifibrotics. Asia-Pacific carries a heavier viral hepatitis burden, whereas Western economies confront rising MASLD linked to obesity and diabetes. Aging populations compound disease prevalence because hepatic regenerative capacity declines with age. National payer systems respond by broadening screening programmes that detect disease earlier, expanding the addressable pool for curative therapies and boosting the liver disease therapeutics market.
Increase in Alcohol Consumption & Obesity-Driven MASLD
MASLD touches roughly 25% of the global population, making it the fastest-growing indication for liver transplantation. Clinical evidence from 2024 shows metabolic-syndrome patients possess triple the risk of advancing to stage 3-4 fibrosis, and concurrent alcohol use accelerates disease by seven years. Dual-pathway drugs, including FGF21 agonists and PPAR modulators, are now in late-phase trials. Regulators embrace adaptive designs that test combination regimens, acknowledging MASLD’s multifactorial nature. In the United States alone, MASLD-related spending exceeds USD 103 billion annually, prompting insurers to accept premium pricing for therapies that avert progression to end-stage disease.
Rising Government Vaccination & Screening Initiatives
WHO’s hepatitis elimination roadmap galvanises policy-makers to fund mass vaccination, point-of-care diagnostics, and procurement of pan-genotypic antivirals. China’s March 2025 approval of Encofosbuvir, its first locally manufactured hepatitis C cure, underscores how national mandates can catalyse domestic innovation and widen access.[2] The European Commission backed the TherVacB therapeutic vaccine programme, with Phase Ia data slated for 2025, illustrating public commitment to functional cures. Expanded screening uncovers asymptomatic cases, fuelling near-term growth in the liver disease therapeutics market.
Breakthrough Approvals for NASH-Specific Drugs
FDA clearance of the thyroid hormone receptor-β agonist Resmetirom in 2024 set a precedent for therapies that reverse steatohepatitis on histology. More than 50 late-stage NASH candidates are now competing, ranging from FGF21 analogues to dual PPAR agonists. EMA clearance of Elafibranor for primary biliary cholangitis the same year signals global regulatory alignment.[3] Shorter trial durations, because biopsy endpoints suffice, enable small biotech entrants to rival Big Pharma and quicken therapeutic variety within the liver disease therapeutics market.
Restraints Impact Analysis of Liver Diseases Therapeutics Market*
| Restraint | (~) % Impact on CAGR Forecast | Geographic Relevance | Impact Timeline |
|---|---|---|---|
| Adverse events & long-term safety issues | -0.5% | Global | Medium term (2-4 years) |
| Multi-regional regulatory timelines | -0.3% | Global | Short term (≤ 2 years) |
| Escalating therapy costs & reimbursement | -0.2% | North America & Europe | Long term (≥ 4 years) |
| Limited validated biomarkers | -0.1% | Global | Medium term (2-4 years) |
| Source: Mordor Intelligence | |||
Adverse Events & Long-Term Safety Concerns of Therapies
Immunosuppressive regimens elevate infection risk by 40%; new antifibrotic agents mandate cardiac and renal monitoring. FDA now demands five-year post-marketing safety studies for NASH drugs. Complex dosing schedules undermine adherence, and physicians adopt conservative prescribing until long-term real-world data mature. To curb attrition, sponsors are investing in predictive toxicology and microphysiological liver models that flag safety liabilities earlier in drug development.
Stringent, Multi-Regional Regulatory Approval Timelines
Distinct endpoint requirements across FDA, EMA, and Asian agencies add 12-24 months to global launches. The scarcity of expert liver pathologists delays biopsy read-outs, and local ethnic-specific pharmacokinetic studies are compulsory in several Asian markets, inflating trial budgets. While adaptive designs win acceptance, they require extended protocol negotiations, pushing first-patient-in dates later and capping short-term growth of the liver disease therapeutics market.
*Our forecasts treat driver/restraint impacts as directional, not additive. The impact forecasts reflect baseline growth, mix effects, and variable interactions.
Liver Diseases Therapeutics Market Segment Analysis
By Treatment Type:
Antivirals Dominate; Antifibrotics AccelerateAnti-viral therapies retained 36.12% share of the liver disease therapeutics market in 2025, propelled by pan-genotypic direct-acting antivirals that sustain 95% cure rates. Chronic hepatitis B suppression for 296 million carriers assures durable revenue. Meanwhile, antifibrotic/antisteatotic agents are projected to log a 10.22% CAGR to 2031, benefitting from Resmetirom’s first-in-class approval and a ballooning MASLD population. Immunosuppressants maintain a niche for autoimmune hepatitis, whereas oncology-focused immunotherapies increasingly supplant cytotoxic chemotherapies. Combination regimens blending metabolic correctors with anti-inflammatory agents are expanding prescribing patterns, lifting the liver disease therapeutics market size.
The competitive narrative is evolving as pipeline dispersion intensifies; more than a dozen dual-pathway candidates have entered Phase II within 18 months. Pay-for-performance contracts tied to non-invasive fibrosis regression scores bolster market uptake, especially among integrated health systems. As late-line antiviral resistance remains rare, lifecycle management pivots to fixed-dose combinations that lessen pill burden and shield franchises from generic erosion.

By Disease Type:
Viral Hepatitis Leads; MASLD Rising FastViral hepatitis contributed 42.35% of liver disease therapeutics market share in 2025 due to sheer patient volume and life-saving curative regimens. WHO elimination targets sustain procurement funding, and domestic production efforts in China and India lower per-course costs by 65%, broadening access and reinforcing the liver disease therapeutics market. MASLD, however, will post an 11.28% CAGR as obesity climbs worldwide. Steatotic liver disease’s multifactorial pathogenesis encourages combination therapy architectures that elevate average selling prices.
Alcohol-related liver disease receives fresh attention following FDA Breakthrough Therapy status for larsucosterol, which demonstrated 25% reduction in 90-day mortality in severe alcoholic hepatitis. Autoimmune liver diseases, although representing a smaller segment, achieve premium reimbursement for biologic agents that delay transplant need. Rare genetic and paediatric disorders benefit from orphan incentives that speed approvals and permit higher pricing benchmarks, cushioning research risk.
By Drug Class:
Small Molecules Prevail; RNA Therapeutics SurgeSmall molecules captured 46.95% of liver disease therapeutics market size in 2025 on the strength of oral antivirals and metabolic regulators requiring once-daily dosing. Their pharmacokinetic flexibility underpins broad utility across disease stages. RNA therapeutics, while accounting for a smaller base, will rise at a 11.92% CAGR, supported by GalNAc conjugates that direct siRNA to hepatocytes with 40-fold higher specificity. Regulatory confidence grows as accumulating real-world data corroborate sustained antigen knockdown without immunogenicity.
Biologic checkpoint inhibitors, including durvalumab plus tremelimumab, now anchor first-line therapy for unresectable hepatocellular carcinoma, unseating sorafenib. Cell and gene therapies remain early-stage but attract record venture funding; ex vivo CRISPR-edited hepatocyte implants entered Phase I in 2025, aiming to offer single-procedure cures. Portfolio managers increasingly co-develop oral back-ups to injectables in case payer resistance to high-cost parenteral regimens rises.
By Route of Administration:
Injectables Gain MomentumOral formulations still represent 62.84% market share, reflecting patient preference and decentralised care models. Yet injectables will clock a 13.10% CAGR to 2031 as biologics and RNA therapeutics demand parenteral delivery for systemic bioavailability. Monthly or quarterly subcutaneous versions improve adherence, and pen-injector devices enable at-home administration, reducing clinic visits. Hospitals expand infusion suites, while specialty pharmacies manage cold-chain logistics, widening distribution capacity for the liver disease therapeutics market.
Stakeholders anticipate a further shift toward ultra-long-acting depot injections that sustain drug exposure for six months, a move that could lower total cost of care by reducing monitoring frequency. Formulation scientists are also pursuing oral-to-injectable switches for legacy antivirals to extend patent life and bolster differentiation in crowded categories.
By End User:
Hospital Dominance Faces Rising Clinic PresenceHospitals controlled 53.05% of liver disease therapeutics market share in 2025, given their transplant infrastructure and multidisciplinary expertise. Complex inpatients with decompensated cirrhosis rely on intensive care resources available only in tertiary centres, ensuring hospitals’ central role. However, specialty clinics deliver an 10.74% CAGR through 2031, driven by value-based reimbursement that rewards outpatient management. Telehepatology follow-up visits surged 170% post-pandemic, enabling stable patients to remain in community settings.
Ambulatory surgery centres exploit minimally invasive ablation and endoscopic bariatric procedures that intercept disease progression, intersecting therapeutics with procedural care. Payers incentivise early discharge by reimbursing home-health nursing that administers injectable biologics, gradually shifting utilisation patterns and diversifying the liver disease therapeutics market.

Geography Analysis
North America Liver Diseases Therapeutics Market
North America captured 42.10% of revenue in 2025, underpinned by rapid adoption of newly approved NASH drugs and broad insurance coverage for pan-genotypic HCV antivirals. The presence of academic centres accelerates enrolment in late-phase trials, and tax credits support R&D. Yet ballooning therapy prices heighten scrutiny from pharmacy benefit managers that negotiate indication-based rebates.
APAC Liver Diseases Therapeutics Market
Asia-Pacific is the fastest-growing territory at a 12.45% CAGR to 2031. China alone houses 80 million chronic hepatitis B patients, and national reimbursement now covers first-line tenofovir generics, expanding the treated population. Japan’s fast-track review system shortens approval timelines for breakthrough biologics, while South Korea’s biotech tax incentives spur domestic RNAi pipelines.
EMEA and South America Liver Diseases Therapeutics Market
Europe witnesses steady, slower growth as health technology assessment agencies seek cost-effectiveness before authorising new entries. EMA alignment with FDA scientific advice has smoothed parallel submissions, but price-volume agreements can delay country-level launches by more than a year. Middle East & Africa and South America together account for minor share of global revenue; however, multilateral donor programmes and tiered pricing models improve access to WHO-preferred therapies, gradually enlarging the liver disease therapeutics market.
Regulatory Landscape
Regulatory momentum in liver diseases is increasingly shaped by expedited pathways for high-unmet-need indications, particularly MASH/MASLD, hepatitis delta virus (HDV), and cholestatic diseases such as primary biliary cholangitis (PBC). In May 2026, the US FDA approved Gilead Sciences' Hepcludex (bulevirtide-gmod) for chronic HDV infection in adults, reinforcing the role of accelerated and priority frameworks for severe liver disease subtypes with limited options. Earlier, in August 2024, the FDA granted accelerated approval to Gilead's Livdelzi (seladelpar) for PBC, showing how confirmatory evidence requirements and post-marketing commitments are being paired with earlier access for serious conditions.
In Europe, conditional and centralized review mechanisms remain core anchors for liver therapeutics commercialization. The EMA CHMP adopted a positive opinion in June 2025 recommending conditional marketing authorization for Madrigal Pharmaceuticals' Rezdiffra (resmetirom) for noncirrhotic MASH with moderate to advanced fibrosis. In parallel, the European Commission granted conditional marketing authorization for Ipsen's Iqirvo (elafibranor) for PBC in September 2024. Alongside product-specific decisions, public-health policy direction also remains important for viral hepatitis, with the US HHS Viral Hepatitis National Strategic Plan (2021-2025) setting federal commitments toward elimination by 2030 and supporting screening, linkage-to-care, and uptake of effective antiviral regimens.
Competitive Landscape
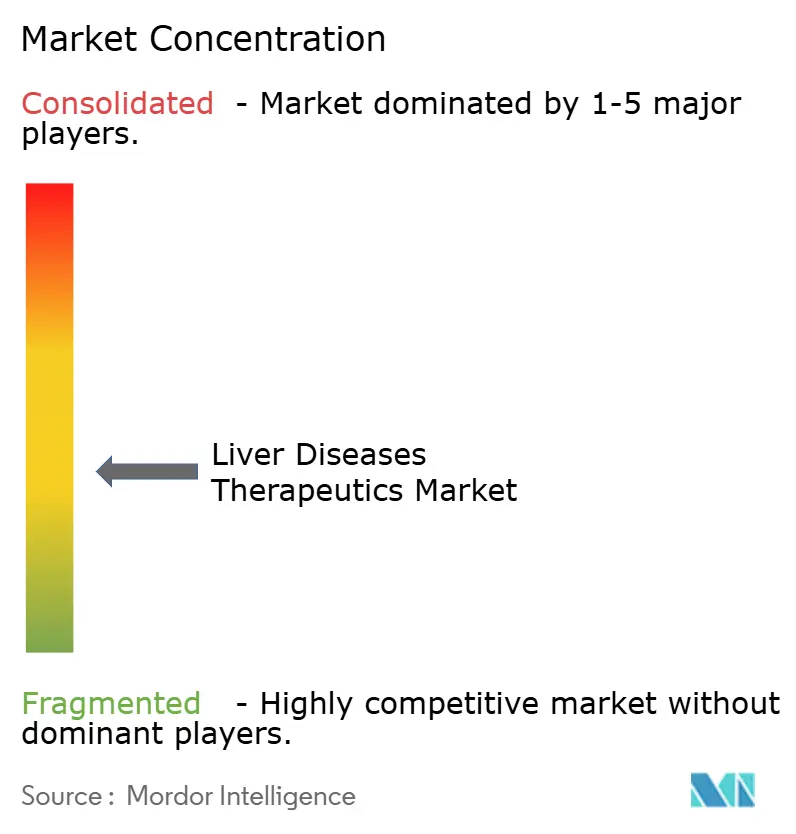
Moderate consolidation defines the sector. The top five manufacturers account significant share of global revenue, with Gilead Sciences and AbbVie leading the antiviral category, while Novo Nordisk, Eli Lilly, and Madrigal Pharmaceuticals spearhead the emerging metabolic arena. Recent strategic moves include GSK’s USD 1.2 billion acquisition of efimosfermin, expanding its FGF21 pipeline, and Boehringer Ingelheim’s USD 2 billion RNAi alliance with Ribo Life Science. These deals illustrate premium valuations for assets that differentiate on fibrosis reversal or once-monthly dosing convenience.
Firms deploy artificial intelligence to cut lead-optimisation time by 30%, and digital twins model disease progression to inform pivotal trial design. Intellectual-property battles intensify around lipid nanoparticle compositions and GalNAc linker chemistry, as delivery technology becomes a key competitive lever. Co-marketing partnerships emerge in Europe, where niche biotech innovators lack the field force scale to penetrate multiple national formularies.
As combination therapy paradigms mature, collaboration replaces rivalry; co-development contracts align profit-sharing to simultaneous launch of dual mechanisms, smoothing regulatory review and payer negotiations. Suppliers of companion diagnostics gain bargaining power, securing long-term kit-placement deals that lock laboratories into specific therapeutic brands and deepen ecosystem moats in the liver disease therapeutics market.
Liver Diseases Therapeutics Industry Leaders
-
Abbott Laboratories
-
Novartis AG
-
Gilead Sciences Inc.
-
Sanofi S.A.
-
Astellas Pharma Inc.
- *Disclaimer: Major Players sorted in no particular order
Liver Diseases Therapeutics Market Companies Covered in this Report
- Abbott Laboratories
- Abbvie
- Astellas Pharma
- Alnylam Pharmaceuticals
- Bristol-Myers Squibb
- Roche
- Gilead Sciences
- GlaxoSmithKline
- Merck
- Novartis
- Pfizer
- Sanofi
- Takeda Pharmaceutical Co.
- Endo International
- Provectus Biopharmaceuticals
- Intercept Pharmaceuticals
- Madrigal Pharmaceuticals Inc.
- Eiger BioPharmaceuticals Inc.
- Ionis Pharmaceuticals
- Aligos Therapeutics Inc.
Market Opportunities and Future Outlook
A key whitespace in liver diseases therapeutics is the expansion of disease-modifying options beyond antivirals into MASH/MASLD fibrosis regression, functional cure approaches in chronic hepatitis B, and broader choices for cholestatic and rare liver diseases. Recent regulatory actions and late-stage readouts show where competition and differentiated value propositions are concentrating: the FDA approval of the first MASH therapy (Rezdiffra, resmetirom) in March 2024 created an entry point for histology- and non-invasive-test-driven treatment pathways, while the EMA CHMP positive opinion for resmetirom in June 2025 supports a wider multinational access channel for the same disease area.
Investment also continues to support finite-duration regimens, as highlighted by May 2026 pivotal Phase 3 data from GSK for bepirovirsen reporting a 19% functional cure rate in chronic hepatitis B. Opportunities extend to cholestatic indications as well, where symptom control and biochemical response endpoints can help differentiate products and inform lifecycle strategies. In March 2026, the FDA approved GSK's Lynavoy (linerixibat) for cholestatic pruritus in adult PBC, complementing disease-modifying entrants such as seladelpar (Livdelzi) with FDA accelerated approval in August 2024 and elafibranor (Iqirvo) with conditional EU authorization in September 2024. On the innovation side, clinical programs increasingly emphasize non-invasive monitoring and multi-parameter endpoints, including the June 2026 Nature Medicine publication from the SYNCHRONIZE-MASLD Phase 3 trial for survodutide, which reported statistically superior reductions in MRI-PDFF-assessed liver fat versus placebo, and the May 2026 Phase 2b analyses for pemvidutide in MASH, which reported concurrent improvements across fat, inflammation, and qFibrosis-measured fibrosis regression. Together, these developments support commercial whitespace for therapies and companion diagnostics that operationalize non-invasive testing in routine care, alongside specialty-clinic delivery models that can support injectables and longitudinal monitoring at scale.
Recent Industry Developments in Liver Diseases Therapeutics Market
- June 2026: Gilead Sciences reported positive Phase 3 IDEAL results for Livdelzi (seladelpar) in primary biliary cholangitis, including statistically significant composite alkaline phosphatase normalization at 52 weeks. The update strengthens the product’s differentiation narrative in PBC and supports payer and guideline discussions focused on durable biochemical response and long-term outcomes.
- May 2025: GSK agreed to acquire efimosfermin from Boston Pharmaceuticals, expanding its liver disease portfolio with an FGF21 analog program. The move broadens GSK’s late-stage liver pipeline and shifts competitive dynamics in the antifibrotic/antiseatotic segment.
- March 2024: Gilead Sciences completed its acquisition of CymaBay Therapeutics for about USD 4.3 billion, bringing seladelpar into its liver disease portfolio. The transaction expanded Gilead’s footprint beyond antivirals into cholestatic liver disease and provided a near-term commercial platform to build a broader hepatology franchise.
Liver Diseases Therapeutics Market Report Scope and Research Methodology
Market Definition and Coverage
This market covers prescription therapeutics used to prevent, manage, or treat liver diseases across major care settings, and it is measured as revenues generated from drug sales at the market level.
Scope exclusions: This sizing excludes liver diagnostics, stand alone medical devices, transplant procedure costs, and general supportive hospital services not tied to a specific drug therapy.
Segments Covered in This Report
- By Treatment Type
- Anti-viral Drugs
- Immunosuppressants
- Targeted Therapy & Small Molecules
- Chemotherapy Drugs
- Antifibrotic/Antisteatotic Agents
- Vaccines
- Immunoglobulins
- By Disease Type
- Viral Hepatitis (A-E)
- Alcohol-Related Liver Disease (ARLD)
- Metabolic Dysfunction-Associated Steatotic Liver Disease (MASLD) / MASH
- Autoimmune Liver Diseases
- Genetic & Pediatric Disorders
- Other Disease Types
- By Drug Class
- Small-molecule Orals
- Biologics & Monoclonal Antibodies
- RNA-based Therapeutics
- Cell & Gene Therapy
- By Route of Administration
- Oral
- Injectable
- By End User
- Hospitals
- Ambulatory Surgery Centers
- Specialty Clinics
- By Geography
- North America
- United States
- Canada
- Mexico
- Europe
- Germany
- United Kingdom
- France
- Italy
- Spain
- Rest of Europe
- Asia-Pacific
- China
- Japan
- India
- Australia
- South Korea
- Rest of Asia-Pacific
- Middle East & Africa
- GCC
- South Africa
- Rest of Middle East & Africa
- South America
- Brazil
- Argentina
- Rest of South America
- North America
Data Sources, Market Sizing, and Validation
Desk Research
Desk work starts by building a clean disease and treatment map so every data point is tagged to a liver condition and a therapy class. We rely on public health and policy sources such as the World Health Organization, the US CDC, and the European Centre for Disease Prevention and Control for epidemiology signals and screening coverage. For demand context, we also review sources such as the US FDA and the European Medicines Agency for approvals and label language, and OECD health statistics for treatment access patterns.
To keep the commercial picture consistent with real product economics, we cross check company filings, annual reports, investor presentations, and reputable press coverage for product revenue cues and pipeline timing. When trade flow or supply questions come up, we refer to an import and export shipment level database for directional checks on active ingredient movement. We also use a patent database to understand when exclusivity cliffs may start impacting price and volume trends. The specific desk sources listed here are illustrative, and many other public references were used for collection, validation, and clarification.
Primary Interviews and Surveys
Primary work is used to pressure test the model with clinicians, hospital pharmacists, payor and reimbursement specialists, and executives from therapy suppliers and distributors. We focus discussions on treated patient shares, regimen shifts, and expected uptake for new launches across North America, Europe, Asia-Pacific, the Middle East and Africa, and South America. When gaps remain after desk checks, we revisit assumptions and then re-test them through follow up conversations, so we are not over relying on a single signal.
Distribution of primary research fieldwork respondents
| Company type | Respondent position | Region |
|---|---|---|
| Top tier: 28% | CXOs: 12% | APAC: 44% |
| Mid tier: 51% | Functional/Unit leaders: 40% | EMEA: 30% |
| Smaller Players: 21% | Managers: 48% | Americas: 26% |
Market-Sizing & Forecasting
Sizing is built using a top-down approach where prevalence and diagnosed pools are converted into treated cohorts by indication, and then extended into revenue using therapy mix, dosing duration, and average annual cost assumptions. The model is then checked with selective bottom-up approximations, such as sampled product revenues from public disclosures and channel checks on prescription intensity, which helps us adjust totals when treated rates look too high or too low.
Inputs are kept practical and tied to real market fingerprints, including diagnosed and treated patient counts for viral hepatitis, cirrhosis, and fatty liver conditions, therapy class shares (antiviral drugs, immunosuppressants, targeted therapy, chemotherapy drugs, immunoglobulin, vaccines), route splits between oral and injectable, and launch and loss of exclusivity timelines that impact price erosion. For forecasting, scenario analysis is used alongside simple multivariate regression, where drivers like treated share growth, access expansion, and expected price progression are varied based on what interviewees see in their local markets. Where a bottom-up cross check cannot be completed for a smaller country, we scale using transparent proxies like population, disease burden direction, and access level, and then confirm the result with at least one regional expert.
Data Validation & Update Cycle
Validation is done through triangulation across epidemiology, therapy mix, and commercial signals so one weak input does not dominate the final value. Analysts run variance checks across countries and therapy classes, and any sharp step changes are traced back to a specific event such as an approval, reimbursement change, or a major guideline shift. Before sign-off, the model and assumptions go through multi step internal reviews, and respondents are re-contacted if the updated numbers fall outside expected ranges.
Reports are refreshed annually, and interim updates are triggered when material events occur, such as a major launch, withdrawal, or a meaningful policy change. Right before delivery, a final pass is completed so clients receive the most current view that can be explained with repeatable steps.
Mordor Intelligence's Liver Diseases Therapeutics Market Size Versus Other Published Estimates
Published market values for liver diseases therapeutics can look far apart, even when they are talking about similar patient groups, because the inputs and timing are rarely aligned. Differences often come from what gets counted as therapeutics revenue, the base year selected, and how quickly new therapies are assumed to be adopted.
Diagnostics and procedure related spending are the biggest items that can quietly inflate totals, and those amounts can move differently than drug revenues during policy or guideline changes. Some estimates also blend prevention products like vaccines into the same total without consistently separating them by liver indication, and currency conversion timing can further widen the gap when regional growth rates are uneven. Procedure costs like transplant and hospital services sit outside Mordor Intelligence's scope, which keeps the number tied to drug sales and repeatable treated patient and therapy mix inputs.
Benchmark comparison
| Source | Market Size | Gaps in Research Methodology |
|---|---|---|
| Mordor Intelligence | USD 23.42 B (2025) | |
| Global Consultancy A | USD 25.34 B (2024) | Uses an earlier base year and a different forecast window, and the treatment class mapping is less explicit on what is separated from broader liver care spending, which can shift the topline. |
| Industry Research Group B | USD 20.31 B (2024) | Applies a lower starting value that can come from narrower included indications and a more conservative treated share and pricing progression, which reduces the near term total. |
The table shows that timing and scope alignment matter as much as growth assumptions. When the treated cohort build up, therapy class mix, and price progression are stated clearly, the final market value becomes easier to track, audit, and update as new clinical and policy signals emerge.
Key Questions Answered in the Report
What is the projected value of the liver disease therapeutics market by 2031?
The market is forecast to reach USD 35.33 billion by 2031, growing at a 7.09% CAGR.
Which treatment type currently leads in revenue?
Anti-viral drugs hold 36.12% of revenue, driven by chronic hepatitis B and C therapies.
Why is MASLD attracting rapid investment?
Rising global obesity and metabolic syndrome rates push MASLD to an 11.28% CAGR, incentivising multi-mechanism drug development.
How fast are RNA-based therapeutics expanding?
RNA agents are advancing at a 11.92% CAGR, enabled by GalNAc and lipid nanoparticle delivery innovations.
Which region will grow the quickest to 2031?
Asia-Pacific is set to expand at a 12.45% CAGR due to high viral hepatitis prevalence and policy-driven access improvements.
What recent deal illustrates rising asset valuations?
GSK’s USD 1.2 billion acquisition of efimosfermin underscores the premium commanded by breakthrough metabolic candidates.