
Liver Cancer Market Size and Share
Market Overview
| Study Period | 2020 - 2031 |
|---|---|
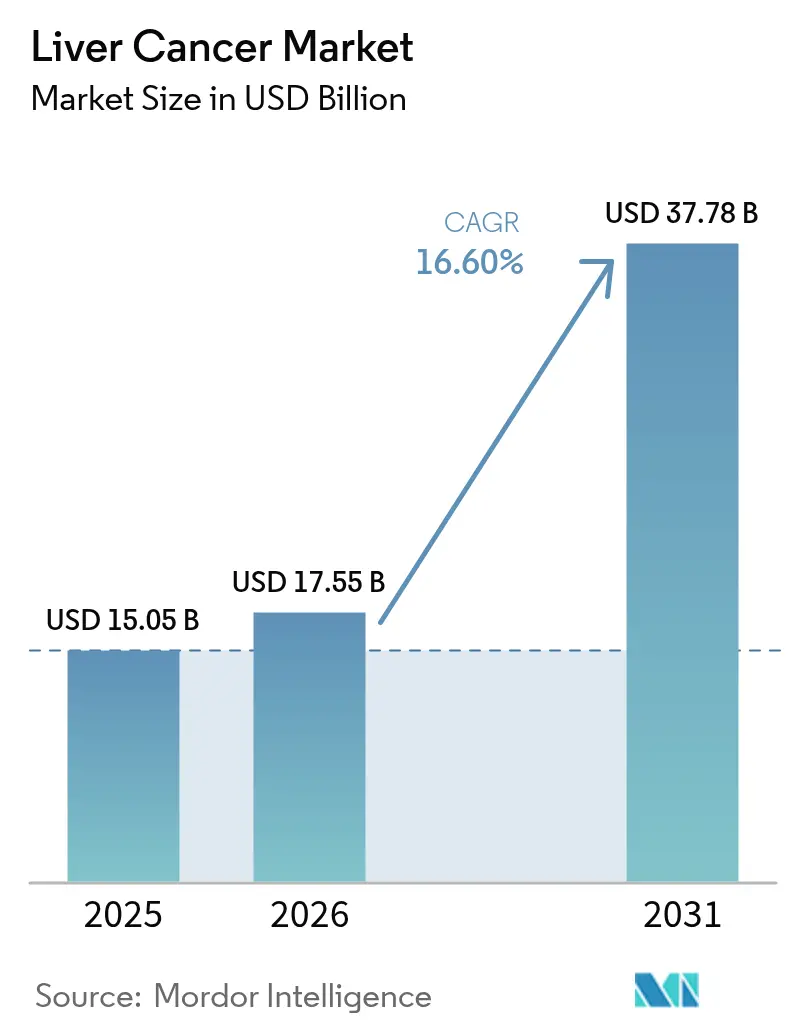
| Market Size (2026) | USD 17.55 Billion |
| Market Size (2031) | USD 37.78 Billion |
| Growth Rate (2026 - 2031) | 16.60 % |
| Fastest Growing Market | Asia Pacific |
| Largest Market | North America |
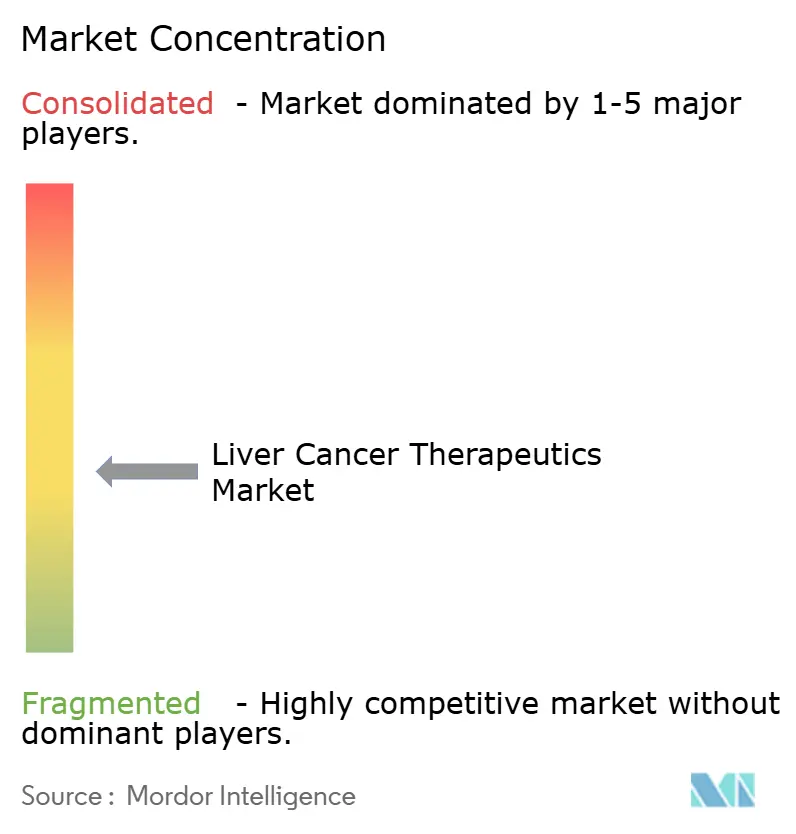
| Market Concentration | Medium |
Major Players *Disclaimer: Major Players sorted in no particular order Image © Mordor Intelligence. Reuse requires attribution under CC BY 4.0. | |
Liver Cancer Market Analysis by Mordor Intelligence
The liver cancer market size was valued at USD 15.05 billion in 2025 and estimated to grow from USD 17.55 billion in 2026 to reach USD 37.78 billion by 2031, at a CAGR of 16.60% during the forecast period (2026-2031). Strong momentum is arising from dual-checkpoint immunotherapy approvals, the rapid uptake of targeted agents, and broader reimbursement for combination regimens that unite systemic and locoregional modalities. Expanded screening programs, AI-enabled diagnostics, and radiopharmaceutical innovations continue to expand the treatable patient pool, while digital pharmacies are reshaping drug access. Competitive intensity heightens as large pharmaceutical companies acquire radiopharma specialists and partner with manufacturing technology firms to shorten production cycles. The Asia-Pacific’s high hepatitis B prevalence and widening healthcare coverage position the region as the leading growth contributor, whereas North America retains scale advantages through its established clinical trial infrastructure and first-in-class launches.
Key Report Takeaways
- By cancer type, hepatocellular carcinoma held 74.88% of the liver cancer market share in 2025, while hepatoblastoma is projected to expand at a 19.18% CAGR to 2031.
- By 2025, chemotherapy commanded a 30.72% share of the liver cancer market size; meanwhile, targeted therapy is projected to advance at a 19.25% CAGR through 2031.
- By age group, adults accounted for 59.25% of the liver cancer market size in 2025, whereas the geriatric segment is projected to grow at a 18.83% CAGR between 2026 and 2031.
- By distribution channel, hospital pharmacies led with a 61.54% revenue share in 2025; online pharmacies are expected to grow at a 19.05% CAGR through 2031.
- By geography, North America captured 39.68% of the liver cancer market share in 2025, while the Asia-Pacific region recorded the fastest regional CAGR at 19.02% through 2031.
Note: Market size and forecast figures in this report are generated using Mordor Intelligence’s proprietary estimation framework, updated with the latest available data and insights as of 2026.
Market Trends and Insights
Drivers Impact Analysis of Liver Cancer Market*
| Driver | (~) % Impact on CAGR Forecast | Geographic Relevance | Impact Timeline |
|---|---|---|---|
| Surge in incidence of hepatocellular carcinoma | +4.2% | Asia-Pacific, Sub-Saharan Africa | Long term (≥ 4 years) |
| First-line approvals of dual checkpoint combos | +3.8% | North America, EU, spill-over to APAC | Medium term (2-4 years) |
| NAFLD/NASH conversion in obese cohorts | +3.1% | North America, EU, Middle East | Long term (≥ 4 years) |
| Reimbursement for TACE-IO protocols | +2.9% | US, Germany, Japan | Medium term (2-4 years) |
| AI-enabled ultrasound & liquid-biopsy uptake | +2.4% | North America, EU, pilots in APAC | Short term (≤ 2 years) |
| VC-backed radiopharma pipelines | +2.2% | US, Europe manufacturing hubs | Medium term (2-4 years) |
| Source: Mordor Intelligence | |||
Surge in Incidence of Hepatocellular Carcinoma (HCC)
Global hepatocellular carcinoma cases are projected to increase by 53.8%, from 905,347 in 2020 to 1,392,474 by 2040, underscoring the long-term demand for treatment solutions [1]. Asia-Pacific shoulders roughly three-quarters of chronic hepatitis B infections, while Mongolia registers the world’s highest age-standardized incidence. Rising metabolic dysfunction-associated steatotic liver disease (MASLD) in high-income economies adds a second growth pillar as obesity-linked HCC cases escalate, especially among younger cohorts in Northern Europe and parts of Asia. These epidemiologic shifts ensure durable expansion of the liver cancer market, reinforced by ageing populations and extended life expectancy in China, Japan, and Western Europe
Expanding First-Line Approvals of Drug Combos
The April 2025 FDA approval of nivolumab plus ipilimumab reset global first-line standards, yielding a 23.7-month median overall survival versus 20.6 months for sorafenib or lenvatinib monotherapy. Europe ratified the regimen two months later, triggering rapid guideline updates across national health systems. Positive EMERALD-1 and LEAP-012 readouts further validated integrating checkpoint inhibitors with anti-VEGF or locoregional treatments, lifting adoption curves and accelerating payer assessments. As reimbursement frameworks adapt, premium-priced combinations enlarge revenue pools and intensify R&D competition.
Rapid NAFLD and NASH Conversion into HCC in Obese Cohorts
NAFLD now affects nearly 30% of adults globally. FDA’s March 2024 clearance of resmetirom, the first NASH therapy, confirms commercial viability for agents that intercept fibrosis and HCC progression. Patients with NASH face a higher liver cancer risk, and diabetes compounds malignant transformation rates. Digital therapeutics such as the NASH App report high disease-activity improvement, suggesting telehealth can complement pharmacologic care.
Wider Reimbursement for Loco-Regional TACE-IO Protocols
Medicare, Japan’s SHI, and Germany’s statutory funds now reimburse TACE combined with immunotherapy after studies showed high durable remission rates in advanced HCC. China’s 2024 NRDL tender reduced prices of innovative oncology drugs by a large margin, widening access for combination regimens. United States CMS policy in 2025 permits separate payment for costly diagnostic radiopharmaceuticals, incentivizing precision imaging and treatment planning.
Restraints Impact Analysis of Liver Cancer Market*
| Restraint | (~) % Impact on CAGR Forecast | Geographic Relevance | Impact Timeline |
|---|---|---|---|
| Severe immune-related adverse events in cirrhotics | -2.8% | Regions with advanced cirrhosis burden | Short term (≤ 2 years) |
| High attrition in late-phase HCC trials | -2.1% | Global, notable in biotech-led programs | Medium term (2-4 years) |
| Sub-optimal surveillance in low-HDI nations | -1.9% | Sub-Saharan Africa, Southeast Asia, Latin America | Long term (≥ 4 years) |
| Price ceilings in China’s NRDL | -1.6% | China, spill-over to other emerging markets | Medium term (2-4 years) |
| Source: Mordor Intelligence | |||
Severe Immune-Related Adverse Events (irAEs) in Cirrhotics
Checkpoint inhibitor hepatotoxicity appears in 12.9% of cirrhotic patients, prompting 18% discontinuation in the nivolumab–ipilimumab arm of CheckMate-9DW. Geriatric cohorts show heightened vulnerability, necessitating biomarkers that predict irAE risk to maintain treatment uptake.
High Attrition in Late-Phase Trials
Tumor heterogeneity, underlying liver dysfunction and stringent endpoints contribute to elevated late-stage failure rates. FDA withdrawals of unverified oncology indications underscore the imperative for confirmatory evidence, pressuring biotech financing cycles and dampening near-term pipeline visibility.
*Our forecasts treat driver/restraint impacts as directional, not additive. The impact forecasts reflect baseline growth, mix effects, and variable interactions.
Liver Cancer Market Segment Analysis
By Cancer Type:
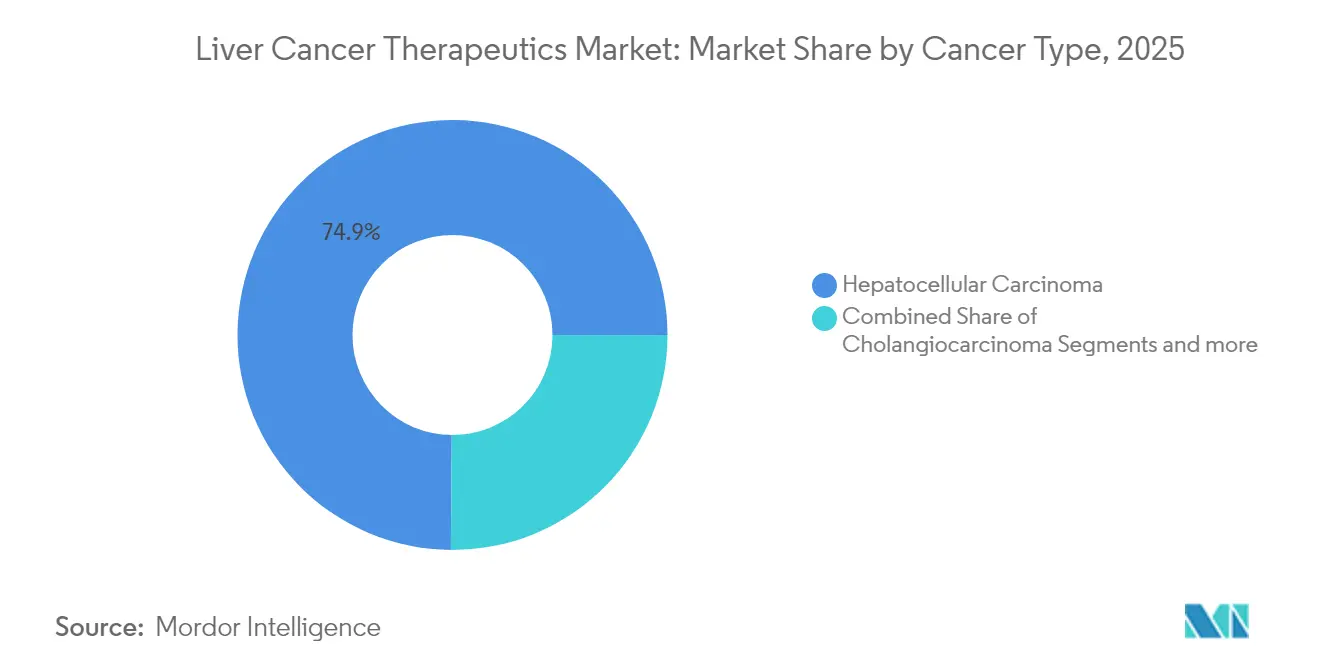
Dominance of HCC and Rapid Pediatric GainsHepatocellular carcinoma secured a 74.88% market share in the liver cancer market in 2025, validating its role as the primary value driver. This dominance reflects both incidence rates and the weight of R&D capital directed toward checkpoint combinations and anti-angiogenic backbones. The April 2025 dual-checkpoint approval intensified competitive differentiation and expanded frontline choices. Cholangiocarcinoma remains a minor but strategically important niche where fast-track designations for tumor-infiltrating lymphocyte products illustrate regulatory appetite for cell-based innovation.
Hepatoblastoma, though rare, is advancing at a 19.18% CAGR, buoyed by improved imaging and molecular profiling that allow early surgical candidacy and enrollment in pediatric immunotherapy trials. Gene-expression studies are propelling precision dosing, and CAR-T exploration for pediatric solid tumors is introducing potentially curative options. This tail-segment acceleration diversifies revenue sources and spurs partnerships with academic centers specializing in pediatric oncology.

By Therapy:
Targeted Agents Redefine Clinical AlgorithmsChemotherapy retained 30.72% of the liver cancer market share in 2025, due to its widespread availability and low acquisition cost, especially in resource-constrained regions. Yet, targeted therapy is growing at a 19.25% CAGR as oncologists prioritize precision over cytotoxicity. Atezolizumab–bevacizumab and durvalumab-bevacizumab combinations demonstrate sustained progression-free benefits, supporting expanded indications in guidelines. Radiopharmaceuticals, including actinium-225 constructs from RayzeBio, broaden the targeted spectrum with highly localized alpha-particle lethality.
Immunotherapy’s rise drives the shift toward multimodal regimens that integrate stereotactic radiation and transarterial procedures, enabling deeper responses while sparing healthy parenchyma. Chemotherapy now primarily features in combination schedules or as bridging therapy awaiting the initiation of immuno-targeted therapy.
By Age Group:
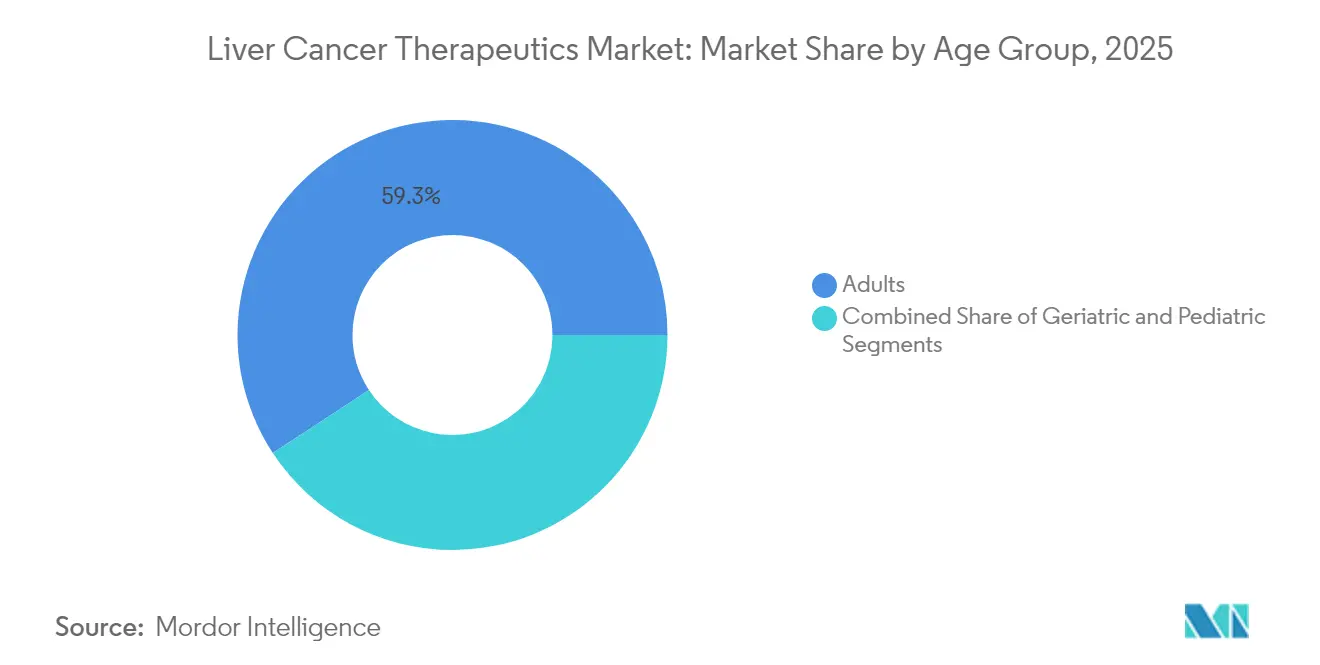
Geriatric Needs Shape ProtocolsAdults accounted for 59.25% of the liver cancer market size in 2025, reflecting their demographic dominance and established screening programs. The geriatric segment, however, grows at 18.83% CAGR owing to rising life expectancy and MASLD prevalence. Clinical data reveal that lenvatinib paired with a hepatic-artery infusion regimen (RALOX-HAIC) extends survival in patients older than 70 years without escalating toxicity.
Geriatric protocols emphasize the management of low-grade immune-related adverse events (irAEs) and telehealth monitoring. Remote platforms reduce hospital visits, which is particularly important for mobility-limited seniors. Pediatric care advances in tandem with the development of tumor-specific antigen targeting and the establishment of institutional networks that facilitate multicenter trials.
By Distribution Channel:
Digital Dispensing AcceleratesHospital pharmacies addressed 61.54% of prescriptions in 2025, maintaining dominance through embedded oncology practices and immediate administration capabilities. Yet online pharmacies are expanding swiftly at a 19.05% CAGR as telemedicine mainstreams follow-up care. Partnerships such as Onco360’s exclusive dispensing of new targeted agents highlight the strategic role of specialty e-pharmacies.
Telepharmacy regulations enacted during the pandemic remain in place, supporting cross-state prescription fulfillment in the United States. AI chatbots handle adherence queries and adverse-event triage, improving outcomes and reducing pharmacist workload.
Geography Analysis
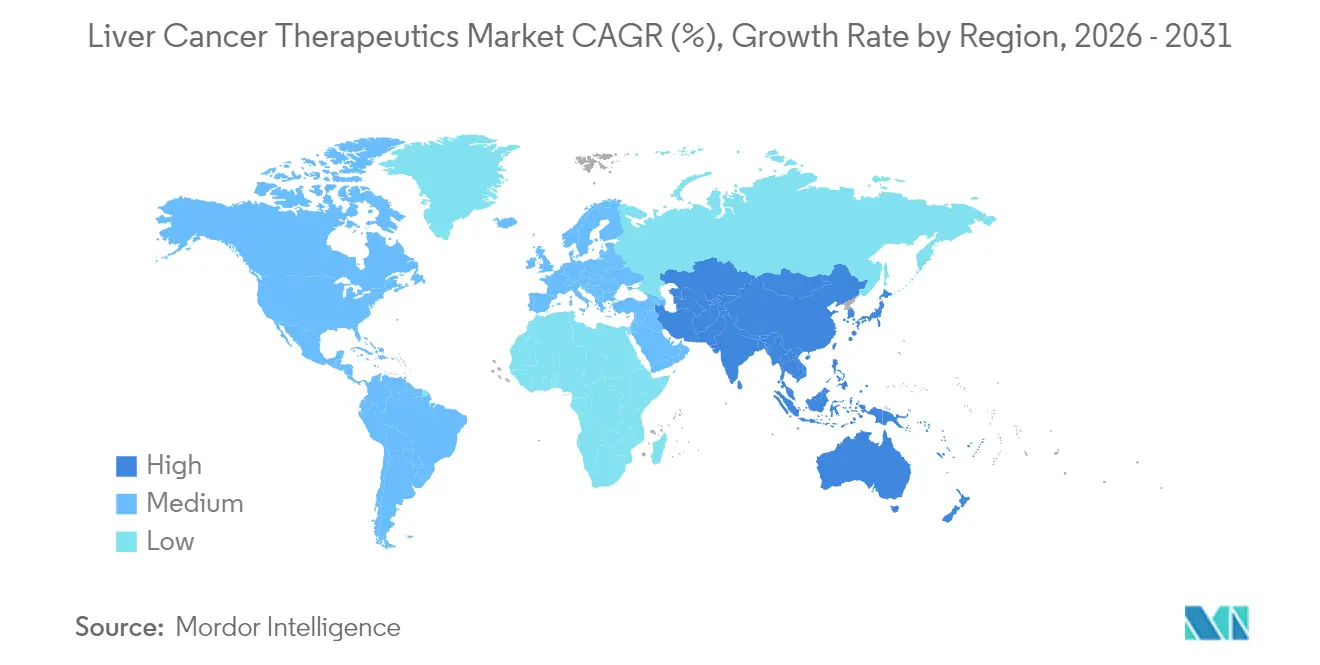
North America and Oceania Liver Cancer Market
North America commanded 39.68% of global revenue in 2025, buoyed by early checkpoint inhibitor uptake, generous insurance coverage, and leading clinical-trial density. FDA’s Project Orbis fosters simultaneous multinational review, accelerating first-in-class access for United States patients and partners in Canada and Australia. Inflation Reduction Act price-negotiation provisions, however, may curb list-price growth, encouraging companies to optimize launch sequencing.
APAC Liver Cancer Market
Asia-Pacific is projected to post a 19.02% CAGR through 2031, the fastest worldwide. China, holding more than 50% of incident cases, blends steep NRDL price reductions with rising urban insurance penetration, which expands volume to offset constrained margins. Japan and South Korea supply robust investigator networks, with roughly half of global HCC trials enrolling at Asia-Pacific sites, reducing development timelines.
Europe, LATAM and Middle East Liver Cancer Market
Europe maintains consistent uptake supported by centralized health-technology assessments and pathway harmonization. EMA’s endorsement of dual-checkpoint regimens streamlines regional reimbursement. Latin America and the Middle East deliver emerging upside as public–private partnerships expand radiotherapy capacity and viral-hepatitis elimination drives surveillance.
Mordor Intelligence provides coverage of the liver cancer market across other key regional markets, including Asia, each with their regulatory frameworks and demand patterns.
Regulatory Landscape
The regulatory environment for liver cancer continues to emphasize frontline combination regimens in hepatocellular carcinoma (HCC), with a clear anchor in April 2025 when the US FDA approved nivolumab plus ipilimumab for unresectable or metastatic HCC. In Europe, the EMA process also supported uptake of dual-checkpoint strategies through CHMP actions around nivolumab and ipilimumab in 2025, reinforcing guideline and reimbursement momentum for immunotherapy-based combinations in major developed markets.
In Asia-Pacific, China remains an important regulatory and access lever through National Medical Products Administration (NMPA) actions that formalize multimodal care in unresectable disease. A March 2026 NMPA approval of a supplemental new drug application for toripalimab in combination with bevacizumab for first-line unresectable or metastatic HCC underscores continued endorsement of PD-1 plus anti-VEGF backbones, while updates to product labeling and administration pathways, including FDA label updates affecting HCC administration instructions for atezolizumab-based products, point to ongoing workflow optimization in high-volume oncology centers.
Competitive Landscape
The liver cancer market hosts a balanced mix of multinational incumbents and agile biotechs. Bristol Myers Squibb’s USD 4.1 billion acquisition of RayzeBio anchors its move into actinium-225 radioligand therapy targeting solid tumors, including HCC. Roche and AstraZeneca reinforce leadership through broad immunotherapy portfolios, while Amgen and Tempest Therapeutics pursue bispecific T-cell engagers and small-molecule immune modulators.
AI-powered drug discovery partnerships proliferate; Cellares’ integrated manufacturing platform, joined by Bristol Myers Squibb, aims to industrialize cell therapy production and cut batch variability. Chinese innovators accelerate global competition with checkpoint combinations tailored to HBV-related HCC, gaining rapid NRDL listing after positive pivotal data.
Patent cliffs emerge for first-generation TKIs, stimulating biosimilar entries that could lower barriers in cash-pay markets. White-space opportunities persist in pediatric and ultra-rare hepatic tumors, where fast-track pathways and orphan pricing bolster return prospects.
Liver Cancer Industry Leaders
-
Bristol‑Myers Squibb Company
-
Eisai Co., Ltd.
-
Exelixis Inc
-
Merck & Co. Inc.
-
Bayer AG
- *Disclaimer: Major Players sorted in no particular order
Liver Cancer Market Companies Covered in this Report
- Roche
- Bayer
- Bristol-Myers Squibb
- Merck
- Pfizer
- AstraZeneca
- Eli Lilly and Company
- Novartis
- Abbvie
- Amgen
- Johnson & Johnson
- Eisai
- Exelixis
- Celsion (Imunon)
- Sanofi
- Gilead Sciences
- BeiGene
- Innovent Biologics
- Sumitomo Pharma
- Hepion Pharmaceuticals
- Abbott Laboratories
- Boston Scientific
- Siemens Healthineers
Market Opportunities and Future Outlook
Combination strategy breadth and sequencing remain key whitespace, especially where trial outcomes distinguish durable benefit from regimen complexity in advanced HCC. A near-term pipeline catalyst is Elevar Therapeutics acceptance by the FDA of the rivoceranib plus camrelizumab NDA resubmission for first-line unresectable or metastatic HCC, with the PDUFA date set for July 23, 2026. This keeps competitive momentum active across PD-1 plus anti-angiogenic and TKI-adjacent combinations beyond incumbent standards.
Earlier detection and treatment selection tools also offer opportunity upstream of therapeutics revenue, particularly in cirrhosis surveillance where ultrasound underperforms. Multicenter evidence published in 2026 on blood-based detection, for example HelioLiver Dx showing higher sensitivity than ultrasound in cirrhotic cohorts, and machine learning-driven cfDNA/ctDNA approaches, such as models reporting high early-stage sensitivity, supports continued development of liquid biopsy and AI-assisted workflows. In parallel, mixed late-stage readouts, including a 2026 Phase 3 report where adding atezolizumab to TKIs did not meet the primary overall survival endpoint in a post atezolizumab and bevacizumab setting, highlight the commercial value of biomarker-led positioning and line-of-therapy design over broad add-on strategies.
Recent Industry Developments in Liver Cancer Market
- May 2026: Bristol Myers Squibb and Hengrui Pharma announced global strategic collaboration and license agreements spanning 13 early-stage programs across oncology, hematology, and immunology, with total deal value cited up to USD 15.2 billion. The scope and scale reflect urgency at large-cap players to diversify oncology pipelines beyond established checkpoint inhibitor franchises, with potential downstream relevance for solid tumor combinations that include liver cancer treatment paradigms.
- October 2025: Merck and Eisai discontinued the Phase 3 LEAP-012 study of KEYTRUDA (pembrolizumab) plus LENVIMA (lenvatinib) used with TACE in unresectable, non-metastatic HCC after an interim analysis indicated the regimen was unlikely to improve overall survival. The decision underscores how difficult it is to extend immunotherapy and TKI combinations into locoregional plus systemic protocols, tightening evidence thresholds for future TACE-IO development and payer acceptance.
- September 2024: Eisai and Merck disclosed Phase 3 LEAP-012 results showing lenvatinib plus pembrolizumab with TACE improved progression-free survival (14.6 months vs 10.0 months for TACE alone) in unresectable, non-metastatic HCC. The data reinforced clinical interest in integrating systemic therapy with locoregional approaches and accelerated competitive activity around combination regimens that bridge interventional oncology and immunotherapy.
Liver Cancer Market Report Scope and Research Methodology
Market Definition and Coverage
This market covers revenues from prescription therapeutics used to treat liver cancer, counted at manufacturer selling prices and reported in USD across major regions. The focus stays on systemic drug treatment used in clinical care for liver tumors, including both established and newer drug classes.
Scope exclusions: We exclude liver cancer screening and diagnostic services, imaging equipment, surgery devices, and loco-regional embolization tools from the market value.
Segments Covered in This Report
- By Cancer Type
- Hepatocellular Carcinoma
- Cholangiocarcinoma
- Hepatoblastoma
- Other Primary Liver Cancers
- By Product Type
- Therapy
- Targeted Therapy
- Immunotherapy
- Chemotherapy
- Radiation Therapy
- Diagnostic
- Ultrasound Scans
- Confirmatory Needle Biopsy
- Endoscopic Ultrasound
- CT Scan
- PET Scan
- Other Diagnostic Types
- Therapy
- By Age Group
- Adults
- Geriatric
- Pediatric
- By Distribution Channel
- Hospital Pharmacies
- Retail Pharmacies
- Online Pharmacies
- By Geography
- North America
- United States
- Canada
- Mexico
- Europe
- Germany
- United Kingdom
- France
- Italy
- Spain
- Rest of Europe
- Asia-Pacific
- China
- Japan
- India
- Australia
- South Korea
- Rest of Asia-Pacific
- Middle East and Africa
- GCC
- South Africa
- Rest of Middle East and Africa
- South America
- Brazil
- Argentina
- Rest of South America
- North America
Data Sources, Market Sizing, and Validation
Desk Research
Desk research starts by building a clean disease and treatment context so the model inputs map to how liver cancer is actually managed before numbers are added. We use public cancer burden and treatment guidance sources, including IARC GLOBOCAN, the World Health Organization, the US CDC, and national cancer registries that publish incidence and mortality. Clinical practice and evidence direction are checked using sources such as the US FDA and EMA public drug labels, and peer reviewed journals for approval timing and therapy sequencing.
On the market side, we compile revenue signals from company annual reports, investor presentations, and press releases that describe oncology portfolios and regional exposure. Where needed, we use paid subscriptions for company financials and a patent database to confirm product ownership, launch timing, and basic technology direction, then cross-check against reputed healthcare news coverage. The desk sources listed above are illustrative, since many other public documents and datasets were reviewed for data collection, clarification, and validation.
Primary Interviews and Surveys
Primary interviews and surveys are used to pressure test what we saw in public sources, especially treatment mix shifts, uptake timing, and pricing direction by geography for systemic liver cancer drugs. We speak with a mix of pharma and channel stakeholders, and we include clinicians and reimbursement facing roles across major regions so assumptions can be corrected before totals are finalized.
Distribution of primary research fieldwork respondents
| Company type | Respondent position | Region |
|---|---|---|
| Top tier: 25% | CXOs: 17% | APAC: 45% |
| Mid tier: 55% | Functional/Unit leaders: 35% | EMEA: 29% |
| Smaller Players: 20% | Managers: 48% | Americas: 26% |
Market-Sizing & Forecasting
Sizing is built using a top down flow that reconstructs treated demand from liver cancer epidemiology, then converts it into drug revenue using therapy mix and pricing. Incidence and stage split are used to estimate the addressable patient base, and then the share that receives systemic therapy is applied based on care pathway realities and access conditions validated in interviews. To keep the estimate grounded, we also run selective bottom up checks using sampled therapy level pricing and expected patient volumes by region, then adjust where the two views do not align.
A few inputs drive results in this market: incidence by region, the split between hepatocellular carcinoma and other liver tumor types, stage at diagnosis, systemic treatment penetration, and the mix across targeted therapy, immunotherapy, chemotherapy, and radiopharmaceutical options. We track approval and label expansion timing, regimen duration assumptions, and basic pricing progression by market, because these can change the yearly revenue curve even when case counts move slowly. For forecasting, scenario analysis is used to reflect different adoption speeds for newer therapies, anchored by consensus views from primary discussions on how quickly guidelines and payer coverage tend to adjust.
Data Validation & Update Cycle
Validation is handled through stepwise checks, where model outputs are compared with independent signals such as public company oncology revenue commentary, regional treatment access indicators, and changes in approval timelines. If an output looks unusual, we reopen assumptions and trigger interview callbacks, especially for penetration rates, therapy mix shares, and pricing direction. Before sign off, another analyst reviews the calculations and the logic chain so the final numbers trace back to clear inputs.
Reports are refreshed annually, with interim updates made when material events occur such as major approvals, safety restrictions, or meaningful reimbursement changes. Right before delivery, we do a final pass to ensure the model reflects the latest public updates and the most recent set of validated assumptions.
Mordor Intelligence's Liver Cancer Market Size Versus Other Published Estimates
Published liver cancer market values often differ because the counted revenue pool is not the same, even when the title looks identical. The biggest swing usually comes from whether the estimate is drug only, treatment plus diagnostics, or a wider view that adds procedure and service revenues, and then currency timing and price assumptions add another layer.
Some external figures bundle screening, palliative care services, transplant related revenues, and procedure tools into one total. In Mordor Intelligence's model, the value is limited to prescription therapeutics for liver cancer and it excludes diagnostics and procedure device revenues, which keeps the total tied to drug treatment demand and therapy pricing.
Benchmark comparison
| Source | Market Size | Gaps in Research Methodology |
|---|---|---|
| Mordor Intelligence | USD 17.55 B (2026) | |
| Trade Publisher A | USD 3.37 B (2025) | Uses a broader definition that can include service revenues and related goods within care delivery, which lowers comparability versus a drug only therapeutics scope, and it is also reported for an earlier year. |
| Industry Research Portal B | USD 4.31 B (2025) | Tracks liver cancer drugs with a different forecast window and base year, and the total can shift based on how combination regimens and regional price progression are treated in the revenue build. |
The spread in the table is mainly explained by what is included in the revenue pool, and by the exact year being cited. Once scope is aligned to prescription therapeutics and the same time point is used, remaining differences usually come from therapy mix assumptions, duration of treatment, and how fast newer regimens are expected to be adopted across regions.
Key Questions Answered in the Report
What is the current size of the liver cancer market?
The market is valued at USD 17.55 billion in 2026 and is projected to reach USD 37.78 billion by 2031.
How fast is the liver cancer market growing?
It is expanding at an 16.60% CAGR, positioning it among the fastest-growing oncology categories.
Which therapy class is showing the highest growth?
Targeted therapy is the fastest-growing class, advancing at a 19.25% CAGR through 2031.
Which region offers the greatest growth potential?
Asia-Pacific posts the highest regional CAGR at 19.02%, driven by large hepatitis B populations and improving health-care access.
What recent regulatory milestone changed first-line treatment standards?
The FDA’s April 2025 approval of nivolumab plus ipilimumab established a dual-checkpoint immunotherapy option for treatment-naïve advanced HCC patients.
How are distribution channels evolving for liver cancer drugs?
Online pharmacies are growing at a 19.05% CAGR, supported by telemedicine, while hospital pharmacies remain the largest sales channel.