
Market Overview
| Study Period | 2020 - 2031 |
|---|---|
| Forecast Data Period | 2026 - 2031 |
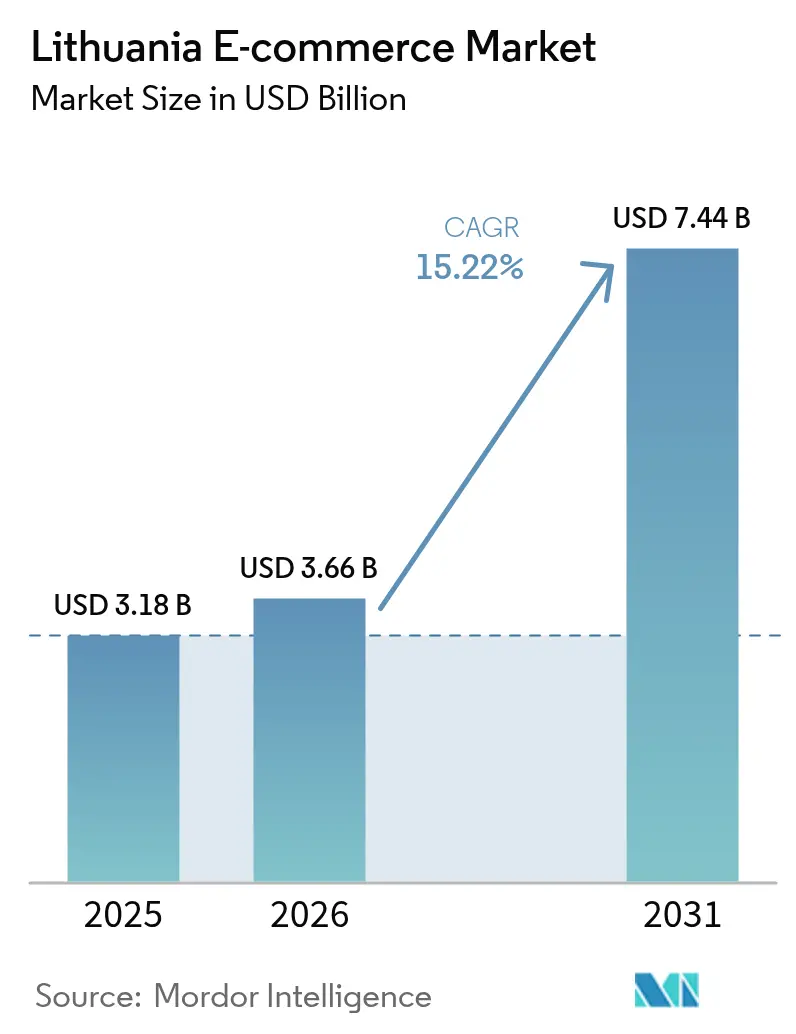
| Base Year Market Size (2025) | USD 3.18 Billion |
| Market Size (2026) | USD 3.66 Billion |
| Market Size (2031) | USD 7.44 Billion |
| Growth Rate (2026 - 2031) | 15.22 % |
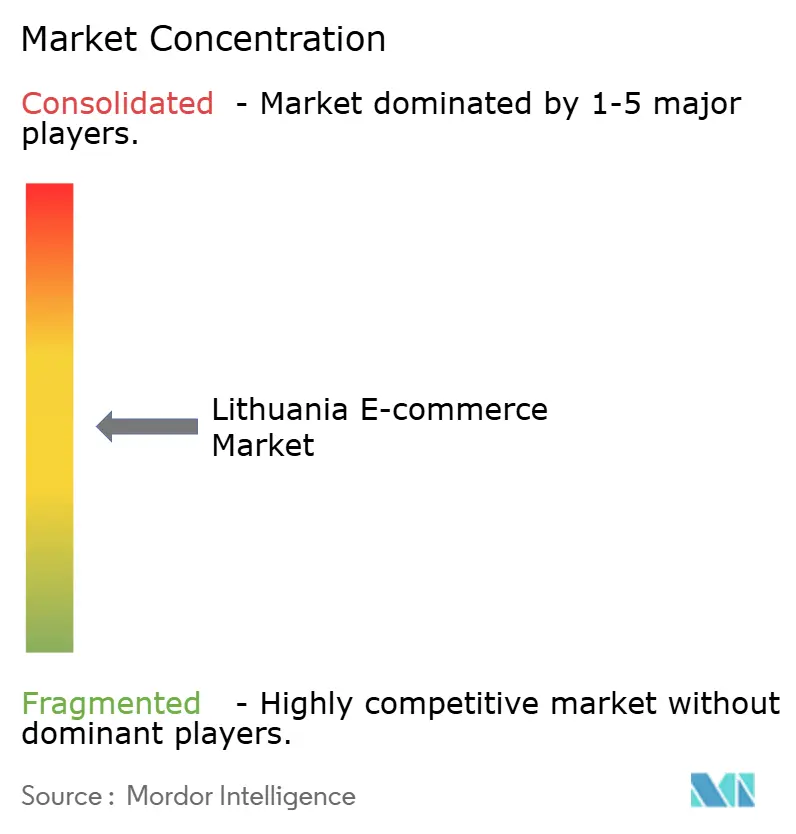
| Market Concentration | Medium |
Major Players *Disclaimer: Major Players sorted in no particular order Image © Mordor Intelligence. Reuse requires attribution under CC BY 4.0. | |
Lithuania E-commerce Market Analysis by Mordor Intelligence
The Lithuania e-commerce market size was valued at USD 3.18 billion in 2025 and estimated to grow from USD 3.66 billion in 2026 to reach USD 7.44 billion by 2031, at a CAGR of 15.22% during the forecast period (2026-2031). This growth stems from the nation’s 38.9% business e-sales penetration rate—the highest in the EU—and from regulatory alignment with the EU Digital Single Market, which simplifies cross-border trade. [1]European Commission, “E-commerce Statistics,” ec.europa.eu Mobile commerce dominates transactions, reflecting 63% of sales, while digital wallets accelerate payment conversion as consumers adopt online payments at a 29% penetration rate that outpaces the eurozone average. [2]European Central Bank, “Study on the Payment Attitudes of Consumers in the Euro Area (SPACE) 2024,” ecb.europa.eu Investments in parcel lockers, 5G coverage, and cold-chain logistics reduce delivery friction and extend service reach beyond Vilnius and Kaunas. Competitive intensity is rising as global platforms scale into Lithuania’s high-growth environment, yet data-privacy enforcement and elevated product-return rates can moderate momentum.
Key Report Takeaways
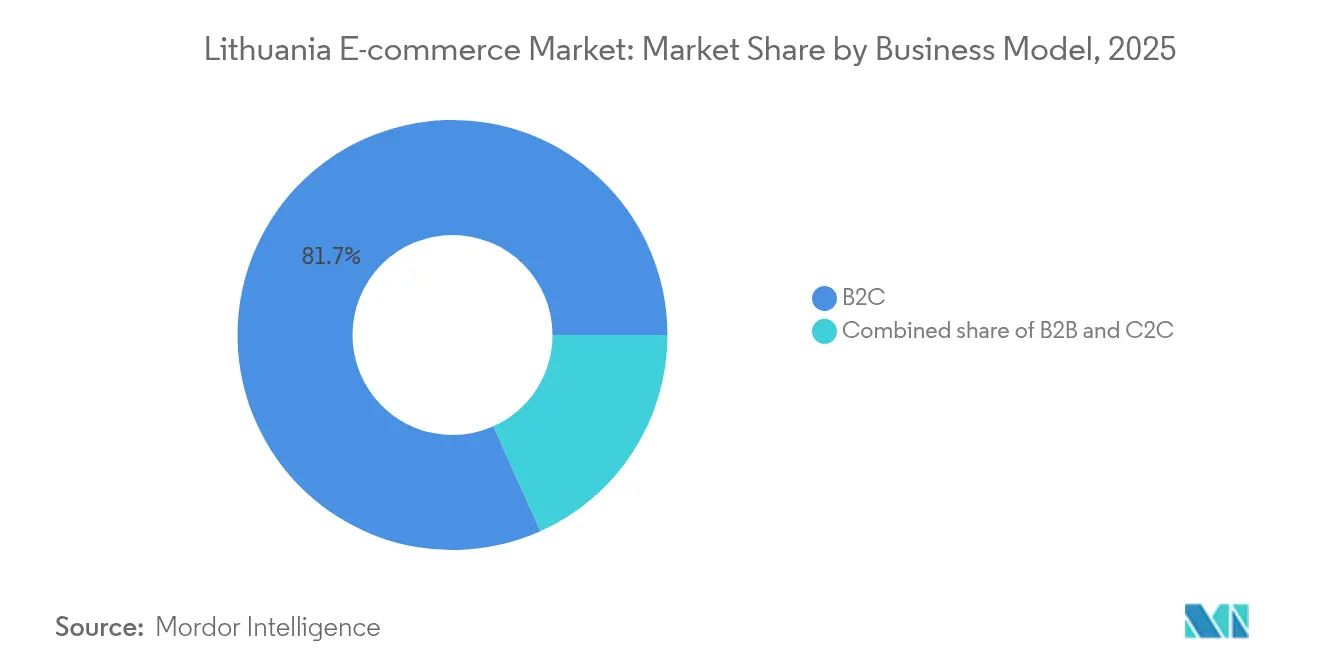
- By business model, the B2C segment held 81.70% of the Lithuania e-commerce market share in 2025, while C2C platforms are forecast to grow at an 18.35% CAGR through 2031.
- By device type, mobile commerce commanded 62.55% share of the Lithuania e-commerce market size in 2025 and is projected to expand at 16.85% CAGR to 2031.
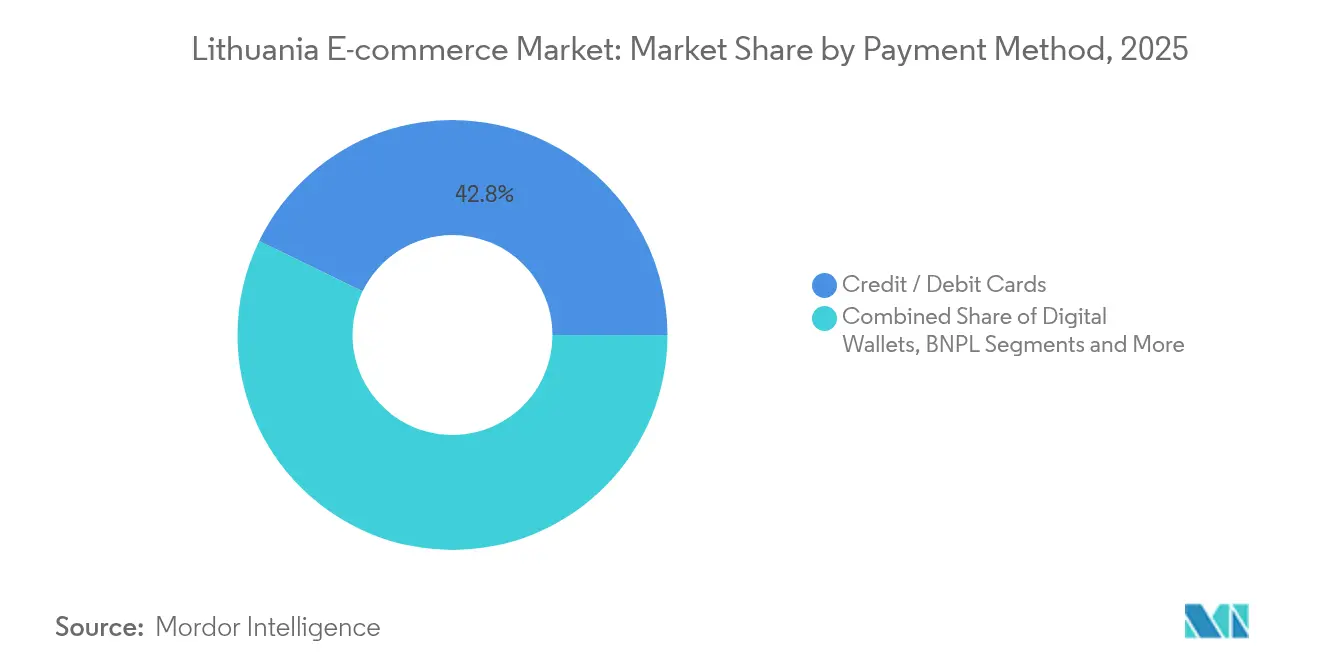
- By payment method, credit and debit cards led with 42.80% share of the Lithuania e-commerce market size in 2025, while digital wallets post the highest growth at 20.98% CAGR through 2031.
- By product category, fashion and apparel accounted for 26.40% of the Lithuania e-commerce market size in 2025; food and beverages are advancing at a 17.05% CAGR through 2031.
Note: Market size and forecast figures in this report are generated using Mordor Intelligence’s proprietary estimation framework, updated with the latest available data and insights as of 2026.
Lithuania E-commerce Market Trends and Insights
Drivers Impact Analysis*
| Driver | (~) % Impact on CAGR Forecast | Geographic Relevance | Impact Timeline |
|---|---|---|---|
| Growing smartphone penetration | +2.8% | National, concentrated in Vilnius and Kaunas urban areas | Medium term (2-4 years) |
| Expansion of mobile payments and wallets | +3.2% | National, with cross-border EU spillover effects | Short term (≤ 2 years) |
| Improved last-mile logistics infrastructure | +2.1% | National, rural area gains accelerating | Medium term (2-4 years) |
| EU Digital Single Market compliance gains | +1.9% | EU-wide, Lithuania benefiting from regulatory harmonization | Long term (≥ 4 years) |
| Parcel-locker network proliferation | +1.4% | Urban centers expanding to suburban areas | Short term (≤ 2 years) |
| Remittance-driven online gifting demand | +0.8% | National, diaspora-connected regions | Medium term (2-4 years) |
| Source: Mordor Intelligence | |||
Growing Smartphone Penetration
Lithuania’s mobile device share reached 63% in 2024 and is growing at 17.2% CAGR as 5G coverage broadens and banks refine mobile payment rails. Retailers leverage augmented-reality try-ons and push-notification campaigns that resonate with Gen Z audiences. Enterprise adoption still lags EU averages, suggesting catch-up potential for SMBs investing in responsive design. Vinted’s mobile-native model exemplifies monetization, supporting a 330% profit rise to EUR 76.7 million (USD 83.3 million) in 2024.
Expansion of Mobile Payments and Wallets
Digital wallets grow at 21.6% CAGR, aided by the Bank of Lithuania’s licensing of electronic money institutions such as Vinted’s subsidiary, which processes payments across EU markets. Wallet use boosts checkout conversion and lowers merchant fees compared with cards. Network effects intensify as more merchants adopt wallet acceptance, creating a virtuous cycle of consumer uptake. Regulatory clarity around strong customer authentication sustains trust, while buy-now-pay-later options diversify wallet functionality and attract millennial shoppers.
Improved Last-Mile Logistics Infrastructure
Lithuanian Post delivered 12 million parcels in 2024, a 20% jump, and targets 700 parcel lockers by 2029. Locker density reduces delivery times for rural consumers and supports temperature-controlled units for grocery e-commerce. Private couriers pursue route-optimization software to address customer complaints—28% concern improper delivery and 26% concern delays. Sustainability pilots such as reusable packaging, trialed with Vinted, reinforce brand equity while trimming waste.
EU Digital Single Market Compliance Gains
Harmonized digital-contract rules launched in 2022 streamline cross-border transactions and reduce legal costs for Lithuanian exporters. Although implementation gaps persist in VAT alignment, Lithuania’s early adoption provides first-mover advantage when selling into larger EU markets. The Digital Services Act adds compliance overhead for global platforms, potentially leveling the field for domestic firms.
Restraints Impact Analysis*
| Restraint | (~) % Impact on CAGR Forecast | Geographic Relevance | Impact Timeline |
|---|---|---|---|
| Data-privacy and cyber-security concerns | -2.4% | National, with EU-wide regulatory spillover | Short term (≤ 2 years) |
| High product-return rates | -1.8% | National, particularly affecting fashion and footwear categories | Medium term (2-4 years) |
| Limited Lithuanian-language coverage on global sites | -1.2% | National, affecting rural and older demographic segments | Medium term (2-4 years) |
| Warehouse and courier labour shortages | -1.6% | National, concentrated in logistics hubs and urban centers | Short term (≤ 2 years) |
| Source: Mordor Intelligence | |||
Data-Privacy and Cyber-Security Concerns
The State Data Protection Inspectorate issued EUR 2.38 million (USD 2.6 million) in fines to Vinted for GDPR breaches in 2024, heightening compliance risk perceptions. Authorities recorded 273 breach notifications affecting 1.47 million individuals, with human error causing 52% of incidents. Enhanced oversight raises operating costs for SMEs that lack in-house legal teams and may slow user acquisition if trust erodes.
High Product-Return Rates
Return rates reach 20% for clothing and 30% for footwear, inflating reverse-logistics expenses and hitting margins for fashion retailers. [3]European Environment Agency, “The Destruction of Returned and Unsold Textiles in Europe’s Circular Economy,” eea.europa.eu EU proposals forbidding destruction of unsold textiles will require companies to optimize demand planning and reuse programs. Lithuanian logistics providers also note that 21% of consumer complaints relate to damaged parcels, compounding profit leakage.
*Our forecasts treat driver/restraint impacts as directional, not additive. The impact forecasts reflect baseline growth, mix effects, and variable interactions.
Segment Analysis
By Business Model: C2C Platforms Challenge B2C Dominance
The Lithuania e-commerce market size for business-to-consumer channels represented 81.70% of 2025 revenue, illustrating legacy strength of traditional online retail. Consumer-to-consumer platforms, however, outpace the overall Lithuania e-commerce market with an 18.35% CAGR, propelled by Vinted’s EUR 813.4 million (USD 885.5 million) turnover and EUR 5 billion (USD 5.4 billion) valuation. Circular-economy preferences and thrifty Gen Z shoppers favor C2C marketplaces, while B2C operators face price-matching pressure and higher customer-acquisition costs.
B2C incumbents respond by layering premium services, private labels, and rapid delivery. Maxima Group’s BARBORA logged EUR 171.3 million (USD 186.5 million) sales in 2024 by widening product range and scaling dark-store logistics. Meanwhile, Lithuania’s 38.9% enterprise digitization rate signals latent B2B marketplace expansion potential, especially for industrial supplies and export-oriented SMEs.


By Device Type: Mobile Commerce Drives Digital Transformation
Mobile channels accounted for 62.55% of Lithuania e-commerce market share in 2025 and are expected to post a 16.85% CAGR, dwarfing desktop growth. Faster 5G rollouts enable richer content, while biometric authentication reduces cart abandonment. Desktop remains favored for high-ticket B2B orders and complex product configurations.
App-centric strategies unlock geofenced promotions, social-commerce tie-ins, and push-based re-engagement tactics. Yet 39% of Lithuanian firms still lack advanced mobile optimization, underscoring a capability gap that the Lithuania e-commerce market participants can exploit through SaaS storefront templates and no-code app builders. Emerging device categories such as smart TVs and voice assistants offer incremental reach, but their transaction share remains sub-5%.
By Payment Method: Digital Wallets Accelerate Traditional Card Displacement
Credit and debit cards controlled 42.80% of Lithuania e-commerce market size in 2025, but wallet penetration is expanding at 20.98% CAGR, eroding card share. Wallet providers capitalize on instant settlement and tokenized security, lowering fraud risk for merchants. Fast-payment rails also underpin buy-now-pay-later solutions that attract under-banked segments.
Cost advantages and one-click checkout foster convergence around a handful of wallet brands, potentially compressing acquiring margins. Interoperability across SEPA countries furnishes an export channel for Lithuanian fintechs, reinforcing the Lithuania e-commerce industry’s ecosystem depth. Cards remain relevant for travel and corporate spend where chargeback rights are critical.
By B2C Product Category: Food and Beverages Outpace Fashion Growth
Fashion retained 26.40% of 2025 Lithuania e-commerce market size, but high returns and sustainability scrutiny limit margin upside. Food and beverages exhibit the strongest trajectory at 17.05% CAGR, aided by cold-chain advances and active lifestyles seeking convenience. Consumer electronics register steady demand, reflecting Lithuania’s tech-savvy users, while furniture sales rise on home-office upgrades.
Maxima’s BARBORA enhances grocery margins through own-brand lines and temperature-controlled lockers. Conversely, fashion sellers pilot virtual fitting rooms to curb returns and align with the EU’s anti-waste agenda. Category leaders in the Lithuania e-commerce market integrate inventory analytics and dynamic pricing to balance stock risk with fulfillment speed.
Geography Analysis
Urban hubs provide the nucleus of spending as Vilnius and Kaunas benefit from higher broadband penetration, 65.2% employment, and 4.9% unemployment, enabling stable discretionary outlays. The Sostinės region posted a 20.37% enterprise birth rate in 2021, nearly double the EU norm, underpinning startup-driven demand for cloud commerce tools.
Suburban and rural zones increasingly access parcel lockers as Lithuanian Post targets 700 units by 2029, shrinking service gaps and reinforcing customer expectations for two-day delivery. Cross-border parcel flows topped 600,000 shipments to Latvia and Estonia in 2024, illustrating Baltic-wide integration of the Lithuania e-commerce market.
EU-level regulatory harmonization facilitates outbound expansion, yet VAT reconciliation and language localization remain barriers that vendors must navigate. Strengthening regional logistics corridors and leveraging free-trade zones around Klaipėda port will further broaden market coverage as China-EU rail links reroute cargo through the Baltics.
Regulatory Landscape
Lithuanian e-commerce operates under EU Digital Single Market rules, with national enforcement led by the State Consumer Rights Protection Authority (VVTAT) for consumer rights (including withdrawal and unfair commercial practices) and the State Data Protection Inspectorate for GDPR. From June 19, 2026, online shops must add an easily accessible electronic contract withdrawal button, which tightens UI and process expectations for B2C merchants.
On infrastructure and reporting, the State Tax Inspectorate (VMI) runs the i.MAS environment, including structured VAT reporting such as i.SAF/SAF-T, which anchors transaction reporting workflows for businesses selling online. For e-invoicing, B2G e-invoicing is mandatory through SABIS using PEPPOL, while B2B/B2C e-invoicing remains voluntary as of mid-2026, leaving uneven reporting maturity across merchant segments.
Value Chain Analysis
The value chain begins with merchants and brands running B2C webshops and C2C/B2B marketplace storefronts, supported by e-commerce platforms and enabling services such as digital payments, risk tools, and customer service operations. Key local demand aggregators and assortment owners include Pigu.lt, Senukai.lt, Barbora.lt, Varle.lt, and the C2C marketplace Vinted, which together shape seller onboarding, catalog visibility, promotional tools, and return policies.
Fulfillment and last-mile delivery rely on warehouse and sorting capacity, courier networks, and parcel locker infrastructure that support nationwide coverage and Baltic cross-border flows. Downstream activities include carrier and parcel-network partners and cross-border routing into Latvia, Estonia, and Poland, while reverse logistics has become a distinct cost center given elevated return rates in apparel and footwear. That, in turn, increases the role of inspection, refurbishment/resale, and disposal or compliance partners in the ecosystem.
Competitive Landscape
The Lithuania e-commerce market hosts a mixed structure of local champions and multinational entrants. Vinted, Pigu, Senukai, Varle, and Barbora anchor domestic traffic, while Amazon, AliExpress, and eBay skim discretionary spend from cross-border shoppers. Vinted commands scale advantages through a EUR 5 billion (USD 5.4 billion) valuation and integrated wallet licensing that supports lower clearing costs.
Local retailers differentiate with private labels, omnichannel click-and-collect, and Baltic-focused courier alliances. Pigu’s February 2025 restructuring reinstated founder Dainius Liulys to revive service standards and liquidity, signaling strategic emphasis on core assortment and fulfillment excellence. Maxima Group expands dark stores and last-mile fleets to defend grocery share against rapid-delivery newcomers.
Strategic plays include secondary equity rounds to fund infrastructure, as seen in Vinted’s EUR 340 million (USD 370 million) sale led by TPG, aimed at category diversification and AI-driven merchandising. Logistics operators pursue sustainability differentiation with reusable packaging and carbon-footprint tracking, gaining B2B contracts from eco-conscious merchants.
Start-ups cluster around payment orchestration, last-mile robotics, and reverse-logistics platforms, leveraging Lithuania’s favorable sandbox regulations. Global entrants monitor the market’s affluent digital users but must absorb GDPR compliance costs and navigate linguistic adaptations.
Lithuania E-commerce Industry Leaders
UAB Pigu (Pigu.lt)
Kesko Senukai Digital UAB (Senukai.lt)
UAB Varle (Varle.lt)
UAB Barbora (Barbora.lt)
Vinted UAB (Vinted)
- *Disclaimer: Major Players sorted in no particular order

Market Opportunities and Future Outlook
Compliance-driven platform upgrades create whitespace for tools that help merchants and marketplaces operationalize EU-aligned requirements, particularly around consumer withdrawal journeys and marketplace traceability obligations under the Digital Services Act as implemented in Lithuania. The June 19, 2026 withdrawal-button requirement lifts the need for compliant checkout and post-purchase modules, while the Communications Regulatory Authority (RRT) role as digital services coordinator raises expectations for governance, complaint handling, and transparency processes for intermediaries.
Operational efficiency and omnichannel digitization are also active investment themes among leading retailers, which opens room for e-commerce-linked automation, pricing accuracy, and inventory optimization. Senukai partnering with Vusion to deploy AI-driven retail technology (including electronic shelf labels) across 94 stores was announced in January 2026, and the Aibe retail alliance (over 1,400 stores) began a network rollout of Solum electronic shelf labels in February 2026, strengthening real-time pricing and stock visibility that can support click-and-collect and rapid fulfillment models. Public funding under the EU funds investment program (2021-2027) supports SME digitization, including support for e-sales and digital solutions, expanding the addressable base of smaller merchants moving online.
Recent Industry Developments
- July 2026: UAB Pigu reported a swing toward improved operating performance, including positive EBITDA, alongside strong revenue growth during its first-quarter reporting period. The update signaled a sharper focus on efficiency and profitability levers in a market where fulfillment and returns can pressure margins.
- May 2026: UAB Pigu Group announced the rollout of a cross-border Lithuania-Poland delivery program, expanding fulfillment capacity and speed for Baltic shoppers. The initiative strengthens cross-border e-commerce and supports faster order fulfillment in the region.
- April 2025: Venipak opened its largest logistics terminal in the Baltics in Kaunas, an 11,000 square meter facility designed to process up to 50,000 parcels per day. The expansion strengthened linehaul and sorting capacity for Lithuania and neighboring Baltic routes, supporting faster delivery and higher peak-season throughput for e-commerce shippers.


Research Methodology Framework and Report Scope
Market Definition and Coverage
For this study, the Lithuania e-commerce market is measured as the value of goods and services ordered by buyers in Lithuania through internet-connected websites or mobile apps, counted at checkout in USD, and covering domestic and cross-border orders.
Scope exclusions: We do not include in-store card payments, online advertising spend, or purely digital content subscriptions.
Segmentation Overview
- By Business Model
- B2C
- B2B
- C2C
- By Device Type
- Smartphone / Mobile
- Desktop and Laptop
- Other Device Types
- By Payment Method
- Credit / Debit Cards
- Digital Wallets
- BNPL
- Other Payment Method
- By B2C Product Category
- Beauty and Personal Care
- Consumer Electronics
- Fashion and Apparel
- Food and Beverages
- Furniture and Home
- Toys, DIY and Media
- Other Product Categories
Data Sources, Market Sizing, and Validation
Desk Research
Desk research set the foundation for how big the demand pool can be, and it helped keep the model tied to observable digital commerce signals. We used public datasets and portals such as Statistics Lithuania, Eurostat, the Bank of Lithuania, and the European Commission digital economy indicators, which inform internet use, payment behavior, and cross-border buying patterns.
To make the sizing practical, we also reviewed company filings and investor presentations where available, marketplace and merchant announcements, and reputed press for changes in delivery networks and online retail adoption. We referenced a paid company financials database and another focused on shipment-level import and export flows to sanity check revenue ranges and cross-border intensity. These examples are not exhaustive, and other public sources were also used during data collection, validation, and clarification.
Primary Interviews and Surveys
We use interviews and surveys with e-commerce sellers, marketplaces, payment specialists, logistics providers, and retail or digital-commerce managers in Lithuania. Their views help validate reported e-sales, average order values, cross-border demand, marketplace shares, and delivery patterns, while filling gaps in public data. Analysts compare these inputs with desk results and revisit assumptions when answers vary.
Distribution of primary research fieldwork respondents
| Company type | Respondent position |
|---|---|
| Top tier: 28% | CXOs: 15% |
| Mid tier: 47% | Functional/Unit leaders: 30% |
| Smaller Players: 25% | Managers: 55% |
Market-Sizing & Forecasting
The market was first built using a top-down approach where Lithuania-level retail spending, online purchase penetration, and cross-border buying shares are used to reconstruct the online order value pool. Once that total was formed, selective bottom-up approximations were used as checkpoints, such as sampling average order values and order frequency by category, and comparing them with supplier and merchant revenue ranges from public disclosures and interviews.
Key model inputs included internet and smartphone usage, online buyer share, payment mix shifts (cards and digital wallets), delivery and return intensity, and the split of domestic versus cross-border orders. Where direct inputs were missing for smaller categories, we used clearly stated proxy variables (like buyer penetration and category spend weights) and then corrected them through interview feedback. For forecasting, we applied scenario analysis around adoption speed, cross-border mix, and price inflation, and then aligned the final path to what most primary respondents described as realistic for 2026 to 2031.
Data Validation & Update Cycle
Outputs were triangulated against independent signals such as national statistics on online buyers, payments data trends, and trade and logistics indicators that reflect cross-border shopping. Outliers were flagged when growth or penetration implied unrealistic jumps, and then assumptions were revisited, with respondents re-contacted when needed to confirm what changed.
Each major step in the model is reviewed by another analyst before sign-off to catch calculation errors and scope drift early. The report is refreshed annually, and interim updates are made when material changes can shift demand, pricing, or cross-border flows. Before delivery, we do a fresh pass on key inputs and recent news so clients receive an updated view.
Mordor Intelligence's Lithuania Ecommerce Market Size Versus Other Published Estimates
Published market sizes for Lithuania e-commerce can look far apart because the underlying definition is not always the same, even when the title sounds identical. Differences usually come from what gets counted as e-commerce value, whether cross-border orders are included, and how currencies and inflation are handled in the base year.
The main gap drivers in this market are whether figures represent GMV at checkout versus only merchant revenue, and whether B2B and C2C transactions are included alongside B2C. Some estimates also blend in digital subscriptions or count in-store card payments that happened after online discovery, which can inflate the total. A stricter treatment of cross-border orders and the use of yearly average exchange rates for USD conversion also changes the final number, and these choices explain why the USD 3.18 B (2025) baseline lands where it does in Mordor Intelligence.
Benchmark comparison
| Source | Market Size | Gaps in Research Methodology |
|---|---|---|
| Mordor Intelligence | USD 3.18 B (2025) | |
| Industry Association A | USD 2.74 B (2025) | Often limited to domestic merchant sales and reported turnover, which tends to undercount cross-border marketplaces and C2C activity, and may net out taxes and returns differently. |
| Trade Journal B | USD 3.92 B (2025) | Commonly uses broader online spending proxies that can fold in digital subscriptions and other adjacent online payments, and may apply aggressive online penetration assumptions without interview-based checks. |
Looking across the three figures, most of the spread is explained by what is counted at checkout and how cross-border and non-B2C activity is treated. Our approach keeps the total traceable to a small set of repeatable inputs, and then uses interviews to correct the assumptions that are usually the hardest to observe from public data alone.


Key Questions Answered in the Report
What is the current size of the Lithuania e-commerce market?
The market stands at USD 3.66 billion in 2026 and is forecast to reach USD 7.44 billion by 2031.
Which business model is growing fastest in Lithuania’s online retail space?
Consumer-to-consumer platforms are expanding at an 18.35% CAGR, outpacing traditional B2C channels.
How dominant is mobile commerce in Lithuania?
Mobile devices captured 62.55% of transactions in 2025 and will maintain double-digit growth through 2031.
What payment method is gaining the most traction?
Digital wallets, growing at 20.98% CAGR, are rapidly displacing credit and debit cards.
Which product category is expanding fastest?
Online food and beverage sales are rising at a 17.05% CAGR due to improved cold-chain logistics and consumer demand for convenience.
How strict is data-privacy enforcement in Lithuanian e-commerce?
The State Data Protection Inspectorate’s EUR 2.38 million (USD 2.74 million) fine on Vinted highlights heightened GDPR oversight and the need for robust compliance frameworks.
Page last updated on:


 Your data is secure and never sold or shared.


